


Abstract
The global shift towards plant-based food consumption presents significant environmental benefits, yet the consequential rise in related by-products still imposes a challenge to be addressed. The present work was carried out to evaluate the rheological properties of bread dough as affected by the incorporation of dry fractionated oat drink residue flours as a functional ingredient to identify the optimum condition for incorporating fibre-rich ingredients in bakery products. Mechanically dry fractionated, dried oat drink residue flour of particle size F1: > 150, F2: 150–224, and F3: 224–300 μm was blended with strong wheat flour at 10% and 20% substitution levels of the wheat flour. The resulting doughs were assessed for their rheological characteristics. Results from Mixolab, Rapid Visco Analyser, and gel texture properties revealed that 10F3 showed the highest peak viscosity; 20F2 exhibited the highest water absorption value (66.7%), whereas 20F2 showed the lowest gel hardness level compared to control (100% wheat flour). Principal component analysis (PCA) showed that the specific surface area of the flour composite is a key feature determining dough rheological properties. Additionally, cluster analysis results revealed that, within measured parameters, flour pasting properties are the most representative of the flour composite characteristics. Moreover, the analysis was able to discriminate between different flour composites based on their rheological properties. The TOPSIS-Shannon entropy approach was used to increase the inclusion level of non-wheat components in the bread formulations while maintaining the structural quality of the bread. The comparison between different flour composites via TOPSIS analysis revealed that 10F2 was the best formulation in terms of instrumental quality properties of the resultant bread among other flour composites. It was observed that the effect of inclusion level outweighs the effect of particle size distribution on incorporated fibre-rich ingredients in terms of affecting the texture quality characteristics of the resultant bread. Results highlight the potential application of fractionated oat drink residue flour for blending with wheat flour properties to produce fibre-rich bakery products.
Practical applications
The practical application of this work is to highlight the potential of using the dry fractionation process as a green process to improve the life cycle assessment of oat-drink production by producing a fibre-rich bread product. Moreover, it broadens the application of oat-drink residue in food innovation to improve consumer demand by applying a dry fractionation process. Additionally, the study highlighted the capabilities of multivariate statistical analysis and the TOPSIS-Shannon entropy method when using two main dough rheology tests to predict the instrumental quality characteristics of the resulting bread affected by the inclusion of fibre-rich ingredients in the bread formulation. Thus, it offers valuable insights for future research and development in predictive mathematical modelling of instrumental quality characteristics of bread formulations.
Introduction
In recent times, the global food industry has witnessed an increasing trend in customer demand for plant-based substitutes for typical food products. Plant-based, cow milk substitutes are an example of the growing popularity of these product formats. Cow milk protein allergies, growing concerns over antibiotic resistance, sustainable food choices, and environmentally friendly aspects of plant drinks offered customers an alternative diet. Presently, many plant sources such as soy, oat, rice, almond, cashew, etc. are successfully developed as plant-based drinks. Riofrio and Baykara (2022) reported that oat drink demonstrated greater environmental performance (+80% lower Green House Gases (GHG) emissions) than conventional cow's milk. Oat drink is one of the most successful plant drink formats, and its overall life cycle assessment can be improved by valourising the drink production side stream, which is mainly composed of high dietary fibre, specifically soluble dietary fibre (Kobayashi et al., 2023).
Recently, many different research groups have added agricultural and side stream products rich in dietary fibre, such as wheat bran (Onipe et al., 2021) and rice bran (Aktaş & Akın, 2020), and some biopolymers such as β-glucan (Tiwari et al., 2013), arabinoxylan (Li et al., 2013), etc. to increase the fibre content of various food products. Various studies have shown that bran derived from oats can be used in bread production to improve the fibre content and achieve the desired sensory properties. These studies showed a significant improvement in the soluble phenolic acid content (Alrahmany et al., 2013; Hitayezu et al., 2015) and an improvement in the health profile of the bread produced by lowering cholesterol with glycaemic control due to the presence of soluble fibre such as β-glucan (Tiwari et al., 2013). However, bran addition can negatively impact the rheological properties of bread dough, eventually affecting the quality of baked products adversely (Pomeranz et al., 1977). Previous studies have researched the influence of bran particle size and different components on product quality; however, the results of these studies are inconsistent. Some studies have shown that increasing the particle size of bran can reduce the negative impact on product quality (Zhang & Moore, 1999), whereas some studies have reported that smaller bran particle sizes produced better bread quality (De Kock et al., 1999; Noort et al., 2010; Rashed et al., 2024).
The influence of bran on the rheological properties of dough and the quality of cereal products may be related to the interaction between the bran and gluten. Gluten is an important component of wheat flour that plays a decisive role in the rheological properties of dough and product quality. Adding bran may affect the formation of gluten network structure, which will eventually lead to the deterioration of the optimum rheological properties of dough and product quality (Graybosch et al., 1993; MacRitchie, 1999). At present, the hypotheses relating to the influence of fibre on the structure of the gluten network mainly point to the addition of fibre diluting gluten, puncturing air bubbles, hindering the formation of the gluten protein network, and that dietary fibre rich in bran will interact with starch, protein, etc. Competing for water leads to the redistribution of water in the dough, partial dehydration of gluten protein, and the collapse of the structure (Li et al., 2023; Liu et al., 2019; Si et al., 2021). In addition, the active substances released by the bran during the pulverisation process will also have an adverse effect on the formation of the gluten protein network (Bock & Damodaran, 2013; Welc-Stanowska et al., 2023; Xiao et al., 2021). Moreover, the presence of ferulic acid which accounts for approximately 75% of total polyphenols for oat (Ndolo et al., 2013) is responsible for weakening the gluten network and accelerating dough matrix breakdown (BK) (Nawrocka et al., 2023). Although these hypotheses can explain some phenomena found in the research, such as increased water absorption of bran dough and prolonged formation time, the mechanism of the influence of bran on the structure of gluten protein and the quality of flour products has not yet been elucidated, and further research is still needed. Consequently, improving the quality of high-dietary-fibre flour products has become a research hotspot today.
Determining the rheological parameters of dough has become an emerging approach for processing estimation, as it shows how the dough will act throughout mixing, fermentation, and baking to make high-quality goods. The dough mixing properties using (e.g., Mixolab or Farinograph) and Rapid Visco Analyser (RVA) are the most widely used empirical rheological tools for dough characterisation.
Fermentation is another important process in bread making because the bran, which is rich in fibre, minerals, and bioactive compounds, interacts with the dough components and influences yeast activity and gas production during fermentation. Certain minerals and free amino acids, for example, are among the components of bran that can increase yeast activity. However, inhibitory factors often outweigh this effect (Sanz-Penella et al., 2012). For example, these minerals themselves can have a buffering effect on the pH of the dough, which can influence the rate of acid development during fermentation (Poutanen et al., 2009). Also, the dilution of fermentable sugars and components inhibit the activity of yeast (Ćurić et al., 2007). In addition, the physical interference of bran particles within the gluten network can lead to a reduced gas retention capacity of the dough (Hemdane et al., 2016). These factors could be the main reasons for the reduction in the volume of bread made from high-fibre flour formulations.
TOPSIS, a technique for order of preference by similarity to the ideal solution, is a multi-criteria decision analysis method. It is a ranking approach for selecting the best alternative with the shortest distance from the positive ideal solution and the farthest distance from the negative ideal solution (Yang et al., 2018). There is different research work that has used the TOPSIS approach in different contexts; for example, Ansarifar et al. (2015) have used this approach for evaluating the physicochemical properties of fried cheese nuggets. Also, Noshad et al. (2018) used the TOPSIS method for evaluating osmotic dehydrated strawberries when applying ultrasonication. Additionally, it has been used for evaluating the effects of edible coatings on the nutritional and antioxidant quality of the jujube fruit (Kou et al., 2017) and strawberry (Khodaei et al., 2021). Shannon entropy is one of the multi-criteria decision-making approaches to calculating the characteristics' objective weights based on measuring the uncertainty involved in a random process (Wu et al., 2013).
The aim of this work was to investigate the effects of the inclusion of 10% and 20% fractionated oat drink residues on the rheological properties of bread dough and the structure of the gluten protein in order to provide a theoretical basis for improving the quality of bran-containing products. In addition, the optimal fibre-rich flour formulation was to be determined with minimal instrumental texture changes in the resultant bread. In addition, the work investigates the capabilities of multivariate statistical analysis and the TOPSIS-Shannon entropy method when using two main dough rheology tests to predict the instrumental quality characteristics of the resulting bread affected by the inclusion of oat drink residues in the bread formulation. Their ability to find the optimal fibre-enriched flour formulation to produce the bread with minimal instrumental texture changes.
Materials and methods
Materials
The oat drink residues were obtained from the Oatier Ltd. in the form of slurry; the moisture content of the slurry was determined using an IR moisture analyser (Sartorius MA100 Moisture Analyser, Fisher Scientific International, Inc., United States). The slurry was divided into different portions on 1-cm-thick aluminium trays and dried using the Memmert hot air oven (Memmert GmbH+ Co. KG, Schwabach, Germany) at 60 °C for 12 hr until a moisture content of 10% was reached. Dried oat drink residues were milled using a Retsch SM 300 cutting mill (Verder Scientific Ltd, Hope Valley, UK) to obtain oat residue flour. Commercial strong wheat flour was sourced from Nelstrop & Co Ltd, (UK); dough improver was sourced from IREKS Ltd, (Chester Business Park, UK); and other items such as salt, yeast, and unsalted butter were purchased locally in Dublin, Ireland.
Flour blends
Oat flour fractions and mixture preparation
The flour from oat drink residues was mechanically fractionated using a VWR test sieve shaker (VWR-EML 200 premium, Haver & Boecker, Germany) with an amplitude of 3 mm for 30 min to obtain three different particle size fractions: > 150 μm (F1), 150–224 μm (F2), and 224–300 μm (F3). The oat drink residue flour fractions were used as substitutes for wheat flour in a bread formulation at 10% and 20%, resulting in seven combinations (six mixed flours and one control sample). These substitution levels were selected based on the preliminary baking trials with a range of oat flour substitution levels (5%–40%) used to select the substitution levels in this study. Table 1 shows the different combinations used to make breads from the strong wheat flour control (100%) and the blended flours from oat drink residue flour.
Combinations used for production of flour blends comprising wheat flour (100%) and wheat with oat drink residue flour composites.
| Experiment runs | 1 | 2 | 3 | 4 |
|---|---|---|---|---|
| Particle size (μm) | ˂150 μm (F1) | 150–224 μm (F2) | 224–300 μm (F3) | Control |
| Mass ratio (%) | 26 | 41 | 33 | |
| 10% | 10F1 | 10F2 | 10F3 | |
| 20% | 20F1 | 20F2 | 20F3 |
| Experiment runs | 1 | 2 | 3 | 4 |
|---|---|---|---|---|
| Particle size (μm) | ˂150 μm (F1) | 150–224 μm (F2) | 224–300 μm (F3) | Control |
| Mass ratio (%) | 26 | 41 | 33 | |
| 10% | 10F1 | 10F2 | 10F3 | |
| 20% | 20F1 | 20F2 | 20F3 |
Particle size analysis
The Mastersizer 3000 (Aero S Unit, Malvern Instruments Ltd, Worcestershire, UK) used static light scattering to determine the particle size distribution of flour mixtures using the same procedures as described in our earlier work (Rashed et al., 2024).
Dough mixing properties
The flour mixtures were prepared according to Table 1. Wheat flour, oat drink residue flour, and wheat–oat drink residue flour were analysed using Mixolab® (Chopin Technologies, Paris, France). The standard Chopin+ protocol was established according to the manufacturer's instructions. The moisture content of the flour mixtures was measured according to the AACC 14-15A method (2001). The following dough mixing properties were recorded, water absorption (in percent); initial maximum consistency, C1 (in Newton metres), which determine water absorption; dough development time (in minutes); C2 (in Newton metres) which is the minimum torque value at the beginning of heating; C3 which is the peak torque generated during the heating phase and represents the weakening of the protein network due to the mechanical work and rising temperature; C4 which is the cooking stability and represents the ratio of the torque generated after the heating phase, which is related to the rate of starch gelatinisation; C5 which is the difference between the torque generated after cooling at 50 °C and corresponds to the stability of the hot-formed gel and the retrogradation of the starch during the cooling phase; C3–C2 which corresponds to the rate of starch gelatinisation; and C5–C4 which corresponds to the shelf life of the final products.
Flour pasting properties
The pasting properties of the wheat flour and wheat–oat drink residue flour mixtures were determined using a RVA (Newport Scientific Pty Ltd, Warriewood, Australia). The pasting properties were determined according to Newport Scientific standard methods following the procedures described by Rashed et al. (2024). Samples (3.5 g) were weighed on a 14% moisture basis together with 25 g of deionized water in an aluminium test sample holder. The samples were placed in the tower of the apparatus after the suspension had been stirred for 30 s. In this protocol, a heating cycle was performed at 50 °C for 1 min, and then, it was heated to 95 °C in 5 min, maintained at 95 °C for 2.5 min and finally cooled to 50 °C in 5 min. Using TCW3.11.298 software, the values of peak viscosity (PV), average viscosity, final viscosity (FV), BK, and setback (SB) were determined from the pasting curve. The analysis was carried out in triplicate.
Gel texture
The flour gels obtained from the RVA test were stored in RVA aluminium container with a diameter of 30 mm and a height of 15 mm for 24 hr at room temperature (20 °C), covered with cling film to prevent moisture evaporation. The texture analyser (TA XT2i Stable Micro Systems Ltd., Surrey, UK) was equipped with a 25-kg load cell and a 20-mm cylindrical probe that produced a constant velocity of 2 mm/s into the sample and a depth of 15 mm. The curve obtained provided peak strength values. The analyses were carried out in triplicate.
Bread formulation
All bread doughs were prepared as described in Table 2. The ingredients were mixed in a Kenwood mixer with a dough hook attachment until the optimum mixing time was reached (determined using the Mixolab® results mentioned above). The dough was covered and rested for 30 min at 35 °C and 80% relative humidity (Koma CDS Sunriser, Netherlands). The dough was then divided into 65 g pieces, kneaded and moulded, and placed into pup loaf tins (80 × 60 × 40 mm). The doughs were proofed for 45 min at 35 °C and 80% relative humidity (Koma CDSSunriser, Netherlands). The breads were baked for 18 min at 200 °C/220 °C (bottom/top heat) in a deck oven (MacPan, Thiene, Italy). They were then cooled to ambient temperature before being stored in polyethylene bags. All breads were produced in triplicate.
Formulations used for the production of breads from wheat flour (100%) and fractionated oat-milk residue flour composites at different particle sizes and mixing ratios.
| Wheat controla | Oat flour fractionsa | ||
|---|---|---|---|
| 10% | 20% | ||
| Wheat flour b | 100 | 90 | 80 |
| Oat flour | - | 10 | 20 |
| Fat | 1 | 1 | 1 |
| Salt | 2 | 2 | 2 |
| Improver | 1.5 | 1.5 | 1.5 |
| Yeast | 1.2 | 1.2 | 1.2 |
| Wheat controla | Oat flour fractionsa | ||
|---|---|---|---|
| 10% | 20% | ||
| Wheat flour b | 100 | 90 | 80 |
| Oat flour | - | 10 | 20 |
| Fat | 1 | 1 | 1 |
| Salt | 2 | 2 | 2 |
| Improver | 1.5 | 1.5 | 1.5 |
| Yeast | 1.2 | 1.2 | 1.2 |
Note. aIngredients listed as g/100 g of total flour used.
Amount of water (g) and mixing time (min) determined by Mixolab measurements for each oat-milk residue flour fraction and mixing ratio.
Instrumental quality characterisation of bread samples
Loaf dimensions
Three loaves produced in the batch were used to calculate the volume, specific volume, and density using the Volscan profiler Ceramscan (CRS300C, Stable Micro Systems, Surrey, UK).
Crumb characteristics
Three loaves produced batch were sliced vertically through the centre, with a slice (1 cm thick) cut from each half (six bread slices). The crumb texture was evaluated using a texture analyser (TA-XT2i, Stable Microsystems, Surrey, UK) outfitted with a 25-kg load cell and a 20-mm cylindrical probe. The texture profile analysis test requirements were as follows: pre-test speed of 2 mm/s, test speed of 1 mm/s, post-test speed of 5 mm/s, sample compression set to 40%, and double compression (with a 30-s delay between cycles). The experiment used six centred 1 cm slices (two duplicates for each loaf). The test was carried out at 24 hr post-baking.
Statistical analysis
Samples were analysed in triplicate unless otherwise stated, and results were expressed as M ± SD. Two-way (flour fractions and inclusion levels) fixed model analysis of variance (ANOVA) was carried out using Genstat (64-bit Release 19.1, VSN International Ltd.). Statistical significance was considered at p ≤ .05. Where ANOVA indicated that significant differences were present, a Tukey's pairwise comparison was conducted to identify where sample differences occurred. Bivariate Pearson's correlation analysis was used to assess correlations between flour and dough parameters against bread quality, and a correlation significance test was carried out at (p < .05).
Principal component analysis (PCA) was performed on the mean data using Pearson correlation to determine correlations between different dough rheology measurements. A biplot in the first two components of the PCA was performed, used to assess product space. Agglomerative hierarchical clustering (AHC) was used on the mean values, employing proximity-type dissimilarities. The truncation used was the Hartigan index from 4 to 5, and a vertical dendogram was used in the results illustration. Both PCA and AHC analyses were performed using XLSTAT software (XLSTAT Version 2020.6.03).
TOPSIS analyses
The TOPSIS approach (Sabaghi et al., 2015) was used in the current study to rank the treatments after measuring their distance from the positive and negative ideal solutions and evaluating the impact of the inclusion of oat drink residue flour on dough quality characteristics. In this study, we have followed the procedures described previously by Khodaei et al. (2021) with some modifications as follows:
1) The construction of a decision-making matrix with m (evaluation objects) and n (adaptive capacity indicators).
- 2) The calculation of the weight for each criterion for developing a weighted normalised decision-making matrix$$ {V}_{ij}={W}_{ij}\times{r}_{ij} $$
- 3) The Shannon entropy method was used for assigning the weight of each criterion following the procedures described earlier by Li et al. (2011) for calculating the entropy for each criterion:$$ {P}_{ij}=\frac{X_{ij}}{\sum_{i=1}^m Xij}\ \mathrm{j}=1,2,\dots \dots .n. $$
- 4) Calculating the distance of each criterion from the entropy and the weight of each criterion as follows:$$ {d}_j=1-{E}_j $$
- 5) The determination of the positive and negative alternative is as follows:$$ {A}^{+}=\left\{\left(\max Vij\left|j\mathrm{\varepsilon} \mathrm{J}\Big),\Big(\min{V}_{ij}\right|j\mathrm{\varepsilon} {J}^{\prime}\right)\right\} $$
- 6) The determination of the distance of the normalised weighted matrix from ideal positive and negative points as follows:$$ {\mathrm{Si}}^{+}=\sqrt{\sum{\left({V}_{ij}-{V_i}^{+}\right)}^2},{\mathrm{Si}}^{-}=\sqrt{\sum{\left({V}_{ij}-{V_i}^{-}\right)}^2} $$
- 7) Calculating the distance from the ideal point$$ {\mathrm{Pi}}^{+}=\frac{{\mathrm{Si}}^{-}}{{\mathrm{Si}}^{+}+{\mathrm{Si}}^{-}} $$
8) Assigning the perforce index (Pi) and the scoring for different treatments
Results and discussion
Particle size analysis of the fractions
The determination of flour particle size is a crucial factor that influences dough and bread technological features, not only water absorption and staling behaviour but also it determines sensorial properties of the bread produced. Figure 1 illustrates the volume density (%) of different flour composites studied. The results of the control wheat flour sample revealed almost a bimodal distribution with a main mode around 100 μm. Devaux et al. (1998) have previously highlighted a similar finding, as hard wheats that can be used for bread formulation display one main mode at approximately 120 μm, as opposed to a clear bimodal distribution observed in soft wheat flours (20–25 and 110 μm). These findings have been confirmed recently by different authors (Kumar et al., 2016; Rashed et al., 2024).
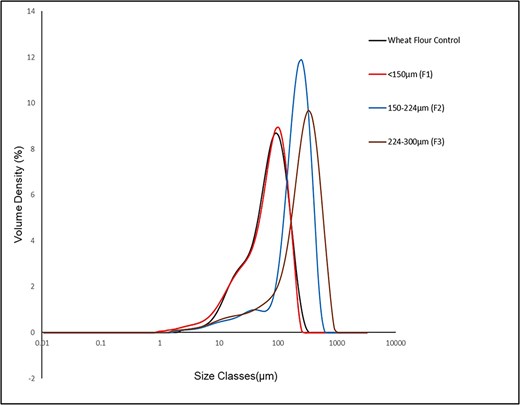
Particle size distribution of the flours (control: wheat flour, F1: oat drink residue flour < 150 μm, F2: oat drink residue flour 150–224 μm, and F3: oat drink residue flour 224–300 μm.
Regarding the oat drink residue flour fractions, the Dv50 and Dv[4,3] values of different fractions increased linearly as the particle size of the fractions increased. Adding alpha-amylase enzymes in oat-based beverage production can significantly affect the physical characteristics of starch granules, such as altering the size and shape of the starch granule, granule damage, gelatinisation, and water holding capacity. Jeong et al. (2022) have mentioned these characteristics previously as the addition of alpha-amylase and cellulase enzymes to oat flakes leads to the degradation of long polysaccharide chains, resulting in increased water absorption capacity and decreased hardness and adhesiveness of oat flakes. The particle size distribution of oat drink residue < 150 μm showed a bimodal distribution almost the same as the control wheat sample. This bimodal distribution has been previously discussed in different studies as a distinctive feature of cereal flours (Becker et al., 2001; Nguyen et al., 2021; White et al., 2008). These studies highlighted that starch granules that are mechanically separated during milling correspond to the fine population, which range in size from around 25–40 μm; consequently, these findings could be attributed to the residual protein and starch remains in this oat drink residue flour after oat drink processing procedures displayed this behaviour. Moreover, adding alpha-amylase enzymes in oat-based beverage production can significantly affect the physical characteristics of starch granules, such as change in size and shape of starch granule, granule damage, gelatinisation, and water holding capacity.
Within all the different samples tested, F3 had the highest Dv50 value, representing the highest particle size distribution, whereas wheat control had the lowest Dv50 value. These variations in distribution curves of wheat flour compared with oat drink residue flour are a result of the variations in their composition, for instance, the variations in their content of starch, protein, and fibres, between these different flour fractions. This observation was previously highlighted as a mode shift due to the increased presence of bran fractions (Dziki et al., 2020).
Specific surface area (m2/kg) refers to the total surface area of a material per unit of mass. In flour, it is influenced by the particle size: smaller particles have a larger surface area per unit mass compared to larger particles. Specific surface area is crucial in determining the interaction of flour with water and other ingredients, influencing the flour's technological properties. For example, in terms of the interaction with water, it is important to highlight that the higher flour particles have more surface area, the higher water absorption. This is because the finer particles can absorb more water quickly due to the increased surface area (Rosell et al., 2007). Also, the increased surface area allows for greater water interaction and starch swelling during heating, resulting in a higher PV (Tester & Morrison, 1990), trough viscosity (TV), and BD (Zeng et al., 2014). Further details on the particle size distribution of wheat flour with different mixing ratios of oat-drink residue flour in different particle sizes. can be found in Table 1 in the supplementary materials.
Dough mixing properties
Table 3 represents the dough mixing properties of the flour as determined by Mixolab®. The determination of water absorption properties plays a fundamental role in understanding and determining both hydration and rheological properties, along with monitoring gluten network development, which effectively influences the quality attributes of the final bread produced (Oomah, 1987).
Dough properties from Mixolab® of wheat flour (100%), wheat with different oat drink residue flour composites.
| Sample name | Water absorption | Mixing time | Dough deviation time | C2 | C3 | C4 | C5 | C3-C2 | C5-C4 |
|---|---|---|---|---|---|---|---|---|---|
| Control | 62.73 ± 0.25a | 7.71 ± 0.55b | 10.62 ± 0.13c | 16.47 ± 0.03a | 23.70 ± 0.72b | 30.71 ± 0.33ab | 45.04 ± 0.01a | 7.237 ± 0.74c | 14.33 ± 0.35b |
| 10F1 | 65.17 ± 0.12c | 6.91 ± 0.28ab | 7.60 ± 1.41b | 16.66 ± 0.24a | 22.59 ± 0.16ab | 30.48 ± 0.36a | 45.04 ± 0.01a | 5.933 ± 0.38ab | 14.56 ± 0.37b |
| 10F2 | 64.20 ± 0.20b | 7.22 ± 0.25ab | 8.48 ± 0.25b | 16.60 ± 0.32a | 23.26 ± 0.05ab | 31.42 ± 0.15bc | 45.05 ± 0.0a | 6.663 ± 0.31bc | 13.63 ± 0.15ab |
| 10F3 | 65.20 ± 0.44c | 6.92 ± 0.32ab | 7.72 ± 0.12b | 16.58 ± 0.60a | 22.72 ± 0.74ab | 31.15 ± 0.13abc | 45.04 ± 0.0a | 6.137 ± 0.56abc | 13.89 ± 0.13ab |
| 20F1 | 65.40 ± 0.06c | 6.52 ± 0.12a | 7.55 ± 0.22b | 16.68 ± 0.28a | 22.22 ± 0.19a | 31.69 ± 0.16c | 45.03 ± 0.01a | 5.540 ± 0.10ab | 13.34 ± 0.16a |
| 20F2 | 66.73 ± 0.46d | 7.05 ± 0.04ab | 5.33 ± 0.84a | 16.69 ± 0.31a | 22.18 ± 0.56a | 30.98 ± 0.13abc | 45.04 ± 0.01a | 5.490 ± 0.25ab | 14.06 ± 0.14ab |
| 20F3 | 66.63 ± 0.12d | 7.04 ± 0.13ab | 5.43 ± 0.12a | 16.83 ± 0.12a | 22.29 ± 0.22a | 30.80 ± 0.67abc | 45.05 ± 0.0a | 5.457 ± 0.32a | 14.25 ± 0.67ab |
Note. Data are presented as M ± SD from triplicate analysis. Data are presented as M ± SD. Values with different letters (a–e) are significantly different (p < .05). Control = wheat flour; F1 = oat drink residue flour < 150 μm; F2 = oat drink residue flour 150–224 μm; F3 = oat drink residue flour 224–300 μm.
The data presented highlight that the inclusion of oat drink residue flour fractions led to a significant (p < .05) increase in the values of water absorption from 62.7 ± 0.25 for the wheat control to 66.7 ± 0.46 for 20F2. The results highlighted that there is a general trend towards increasing water absorption levels with an increase in both particle size and inclusion level. Nevertheless, it is worth emphasising that, in comparison to the control wheat flour, the influence of inclusion level was more noticeable compared with the effect of particle size in increasing the water absorption of the flour mixtures produced. This clearly appeared in both F2 and F3 when comparing water absorption levels at two different mixing levels for the same particle size distribution used. Furthermore, it is related to the usage of alpha amylases during oat drink production process and the level of starch degradation during the liquefaction process. Different research studies have studied the phenomenon of increasing water absorption in dough with the inclusion of both fine and coarse bran fractions. For example, the increase in hydrogen bond formation with water because of the increased exposure of hydroxyl groups distributed along the fibre structure in fine fractions is responsible for increasing water absorption in mixtures containing fine fractions of bran (Penella et al., 2008).
Moreover, the formation of these hydrogen bonds is greatly assisted by the existence of nanopores in the bran fractions (Jacobs et al., 2015). Furthermore, although the presence of mixed-linked β-glucans in high levels in fine fractions can cause an increase in water absorption, the existence of cell wall polysaccharides, such as arabinoxylans, is predominantly the main factor for increasing the water absorption of the dough (Bieniek & Buksa, 2023; Lovegrove et al., 2020). As it has been stated before, fractionation of whole meal oat flour can further divide the naturally occurring soluble and insoluble arabinoxylans fractions, as they are present at lower levels in the oat endosperm compared with the oat bran (Antoine et al., 2003; Buranasompob et al., 2007; Jiménez-Castaño et al., 2007). Consequently, it can be the main factor in increasing the water absorption of the dough. Furthermore, different studies confirmed that the increase in water absorption in the coarse bran fraction is a result of the existence of arabinoxylans present in this higher particle size (Buranasompob et al., 2007; Courtin & Delcour, 2002; Larkin et al., 2021).
Other dough mixing properties such as dough stability and dough-developing time play an important role in determining the mechanical properties of bread dough. Results obtained revealed that there was a significant (p < .05) reduction compared with wheat flour following the addition of oat drink residue flour for dough stability and dough-development time at all different particle sizes and mixing levels, repressing an adverse impact on gluten network formation. This impact could be attributed to the dilution of the gluten, which reduced the dough's strength and consequently weakened the overall gluten network (Lin et al., 2012). Moreover, the presence of β-glucans has been reported to influence dough texture through the formation of an elastic, semi-rigid gel-like matrix similar to glucan gels (Tudorica et al., 2004). Furthermore, the inclusion of oat drink residue flour with high fibre content, particularly at lower particle sizes, could interfere with the formation of the starch–gluten matrix (Han et al., 2019). Similarly, it has been previously stated that the addition of high-fibre barley ingredients increases dough water absorption significantly, and this increase was associated with a significant reduction in dough development time. Additionally, with the increase in barley flour high in β-glucan, the mixing time was significantly reduced (Abdullah et al., 2022; Shetti, 2023).
The C2 (in newton metre) is the maximum torque produced during the heating stage; this value represents the weakening of the protein network based on the mechanical work and the increasing temperature. However, the reduction observed with both dough stability and dough-developing time, it was noted that there was no significant (p < .05) change with the inclusion of oat drink residue flour. This indicates that adding oat drink residue flour does not significantly affect dough stability and development time, suggesting that this addition does not substantially adversely affect the resultant properties of the breads. These findings are in line with the results obtained previously by other authors (de Bruijn et al., 2011; Kim et al., 2014; Wang et al., 2002)
Dough mixing parameters, such as C4 followed by (C3–C2), are the most dough mixing parameters influenced by the inclusion of oat drink residue flour. Although there was a significant (p < .05) reduction in C3, indicating a reduction in starch gelatinisation, in general there were no significant differences (p < .05) for the C3 and C4 parameters except for 20F1. Inclusion of oat drink residue flour significantly (p < .05) affected the torque values associated with the starch gelatinisation range (C3–C2), as it significantly decreased with the increase in inclusion level regardless of the particle size of the oat drink residue flour used. These findings are in line with Banu et al. (2017), when oat bran was added to improve the rheological properties of dough and the quality of the wheat bread formulation. This phenomenon was previously explained by Rosell et al. (2010), as the presence of fibres being responsible for not only limiting the water availability required for starch pasting but also for interfering with the specific interaction between amylopectin molecules.
Flour pasting properties
The determination of the pasting properties of flour is an important property as it relates to dough rheology and baking quality characteristics. Different studies highlighted the impact of different flour mixture characteristics, including flour particle size distribution, the percentage of amylose and amylopectin, protein content, and fibre content (Balet et al., 2019). Table 4 presents the pasting properties of the oat drink residue/wheat flour blends. PV ranged from 1,925 ± 30.05 cP for the control sample to 2,822 ± 28.35 cP for 10F3.There was a significant (p < .05) increase in PV for samples containing, particularly 10%, oat drink residue flour with the increase in particle size of the oat drink residue flour used. This finding could be attributed to many different reasons. Firstly, PV is closely associated with the maximum swelling capacity of the starch granules, and the existence of fibres binds water, reducing the available water required for starch granules to swelling (Boita et al., 2016). Additionally, the presence of damaged starch content in the flour mixtures, because of enzymatic treatment during oat drink production process, which has the ability to absorb water more than undamaged starch, will be responsible for increasing the viscosity of flour pastes (Rashed et al., 2024). Also, the extent of swelling could be attributed to the phosphate and lipid content (BeMiller & Whistler, 2009). According to Morrison et al. (1984) phosphorus in oats is a component of lysophospholipids, including lysophosphatidyl choline, lysophosphatidyl ethanolamine, and lysophosphatidyl glycerol. The proportion of lysophospholipids to free fatty acids in internal starch lipids varies with species, but in oats, 30% typically occurs as free fatty acids. Finally, increasing the particle size of oat drink residue flour can limit the ability of starch grains to swell (Bala et al., 2020). The property of PV is important, as it is not only an indication of the water-holding capacity of the mixture (Cozzolino, 2016) but also it is often correlated with other quality properties of the sample (Balet et al., 2019). These findings were previously noted: the bigger the particle size of the fraction used, the better the structural characteristics of the bread produced (Rashed et al., 2024).
Starch pasting properties (Rapid Visco Analyser) of wheat flour (100%), wheat, and different oat drink residue flour composites.
| Sample | PV | TV | BD | FV | SB | PTime | PTemp |
|---|---|---|---|---|---|---|---|
| Control | 1925 ± 30.05a | 944 ± 17.95a | 984 ± 6.56a | 2,125 ± 20.6a | 1,184 ± 21.39a | 5.69 ± 0.03a | 65.57 ± 1.37a |
| 10F1 | 2,576 ± 51.93cd | 1,325 ± 17.50d | 1,254 ± 34bc | 2,737 ± 33.0bc | 1,413 ± 15.63cd | 5.83 ± 0.04abc | 65.83 ± 0.40a |
| 10F2 | 2,737 ± 136.46de | 1404d ± 62.52e | 1,333 ± 74.33cd | 2,868 ± 144.81cd | 1,464 ± 82.40d | 5.87 ± 0.04bc | 66.02 ± 0.83a |
| 10F3 | 2,822 ± 28.35e | 1,453 ± 21.17e | 1,369 ± 7.21d | 2,970 ± 38.28d | 1,517 ± 45.00d | 5.96 ± 0.07c | 65.98 ± 0.53a |
| 20F1 | 2,385 ± 48.50c | 1,224 ± 32.00c | 1,160 ± 16.5b | 2,542 ± 88.52b | 1,318 ± 56.54bc | 5.82 ± 0.04abc | 66.30 ± 0.03a |
| 20F2 | 2085 ± 52.0ab | 1,090 ± 22.52b | 995 ± 29.51a | 2,212 ± 25.53a | 1,122 ± 17.35a | 5.75 ± 0.08ab | 66.23 ± 0.51a |
| 20F3 | 2,161 ± 70.51b | 1,130 ± 30.83b | 1,031 ± 41.79a | 2,315 ± 83.52a | 1,185 ± 53.15ab | 5.89 ± 0.08bc | 66.77 ± 0.49a |
Note. Data are presented as M ± SD from triplicate analysis. Data are presented as M ± SD. Values with different letters (a–e) are significantly different (p < .05). BD = breakdown (PV − TV); FV = final viscosity; PV = peak viscosity; TV = trough viscosity; SB = setback (FV − TV); Ptime = peak time (min); Ptemp = pasting temperature (°C). Control = wheat flour; F1 = oat drink residue flour < 150 μm; F2 = oat drink residue flour 150–224 μm; F3 = oat drink residue flour 224–300 μm.
A rapid reduction in viscosity during the RVA test is a result of the release of both water and amylose leach from ruptured, swollen starch granules under the effect of high temperatures and shearing, known as TV. The existence of non-starch molecules is responsible for preventing different interactions between starch and water molecules, causing a reduction in TV, as highlighted previously by Majzoobi et al. (2014). Conversely, results showed that TV increased significantly (p < .05) from 944 (wheat control) to 1453 (10F3) as the particle size of the oat drink residue increased. This increase could be attributed to elevated levels of fibres incorporated into the mixtures, and their effect surpassed the effect of the non-starch molecules to reach the water (Rashed et al., 2024).
Generally, the results of PV, TV, and BD also showed there was a decline trend within all of these results with the increase of the inclusion level of oat drink residue. As starch is the primary component responsible for viscosity development during gelatinisation, the increase in oat drink residue flour content will be responsible for diluting the starch available to contribute to the viscosity, resulting in lower peak and TV values at the 20% inclusion level. The dilution effect of non-starch components on starch viscosity has been discussed previously, indicating that higher levels of inclusion lead to lower viscosity due to reduced starch concentration (Kim & White, 2012; Singh et al., 2003). In the same context of limiting required components for gelatinisation, elevated levels of fibre inclusion compete with starch for water. Generally, the viscosity increases with increasing particle of the flour used. This could be attributed to larger particles having higher water absorption capacity and swelling power during gelatinisation (de los Ángeles Cornejo-Villegas et al., 2013). The limited availability of water for starch gelatinisation can significantly reduce the viscosity, as starch granules require adequate water to swell and gelatinise effectively (Alcázar-Alay & Meireles, 2015). In addition, the presence of the non-starch polysaccharides present in the oat drink residue can interact with the starch in the flour, potentially inhibiting the full gelatinisation of starch granules. These interactions can limit the swelling and rupture of starch granules, thus reducing the PV and TV (Brennan et al., 2008; Kim & White, 2012). All of these factors together inhibit the full gelatinisation and swelling of starch granules, resulting in lower PV values as a response to the increase of the inclusion level of oat drink residue flour. A further reason for reducing TV values with the increasing of oat drink residue flour is that the higher fibre content at the 20% inclusion levels can interfere with the formation of a cohesive starch gel network. Fibres can disrupt the continuity of the gel, leading to a less stable structure and consequently lower TV (Alcázar-Alay & Meireles, 2015).
An additional result was that, with the increase in oat drink residue flour particle size and substitution level, there was an increase in BD value from 984 ± 6.56 cP (control) to the highest levels of 1,369 cP (10F3). This indicated an increased capacity of the flour blends to resist heating and shearing stress, as Kumar & Khatkar (2017) have reported it previously, and it could be noted from the results of increasing both peak time and pasting temperature of different flour blends. As BD is a result of the subtraction of TV from PV, the results behave similarly to both PV and TV.
The FV values reflect the viscosity of the flour mixtures after cooling, and they can be greatly influenced by the inclusion level of additional components. Research indicates that the inclusion of fibres is responsible for decreasing the FV. This decrease in FV can be attributed to the changes in functional and thermal properties of the flour blends when additional components are added. Moreover, the rheological characteristics of the flour mixtures are altered with the inclusion of fibres, leading to changes in viscosity and flow behaviour (Sakhare & Prabhasankar, 2017). The results showed a decrease in FV values when the inclusion level increases from 10% to 20%. This reduction can be attributed to the same reasons stated earlier for the reduction of PV and TV. In addition, higher fibre content can interfere with the formation of a cohesive and stable starch gel network. Fibres can disrupt the continuity of the gel structure, leading to a less stable gel structure and consequently lower FV (Alcázar-Alay & Meireles, 2015).
The peak time indicates the time required for the complete gelatinisation of starch. There was no significant difference (p < .05) in peak time between different flour blends; hence, bread loaves made with the inclusion of oat drink residue flour could have a similar starch gelatinisation level compared with bread made from a wheat flour control sample. While the addition of oat drink residue flour did not significantly (p < .05) increase the peak time compared with control. According to Vanmathi Mugasundari & Anandakumar (2022) bread with a soft crumb typically stales more slowly since more moisture is retained within the crumb, which affects bread shelf life. As incomplete gelatinisation has been reported to produce breadcrumbs with poor appearance and texture (Zanoni et al., 1995). These findings explain the sometimes poor texture and appearance of fibre-rich breads compared with bread made of white wheat flour.
The SB is the recovery of the paste viscosity throughout the cooling of the flour suspension at the end of the heating cycle. Additionally, it is closely related to the starch retrogradation and bread staling properties. The inclusion of oat drink residue flour fractions led to an increase in SB values from 1,184 ± 21.39 Cp (wheat control) to 1,517 ± 45Cp (10F3), and there were significant (p < .05) differences among the samples. This increase could be attributed to the reduction in protein content due to the addition of oat drink flour residue flour (Rashed et al., 2024).
Differences in pasting properties when blending the wheat flour with oat drink residue flours could be attributed to several attributes of the individual fractions used in the blends. For example, based on the results from PSD, it can be noted that wheat flour was much finer than the oat drink residue flours used; particle size influences not only the pasting profiles measured by RVA but also the hydration rate of the flour blend produced (Becker et al., 2001; Cozzolino, 2016). Moreover, different processing steps could be responsible for changing the pasting properties of the flour blends produced, as stated by different authors (Bello et al., 2022; Buzera et al., 2023). Predominantly for oat drink residue flours, which are produced after the enzymatic hydrolysis of oat groats using amylases, which hydrolysed starch and may influence the paste viscosity, and then dried and ground to produce the flour. The cooking and drying processes may cause starch gelatinisation. Accordingly, the starch in oat drink residue flours might be pre-gelatinised. Generally, many complex features influence the pasting properties of flour blends produced (Berski et al., 2016; Grace & Jeyakumar Henry, 2020; Nguyen et al., 2022). Hence, due to the complexity nature of the flour blends, it could explain why fewer significant (p < .05) differences are shown for the pasting profiles of the flour blends.
Generally, PV, BD, SB, and final viscosities have been identified as clear RVA indicators of bread-making quality (Leon et al., 2010). Hence, these parameters are predominantly used in the determination of bread-making quality studies (Balet et al., 2019). Our study has highlighted the complex interplay between starch and non-starch components in oat drink residue/wheat flour blends. Therefore, understanding these interactions is key for optimising flour blends for balancing the benefits of fibre inclusion in bread formulations with the need for desirable pasting and baking properties.
Gel texture
The determination of the textural properties of the gels produced from the RVA provides information on the retrogradation process of starch pastes. The texture of the gels produced from the RVA was determined after 24 hr following the RVA test. The textural properties of the RVA gel are listed in the supplementary materials to this article.
Generally, the gel hardness for all flour mixtures was significantly (p < .05) lower than the gel from wheat control, where the results ranged from 149 ± 4.61 g for 20F2 to 215 ± 11.9 g for wheat flour control. These results are closely associated with starch retrogradation, which can be measured by the results of the FV from the RVA curve. The stronger gel generated by the flour mixture, expressed as a higher value of the RVA curve, the higher ability to gelatinise and retrograde the starch (Fernández-Peláez et al., 2021). After the gelatinisation process, starch molecules transition from amorphous state to form a more ordered and crystalline structure, forming a hard gel texture (Ribotta et al., 2007). After the heating process and subsequent starch damage, the starch tends to form different intermolecular interactions (Roman et al., 2017). Therefore, the inclusion of oat drink residue flour, which contained a lower level of starch as it was liquefied during the oat drink production process, diluted the percentage of amylose content in all different flour mixtures produced. The reduction in intramolecular interactions is due to the effect of heat and enzymatic treatment carried out in the oat drink manufacturing process. These findings are in agreement with other findings already stated earlier, such as the inclusion of wheat bran could interfere with the formation of a more ordered structure and reducing RVA gel hardness (Sozer et al., 2014).
The softer texture of gels made from oat drink residue flour blends could also be attributed to the presence of phosphorylated amylopectin found in oat starch. Oat starch with phosphorus contents of 0.15%–0.19% (by mass) (Hartunian-Sowa & White, 1992) accounted for the highest phosphorus content compared with other cereal starches (Gibiński et al., 1993; Paton, 1977). According to different studies, phosphorylation of starch has a negative relationship with gel hardness (Viksø-Nielsen et al., 2001; Wischmann et al., 2005). The presence of phosphate groups on the amylopectin molecules is responsible for weakening the gel-forming capacity of the starch (Wischmann et al., 2005). Consequently, the phosphorylated amylopectin residues presence in the oat drink residue flour blends could be contributing to the softer gel texture. These assumptions could be confirmed when taking into account the use of whole oat groats.
The gel chewiness was significantly (p < .05) reduced for all of the samples reduced compared with the gel obtained from wheat flour control, as the results ranged from 104.55 ± 4.23 for control to 72.89 ± 3.09 for 20F2. From the results, it could be highlighted that finer fractions had a higher impact on the gel elasticity. These findings were previously mentioned by Rashed et al. (2024) where coarser fractions of oat flour produced minimal structural changes compared with other finer fractions. Further details on the gel texture properties of wheat flour and various flour blends can be found in Table 2 in the supplementary materials.
Correlation analysis
A bivariate Pearson's correlation analysis revealed significant relationships between different dough properties (correlation matrix presented in Table 5). A negative relationship between specific surface area and pasting temperature, indicating an increased capacity of the flour blends to resist heating and shearing stress (Kumar & Khatkar, 2017). Thereby, taking into consideration the inclusion level, the particle size distribution of the flour incorporated into wheat flour has a significant role in determining the quality characteristics of the resultant bread (Rashed et al., 2024).
Correlation matrix of different flour properties and different dough properties.
 |
|
Correlation matrix of different flour properties and different dough properties.
|
|
Additionally, it was found that both mixing time and dough development time were negatively correlated with dough water absorption and all particle size distribution parameters measured except the specific surface area of the flour mixtures. This finding confirmed what was already stated before: that the inclusion of oat drink residue flour with high fibre content, particularly at lower particle size, could interfere with the formation of the starch–gluten matrix (Han et al., 2019) which is responsible for increasing both dough mixing time and dough development time. Additionally, the soluble and insoluble arabinoxylans present in the coarse bran fraction exceeded the effect of other different factors stated earlier (hydrogen bonds, presence of mixed-linked β-glucans) responsible for increasing water absorption of dough due to the incorporation of fine fractions of oat drink residue flour. These findings are in line with results those stated earlier that the existence of arabinoxylans is the most influential factor responsible for increasing the water absorption of the dough (Guo et al., 2018; Lovegrove et al., 2020).
The weakening of the protein network based on the mechanical work and the increasing temperature (represented as the C2 value) was positively correlated with water absorption (r2 = 0.89, p < .05). The incorporation of oat drink residue flour, rich in fibres and low in protein content, caused a dilution of gluten content, resulting in a reduction in the strength of the protein network formed. Conversely, it was negatively correlated with the specific surface area of the flour (r2 = −0.77, p < .05), indicating that the increase in particle size of the incorporated flour could improve the quality of the resultant bread as these particles did not interrupt the gluten network formation. These different associations between different instrumental measurements could open up new paths for investigating the possibility of modelling the sensory attributes of baked products through instrumental measurements.
The negative correlations between water absorption and RVA-gel characteristics such as hardness, gumminess, chewiness, and resilience indicate that the inclusion of fibres not only interrupts the ordered structure and produces softer gel but also reduces the elasticity of the gel produced. Water absorption was also negatively correlated with specific surface area (r2 = −0.82, p < .05) as a function of the flour used. The increase in water absorption was associated with the increase in fibre content, which had a lower specific surface area. Additionally, the hardness, gumminess, chewiness, and resilience of the RVA-gel were positively correlated with the flour-specific surface area (r2 = 0.82, 0.83, 0.83, and 0.90, p < .05, respectively). These findings support the idea that increasing water absorption in bread dough can have a negative impact on the foaming activity of different flour mixtures, leading to a reduction in the formation of gas networks. This, in turn, can result in a decrease in the final volume of the bread and an increase in loaf density. The excess water in the dough (due to the role of fibres in increasing water absorption) can result in the dough being wet and sticky, affecting its processing and overall quality (Parenti et al., 2021).
The texture profile characteristics of RVA gel results showed that there was a weak correlation between gel hardness and FV up to (0.019). Since higher FV indicates a stronger gel network, which correlates with increased hardness. As the previously presented results have shown, the decrease in FV is due to the increased fibre content. This can explain the reduction of the resultant gel hardness, as fibres were responsible for interfering the formation of a cohesive and stable starch gel network by disrupting the continuity of the gel structure as stated earlier in this article. Gumminess is a textural parameter that represents the energy required to disintegrate a semi-solid food to a state ready for swallowing, and it can be calculated as (Hardness × Cohesiveness), while Chewiness is a parameter that represents the energy required to chew a solid food to the point of swallowing, and it can be calculated as (Gumminess × Springiness). Since hardness is a critical component of both gumminess and chewiness, a higher gel hardness would likely lead to higher gumminess and chewiness values. Thus, as the results showed a positive correlation between hardness with both gumminess and chewiness (r2 = 0.997 and 0.993, p < .05, respectively) their behaviour with both of these attributes was the same towards FV. Similarly, both gumminess and chewiness were positively correlated with FV (0.067, 0.91, respectively). As chewiness depends on gumminess and springiness, and while viscosity affects these attributes, the influence is relatively minor.
PCA and cluster analysis results
The PCA was carried out to study the potential association between particle size and inclusion levels against (1) dough mixing properties, (2) RVA properties, and (3) gel texture properties aiming to identify key flour mixture measurements that can be used in bread preparation (Figure 2).
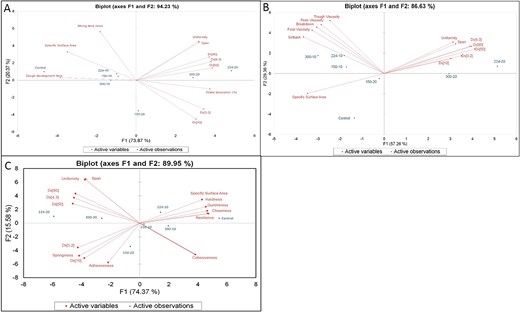
Principal component analysis (PCA) biplots (a) PCA for particle size distribution parameters vs dough-mixing properties, (b) PCA for particle size distribution parameters and Rapid Visco Analyser measurements, and (C) PCA for particle size distribution parameters and gel texture parameters.
The PCA component determined for the particle size distribution parameters and dough-mixing properties explained 94.23% (PC1: 73.87%, PC2: 20.37%) of the data variance (Figure 2A).
Similarly, the PCA for the particle size distribution parameters and RVA measurements variance explained was 86.63% (PC1:57.26%, PC2:29.36%) (Figure 2B). The results revealed that all RVA measurements were negatively correlated with all particle size distribution parameters measured for the flour mixtures. This finding confirmed some of the statements in the previous sections: that the inclusion of oat drink residue flour with high fibre content could reduce the available water required for starch granules for swelling (Boita et al., 2016). It was also highlighted previously that the increase in PV, FV, and SB was associated with the increased particle size of the flour fractions used (Rashed et al., 2024).
Finally, the PCA component for the particle size distribution parameters and gel texture parameters explained 89.95% variance (PC1: 74.37%, PC2: 15.58%; Figure 2C). Conversely, to that already mentioned in the two previously mentioned dough rheology properties, the specific surface area of the flour used was positively correlated with most gel texture measurements except adhesiveness, springiness, and cohesiveness. Also, gel cohesiveness was negatively correlated with the increase in particle size of the oat drink residue flour owing to the reduction in starch content, and the dilution in amylose content in different flour mixtures which reduced the intramolecular interactions and reduced gel hardness and cohesiveness.
Because of the complexity of the data produced from the dough rheology properties measured, further agglomerative hierarchical clustering (AHC) analysis was performed to identify the performance of these measures that can identify the properties of the flour mixtures (cite article that did this analysis in bread or similar). The AHC analysis is a classification method able to identify the dissimilarities between the objects that can be grouped together based on the nature of the data. It graphically illustrates the suitable number of classes into which the data can be grouped (Figure 3).
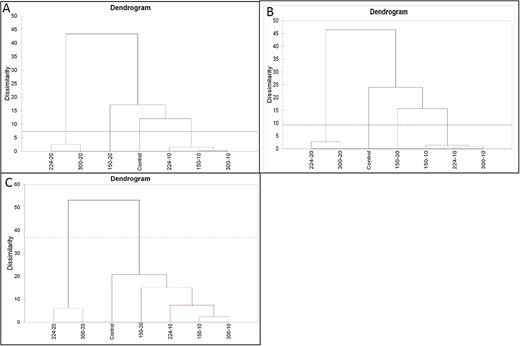
Dendrogram cluster analysis for dough rheology measurements (A) particle size distribution parameters and dough-mixing properties, (B) particle size distribution parameters and Rapid Visco Analyser measurements, and (C) particle size distribution parameters and gel texture measurements. The separation of the samples is more intense by the replacement fraction, additionally the Euclidean distances was enough to separate between different fractions.
Three cluster analyses were performed in this study, based on (1) the particle size distribution parameters and dough-mixing properties (Figure 3A), (2) the particle size distribution parameters and RVA measurements (Figure 3B), and (3) the particle size distribution parameters and gel texture measurements (Figure 3C).
Both dendrograms for dough-mixing properties and RVA parameters were able to identify four distinct groups and control sample separated in distinct cluster, which proved the efficacy of these measures to highlight the effect of the inclusion of the oat drink residue on the flour mixtures produced. Contrary to this, the dendrogram for gel texture parameters separated the samples only into two clusters, along with including the control in a cluster with samples containing a 20% inclusion level. In addition, both dendrograms for dough-mixing properties and RVA parameters separated samples with a 10% inclusion level into clearly separate group, which indicates that the particle size of oat drink residue flour does not make any significant difference at the 10% inclusion level, while the gel texture parameters dendrogram showed a less discriminating power.
Ranking of different alternatives via TOPSIS-Shannon entropy approach
The TOPSIS method was applied to find the best flour formulation that could be used for producing fibre-rich bread. In this context, alternatives and criteria were used for building the multi-criteria decision-making matrix. Span, uniformity, Dx [4, 3], Dx[10], Dx [50], Dx[90], mixing time, dough development time, C3,C4,C3–C2, and C5–C4 were assigned the positive criteria (higher values are preferable), while all other measurements were assigned the negative criteria (lower values are preferable), and the mean for all measurements was used.
Results of the instrumental dough quality characteristics indicated that the flour formulation containing 10F2 of oat drink residue flour, was the best among all the fibre-rich bread prototypes tested for bread formulation among the other alternatives in terms of measured dough properties, with a ranking of 0.80. As it was expected, control samples had the highest ranking (0.92), and the ranking points indicate that this is the ideal option. It could be concluded that the 10% inclusion level of F2 of oat drink residue flour has the potential to be used in bread formulation. Further bread structural characterisation is required to confirm the associations between dough rheology parameters and resultant bread quality characteristics.
Bread characteristics
Bread structural characterisation was performed to confirm the associations between dough rheology parameters and resultant bread quality characteristics. The results of bread measurements can be seen in Table 6. According to literature, specific volume is one of the key factors that determine the consumer acceptability of bread product as it is attributed to the higher crumb porosity, which in turn is correlated with bread freshness (Cauvain, 2016). Although loaf weight does not show significant differences (p < .05) between the control and the composite breads (data not shown), both loaf volume and specific volume of bread loaves showed reduction (p < .05) following the addition of oat drink residue flour fractions, specifically at higher inclusion levels. This reduction ranged from 2.21 ± 0.11 cm3/g (in 20F3) to 2.50 ± 0.05 cm3/g (in wheat control). This reduction can be attributed to the lower expansion capacity of the dough due to a weaker gluten network that forms a less elastic and resistant structure for the dough expansion (Rashed et al., 2024).
Bread characteristics made from wheat flour (100%) and oat drink residue flour at different levels of mixing ratios and particle sizes.
| Sample | Volume (cm3) | Specific Volume (cm3/g) | Density (g/cm3) | Hardness (g) | Springiness | Cohesiveness | Chewiness | Resilience |
|---|---|---|---|---|---|---|---|---|
| Control | 155.15 ± 0.06g | 2.50 ± 0.05bc | 400.46 ± 12.17a | 475.05 ± 4.52a | 0.87 ± 0.01a | 0.57 ± 0.06c | 517.81 ± 5.12a | 0.21 ± 0.03ab |
| 10F1 | 153.48 ± 0.04f | 2.37 ± 0.07b | 423.23 ± 9.35b | 786.34 ± 7.12b | 0.85 ± 0.0a | 0.56 ± 0.09abc | 659.45 ± 6.09c | 0.19 ± 0.08ab |
| 10F2 | 149.67 ± 0.10e | 2.36 ± 0.12b | 443.60 ± 11.91bc | 818 ± 5.23c | 0.85 ± 0.07a | 0.54 ± 0.01bc | 538.79 ± 10.11b | 0.19 ± 0.02ab |
| 10F3 | 145.15 ± 0.08d | 2.46 ± 0.03bc | 425.46 ± 7.18b | 1095.05 ± 10.12d | 0.85 ± 0.04a | 0.55 ± 0.03bc | 537.81 ± 7.40b | 0.19 ± 0.09ab |
| 20F1 | 134.36 ± 0.14b | 2.52 ± 0.14bc | 415.93 ± 5.62ab | 1135.87 ± 6.34e | 0.87 ± 0.0a | 0.54 ± 0.07ab | 538.84 ± 5.16b | 0.18 ± 0.14ab |
| 20F2 | 142.94 ± 0.12c | 2.44 ± 0.08b | 492.15 ± 14.26d | 1241.12 ± 8.16g | 0.85 ± 0.02a | 0.52 ± 0.04ab | 584.39 ± 3.28d | 0.15 ± 0.07a |
| 20F3 | 132.61 ± 0.03a | 2.21 ± 0.11a | 484.32 ± 31.05d | 1223.19 ± 5.19f | 0.82 ± 0.05a | 0.47 ± 0.03a | 572.47 ± 8.24cd | 0.16 ± 0.05a |
Note. Data are presented as M ± SD from triplicate analysis. Control = wheat flour control; F1 = dry fractionated oat drink residue flour > 150 μm; F2 = dry fractionated oat drink residue flour 150–224 μm; F3 = dry fractionated oat drink residue flour 224–300 μm.
Means denoted with different lowercase letters within a column are significantly different (p < .05), HSD Tukey’s test.
The TPA results revealed that the texture properties of the bread were significantly (p < .05) affected by the addition of oat drink residue flour fractions. Generally, the results showed an increase (p < .05) in bread hardness due to the inclusion of oat drink residue flour with greater particle size and higher inclusion levels of the fractions, ranging from 475.05 ± 4.52 g (in wheat control) in comparison to 1241.12 ± 8.16 g (in 20F2). This increase in crumb hardness is attributed to the dilution of the gluten network and increased dietary fibre content, which impair gas retention, resulting in a lower bread volume and a firmer texture (Majzoobi et al. 2014; Rashed et al., 2024).
Cohesiveness is another characteristic associated with the consumer’s chewing experience, and it is responsible for assessing the resistance (internal forces) of the breadcrumb. Cohesiveness significantly (p < .05) decreased for samples containing the higher levels of oat drink residue flour fractions included at different particle sizes. This reduction in crumb cohesiveness could be attributed to the reduction in the elasticity and cohesiveness properties of gluten protein in wheat flour. The addition of oat drink residue flour is responsible for disrupting the continuity of the gluten network, resulted in a less cohesive crumb (Majzoobi et al. 2014; Rashed et al., 2024). Additionally, according to Dürrenberger et al. (2001) increasing the dough density is responsible for increasing hardness and reducting the cohesiveness of the resultant bread crumb. Since highly aerated bread loaves are a result of the highly porous structure of the crumb, which can be reflected in increasing the values of springiness, cohesiveness, and resilience of the crumb while limiting its hardness (Dürrenberger et al., 2001; Rashed et al., 2024).
Model validation
The TOPSIS method was applied to rank bread samples from different formulations based on their instrumental quality measurements, similarly to what was previously mentioned in ranking flour formulations. In this context, alternatives and criteria were used for building the multi-criteria decision-making matrix. Volume (ml), specific volume (ml/g), springiness, cohesiveness, and resilience were assigned the positive criteria (higher values are preferable), while bread density (kg/m3), slice hardness (g), and chewiness measurements were assigned the negative criteria (lower values are preferable), and the mean for all measurements was used.
The final ranking of different flour formulations and bread samples was produced with the distances from the ideal (Si+) and negative (Si−) points obtained via the TOPSIS-Shannon entropy approach. Different flour formulations and the bread samples were ranked based on their performance index (Pi), which represented the best bread high in fibre formula with the lowest structural changes from the control (Table 7).
Ranking of different flour formulations and bread samples obtained by TOPSIS approach.
| Sample name | Dough measurements | Rank | Bread measurements | Rank | ||||
|---|---|---|---|---|---|---|---|---|
| Si+ | Si− | Pi | Si+ | Si− | Pi | |||
| Control | 0.0003 | 0.0035 | 0.92 | 1 | 7.6402E−06 | 16.7588 | 1.00 | 1 |
| 10F1 | 0.0012 | 0.0035 | 0.75 | 4 | 2.8813 | 5.8448 | 0.68 | 3 |
| 10F2 | 0.0009 | 0.0035 | 0.8 | 2 | 2.7728 | 6.1281 | 0.72 | 2 |
| 10F3 | 0.0014 | 0.0035 | 0.72 | 5 | 4.3026 | 4.1867 | 0.67 | 4 |
| 20F1 | 0.0011 | 0.0035 | 0.76 | 3 | 2.4452 | 6.4108 | 0.49 | 5 |
| 20F2 | 0.0028 | 0.0035 | 0.56 | 6 | 11.0472 | 0.6412 | 0.014 | 7 |
| 20F3 | 0.0027 | 0.0035 | 0.56 | 7 | 16.0242 | 0.2275 | 0.056 | 6 |
Note. Control = wheat flour; F1 = oat drink residue flour < 150 μm; F2 = oat drink residue flour 150–224 μm; F3 = oat drink residue flour 224–300 μm.
Results of the instrumental quality characterisation of bread samples produced out of the different flour formulations ranked bread samples very similar to the rank of flour formulations used in bread production. The correlation between the rank of bread-dough rheology measurements and the rank of bread samples based on their instrumental quality characteristics (Figure 4) indicated that there was almost 0.93, which indicated that bread baking quality characteristics could be predicted based on its bread-dough rheology measurements.
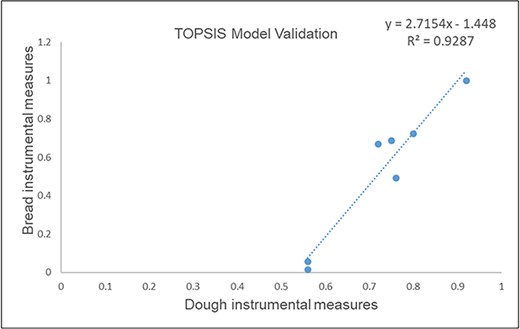
Correlation between the rank of bread-dough rheology measurements and the rank of bread samples based on their quality characteristics.
Conclusion
In the present work, a side stream of the oat drink production process was mechanically fractionated and incorporated into bread dough to study its potential to be used in formulating fibre-rich bread. Results revealed that RVA parameters seem to be the best estimator for dough quality characteristics in terms of estimating instrumental quality characteristics of resultant bread made of fibre-rich flour formulations. Additionally, the results highlighted that the effect of inclusion level outperformed the effect of particle size on changing the dough rheology characteristics and consequently the resultant bread. Additionally, the mechanical dry fractionation process has the potential to be used to modify the properties of oat drink residue, thereby increasing its range of applications for formulating a wide range of healthier products that meet consumer demand. Furthermore, the results indicated that the use of oat drink residue, particularly the 150–224 μm fraction, at a 10% inclusion level could have the potential to not only valorise the oat drink side stream but also produce a fibre-enhanced bread with a minimum change in bread structure quality to meet consumer demand for obtaining both nutritional and sensorial quality properties. The results obtained from this study establish the basis for the feature selection process, determining the most influential parameters that can be relied on for building a mathematical modelling approach that can predict not only the instrumental quality characterisation of bread but also the sensorial quality attributes from a consumer perspective. Further research on comprehensive mathematical modelling of the sensory properties of bread as affected by incorporating non-wheat flour through the use of instrumental measurements to ensure affirmative sensory properties of bread samples and eventually meet consumer preferences is being carried out as part of this project work. Also, a comprehensive life-cycle assessment of the oat drink production process can be re-performed in light of the use of this residue in bakery products.
Author contributions
Mahmoud Said Rashed (Investigation, Methodology, Formal analysis, Writing—original draft, Conceptualisation, Validation, Visualisation, Data curation, Software), Eimear Gallagher (Writing—review & editing, Supervision, Resources, Writing—original draft, Formal analysis, Data curation, Investigation), Jesus M. Frias (Formal analysis, Project administration, Data curation, Supervision, Writing—review & editing, Funding acquisition, Methodology), Milica Pojić (Writing—review & editing, Writing—original draft, Data curation, Formal analysis, Methodology, Supervision), and Shivani Pathania (Conceptualisation, Supervision, Resources, Project administration, Writing—review & editing, Funding acquisition, Formal analysis, Methodology, Data curation).
Funding
M.P. would like to acknowledge the financial support of the Ministry of Education, Science and Technological Development of the Republic of Serbia (Contract No. 451-03-66/2024-03/200222).
Conflicts of interest
The authors declare that they have no conflicts of interest to disclose. The authors confirm that this work is original and has not been published elsewhere, nor is it currently under consideration for publication elsewhere.
Acknowledgements
The authors wish to thank the Teagasc Walsh scholarship programme for funding this research. The authors are thankful to Oatier Ltd. for supplying oat drink residue for this work.
References
Cauvain, S. P. (2016). Bread and other bakery products. In D. Kilcast & P. Subramaniam (Eds.),
Shahidi, F., & Naczk, M. (2003). Phenolics in food and nutraceuticals. CRC Press, Boca Raton, FL.
Shetti, S. H. (2023). Rheological Properties of Wheat Flour when Mixed with Barley Flour. In
