


Abstract
Functionalities of proteins for the formulation of protein-fortified products are crucial, impacting the use of protein from sustainable sources such as algae. Glycation (the initial step of the Maillard browning reaction) is a standout modification technique explored to improve the functions of the protein in the food matrices. In this study, Chlorella powder was conjugated with inulin using a wet glycation method. It is a quick, scalable and easy method for improving the functionality of food proteins. In this study, conjugation was performed for three different Chlorella to inulin molar ratios (S1:1, S3:1 and S5:1). The solution of each molar ratio was heated at 90°C for 30 min under alkaline state (9.0 pH). Characterisation was conducted employing OPA assay, browning intensity and FTIR spectroscopy techniques. The results suggested glycation achieved the highest for the Chlorella-inulin ratio of 1:1. Glycation extent influenced the solubility of this conjugate significantly (P < 0.05) under an acidic medium. Other functional properties including hydration, moisture uptake, oil-binding and emulsifying activity were also significantly (P < 0.05) enhanced compared to unmodified Chlorella powder. Chlorella conjugate with molar ratio 1:1 also displayed higher antioxidant properties suggesting glycation's role in improving Chlorella powder free radical scavenging capabilities (1.25-fold increase) and reducing power (2.24-fold increase). The total scavenging activity and total reducing power of S1:1 were 2.526 × 10⁻³ and 1.872 × 10⁻³ mg mL−1 mg−1(Trolox Eq.), respectively. The results provide an understanding of different functionalities for glycated conjugates promising utilisation in the food and beverage industry.

Introduction
Algae-based food has experienced a recent spike in the market of sustainable plant-based, protein-fortified food products. According to the British Nutrition Foundation, global protein demands are as high as 202 million tons (Matos et al., 2022). Microalgae being high in protein content (~70% dry weight) (Van De Walle et al., 2023) has received increased consideration as a functional ingredient (Matos et al., 2022). Furthermore, protein quality is evaluated based on the essential amino acid (EAA) profile recommended by FAO (Consultation, 2011). Animal proteins dominate the EAA profile; however, microalgae constitute a well-balanced EAA profile (Van De Walle et al., 2023). Moreover, Chlorella is substantially high in antioxidants, polyphenols and carotenoid content compared to Spirulina (Ladjal-Ettoumi et al., 2024) preferring its use in food and nutraceuticals.
One of the limitations of using algae in food products is pigments which impart an undesirable strong green colour that reduces consumers' acceptability (Matos et al., 2022). Chlorophyll (a & b) are the most dominant pigments found in algae (up to 4% in Chlorella) (Shim et al., 2008; Paniagua-Michel, 2015) contributing to the overall green colour. Chlorella (algae) use in functionalised acidified beverages can be encouraged as chlorophyll degradation and colour loss are facilitated in low acidic pH, particularly below pH 5.0 (Koca et al., 2007). Furthermore, isoelectric points of algal (Chlorella) proteins are situated within the low acidic pH range, limiting protein solubility in acidic beverages (Ursu et al., 2014). Henceforth, modification strategies can be applied to improve the utilisation of Chlorella proteins in the food structuring strategies and beverage industry.
Forming glycoconjugates of food proteins is preferred for the enhancement of functional properties mainly for its practicality in the food industry. It is naturally occurring and favoured compared to other chemical modification methods as it does not involve excessive use of chemical reagents (de Oliveira et al., 2016).
Protein-saccharide conjugation is achieved via the Maillard reaction (also referred to as glycation), where condensation occurs between the amino group and carbonyl of saccharide moiety to produce an unstable Schiff's base (Spotti et al., 2013; de Oliveira et al., 2016; Kutzli et al., 2021). This quickly progresses to form other characteristic Maillard reaction compounds. Amadori compound, several intermediate and advanced glycation end-product detections often serve as an indication of glycation (Liu et al., 2012; Wei et al., 2018). The most common way to bring about glycation is heating in solution (wet glycation) or dry conditions (dry glycation). Several parameters, such as pH, protein-saccharide ratio, temperature and duration of the reaction, influence glycation and are widely reported (de Oliveira et al., 2016; Kutzli et al., 2021). Moreover, intermediate-stage glycation end-products are likely to have antibacterial and anticarcinogenic properties (de Oliveira et al., 2016).
Protein-polysaccharide conjugates, cited in literature, demonstrate improved techno-functional properties of proteins (de Oliveira et al., 2016). Emulsifying activity is greatly increased compared to protein-saccharide mixtures. Likewise, solubility, antioxidant, foaming, viscosity and gelling properties are reported to have been improved (Kutzli et al., 2021).
Inulin has improved multiple protein functionalities as reported in several studies (Mudannayake et al., 2015; Anderson-Dekkers et al., 2021). Inulin is a branched/linear fructan containing β-(2-1) d-fructosyl units attached to sucrose (fructose moiety). Due to β-d-fructosyl units, inulin is indigestible in the human gut. Inulin, in the later end of the colon, is assimilated by gut microflora rendering it an ideal prebiotic property (Shoaib et al., 2016). In food application, inulin acts as a fat and sucrose replacer, aiding in solubility, gelling and viscosity of food matrices (Flamm et al., 2001; Meyer & Blaauwhoed, 2009; Mensink et al., 2015; Shoaib et al., 2016; Wan et al., 2020; Anderson-Dekkers et al., 2021; Mudannayake et al., 2022). Ovalbumin-inulin conjugate displayed oxidative stability and emulsifying activity (Hu et al., 2020). Inulin attached to the whey protein significantly improved emulsifying activity in low pH (3.0–5.0 pH) and enhanced antioxidant activity as well (Wang et al., 2020b). When pea protein isolates were conjugated with inulin it improved solubility near the isoelectric point (4.0–5.0 pH) and greatly improved thermal stability, foaming, gelling and antioxidant activity (Jiang et al., 2022). Glycation of whey-protein isolate with short-chain inulin improved the digestibility of WPI and reduced allergenicity of β-lactoglobulin a dominant WPI protein accompanied by improvement in thermal stability and antioxidant activity (Tao et al., 2023). In another study, whey-inulin glycoconjugates displayed improved thermal stability (He & Vardhanabhuti, 2021).
Previously, Chlorella has been used in fermented beverages via a co-fermentation strategy with probiotic L. rhamnosus, L. fermentum (Csatlos et al., 2023) and L. brevis (Ścieszka et al., 2021). Another strategy has been alcoholic beverage functionalised with Chlorella and evaluation of the antioxidant physiological effect on an animal model (Dantas et al., 2021). Additionally, a blend of Chlorella power with brown rice flour has proposed enhancement in solubility and taste acceptance (Masayoshi & Akira, 2001). Algae-saccharide conjugation is a less studied domain. Recently, a study has employed glycation on the Spirulina-maltodextrin system (Zhang et al., 2023). The study reports increased solubility of protein around isoelectric point (~4.0 pH) at 6-h glycation time and improvement of emulsification ability (Zhang et al., 2023). The study employed extended glycation time to assess the optimal glycation duration. However, the study did not take into account the molar ratios of an algae-polysaccharide system. For this study, we hypothesised that conjugation of different molar ratios of Chlorella with inulin via glycation will improve functional properties that will benefit food development such as effective antioxidative encapsulants, emulsifiers and food fortification source. Moreover, Chlorella powder was used to enhance its native antioxidative properties. To achieve this, different combinations of Chlorella powder and Inulin were used to achieve glycation via the conventional wet glycation method. Furthermore, glycated samples were evaluated for antioxidant capacity, hydration, emulsification, solubility, moisture and oil-binding ability.
Materials and methods
Materials
Chlorella powder (66% protein concentration) was purchased from Naturiga Natural Foods, Istanbul, Türkiye. Inulin powder (Degree of polymerisation ~10) by Tito® was obtained from Smart Kimya, Izmir, Türkiye. Other chemicals utilised for characterisation and analysis were obtained from Sigma-Aldrich Chemical Co., Taufkirchen, Germany.
Methods
Preparation of Chlorella-inulin conjugates
The procedure was carried out following the wet glycation method of Ertugrul et al. (2021) with slight modifications. The modifications were as follows: (i) alkaline distilled water was used to maintain 9.0 pH to minimise use of excessive salts, (ii) high shear homogenization was not performed to avoid heat generation before water bath heating. Three Chlorella to inulin ratios 1:1, 3:1 and 5:1 (w/w) were used and referred to in the text as S1:1, S3:1 and S5:1. Different algae and inulin ratios were measured and mixed well in distilled water adjusted at 9.0 pH (using 0.5 M NaOH). The final volume of the ratios was maintained at 0.5 g mL−1 concentration for heating in the next step. Samples were heated at 90 °C for 30 min in a water bath (Witeg Labortechnik GmbH, Wertheim, Germany). The treated samples were cooled and homogenised in a blender and were kept at room temperature (25 °C) for further analysis. For control, the same procedure was followed in the absence of inulin. This sample is referred to as treated control in the rest of the text. Native Chlorella powder has been referred to as untreated control and algae-inulin mixes (w/w) are referred to as C1:1, C3:1 and C5:1 (Appendix S1). Chlorella powder used came from commercial sources. Batch-to-batch and commercial sourcing variations may impact the results.
Characterisation
Free amino groups
Free amino groups (FAGs) can be used as means for assessing glycation extent. Commonly ortho-phthalaldehyde (OPA) method is used. To perform, 5.0 mg mL−1 of conjugates, treated and untreated control Chlorella powders in distilled water. The procedure mentioned by Nielsen et al. (2001) was performed with slight modifications. First, the OPA reagent was prepared by dissolving 80 mg of ortho-phthalaldehyde in ethanol solution (2.0 mL, 95%). Next, 50 mL of borate buffer (0.1 M, pH 9.75), 200 μL of β-mercaptoethanol and 5 mL of 20% SDS (w/v) solutions were added to OPA/ethanol solution. Distilled water was then added to make the volume up to 100 mL. For the analysis, 0.5 mL sample solution of each glycated conjugate, treated and untreated control was added to 1.5 mL of o-phthalaldehyde (OPA) reagent. The absorbance values at 340 nm were measured, after 2 min of incubation in the dark, using a UV–Vis spectrophotometer (Optizen Pop Nano Bio, Mecasys Co., Ltd., Daejeon, Korea). Glycine solution was used to obtain a standard calibration curve from a concentration range of 0.005–0.075 (mg mL−1). Measurements were made in triplicates.
Browning index
Browning index or intensity is used to measure the progress of Maillard reaction. The method previously mentioned by Zia et al. (2021) was followed. Sample solutions (5.0 mg mL−1) were prepared in distilled water and centrifuged at 2469 g for 15 min. The supernatant of the samples was taken, and the absorbance values were measured at 420 nm using a UV–Vis spectrophotometer (Optizen Pop Nano Bio, Mecasys Co., Ltd.) to determine the browning degree. Measurements were made in triplicates.
Fourier transform infrared spectroscopy analysis
To measure structural changes of glycoconjugates, Fourier transform infrared (FTIR) was conducted. FTIR spectra of conjugates, treated and untreated control (Chlorella powder) samples were obtained by using an Attenuated Total Reflectance (ATR) attachment of an IR-Affinity-1 spectrophotometer (Shimadzu Sci. Ins., Kyoto, Japan). The following parameters were set for measurements. Spectral range (400–4000 cm−1), scans (10) and resolution (4 cm−1). Measurements were made in triplicates. Spectra were combined for analysis.
X-ray diffraction
To analyse the crystalline and amorphous state of conjugate powders, X-ray diffraction was carried out. XRD (STOE, Darmstadt, Kidlington, UK) was operated on the following parameters: voltage (40 kV), current (40 mA), step size (0.04) and scanning speed (0.5 s).
Scanning electron microscopy
To evaluate the surface morphology of the conjugates, Joel JSM 6490A SEM microscope was used. Samples were gold sputtered after securing the powder(s) using carbon tape on a steel stud before conducting scanning electron microscopy (SEM).
Functional properties
Solubility
The Lowry method was used to assess the solubility of the samples at different pH (2.0–5.0 pH) with slight modifications (Lowry et al., 1951). Conjugated and control powder solutions were prepared in 0.1 M phosphate buffer at different pH (adjusted using 0.5 M HCl and NaOH). All solutions were maintained at a 5 mg mL−1 concentration. Briefly describing the procedure, the Lowry reagent was prepared using 1 mL of (2%) CuSO4 (2%), and 1 mL of Na2C4H4O6 (2%) was added to Na2CO3 (2%) (dissolved in 0.1 N NaOH). Lowry reagent (2.5 mL) was added to 0.5 mL of sample solution. After 10 min of incubation, 0.5 mL of Folin reagent (1:1 dilution) was added and incubated for 30 min in the dark. Absorbance values were measured at 680 nm (Optizen Pop Nano Bio, Mecasys Co., Ltd.). Measurements were conducted in triplicates. Bovine serum albumin (BSA) was used to obtain a standard calibration curve for protein solubility within the concentration range of 0.03125–1.0 (mg mL−1).
Antioxidant capacity
Free radical scavenging activity
Antioxidant ability was assessed using the free radical scavenging activity of DPPH (2,2-diphenyl-1-picrylhydrazyl) following the method mentioned by Delgado-Andrade et al. (2005) with minor alterations. Extracts of conjugates treated and untreated controls were prepared using a combination of solvents as described by Maldonado et al. (2014) with minor changes. Acidified ethanol/water solvent was prepared with ethanol, acetic acid and distilled water, in a ratio of 50%:8%:42%, respectively. Samples (0.1 g) were dissolved in 1 mL of the solvent mix and vortexed for 10 min at 1000 rpm. Extracts were then centrifuged at 12 298 g for 10 min. The supernatant was used to conduct the assay. The supernatant (0.1 mL) was added to 3.9 mL of DPPH (0.0025%) methanolic solution and incubated for 60 min in the dark. Absorbance values were measured at 517 nm (Optizen Pop Nano Bio, Mecasys Co., Ltd.). Scavenging capacity was calculated using the formula:
The Trolox standard curve was used to express scavenging activity equivalent to Trolox concentration. The concentration used was between 0 and 0.250.29 mg mL−1 (0–1 mM) ethanolic solutions. Measurements were conducted in triplicates. Results were expressed as Trolox equivalent per protein content of the samples (mg mL−1mg−1).
Total reducing power
The reduction power of the conjugates was assessed using optimised Ferricyanide/Prussian Blue method (Işıl Berker et al., 2010). Conjugates and control extracts were prepared using the same solvent combination as in the DPPH assay procedure. The results were expressed as Trolox equivalent per protein content (mg mL−1mg−1). The Trolox standard curve was prepared using the same molar concentrations as in the DPPH assay. Measurements were conducted in duplicates.
Oil absorption capacity
The method for oil absorption capacity (OAC) previously mentioned by Aydemir & Yemenicioğlu (2013) was followed to evaluate the oil-holding ability of the powders. Conjugated samples, treated and untreated control (Chlorella) powder (50 mg) were added in tubes (2 mL, pre-weighed) followed by the addition of 1.5 mL sunflower oil. Tubes were vortexed (1 min), incubated in a water bath at 30°C (30 min) and centrifuged at 12 298 g (20 min). Oil (supernatant) was decanted, and tubes were weighed. Results were expressed as the weight of oil absorbed per protein content of the samples (mg ml mg−1). Measurements were conducted in triplicates.
Moisture uptake
Moisture uptake by the conjugated samples, treated and untreated controls was evaluated by the loss on drying standard method. Samples were kept in desiccators maintained at 75% RH (with saturated NaCl solution). For moisture content, the method followed by Ohgi et al. (2021) was used with slight modifications. Samples were weighed (pre-weighed Petri dishes), dried in a dry air oven (at 105 °C) and weighed again the following day. Measurement was taken in triplicates on the 0th and 4th day. The results were expressed as moisture lost per protein content in percentage (%).
Emulsifying activity index and emulsifying stability index
The method described by Zhang et al. (2021) was followed to measure EAI and ESI of the conjugated, treated and untreated control samples. 20% oil (sunflower) to 80% sample solution (1%, w/v) were subjected to a high-shear mixer (IKA®-Werke GmbH & Co. KG, Staufen, Germany). The emulsions were diluted by a factor of 20 using 1% SDS (w/v) and absorbance was read at 550 nm via UV–Vis spectrophotometer (Optizen Pop Nano Bio, Mecasys Co., Ltd.). Measurements were made in triplicates. The following formula was used to calculate the EAI.
For the ESI, the same emulsion preparation and measurement criteria were used as mentioned above. Absorbances were read at 0th and 10th min intervals. The following formula was used to calculate the ESI. Measurements were made in triplicates.
where A0 = Absorbance at 0th min of homogenisation, N = Factor of dilution, = oil fraction in emulsion (mL), C = Conc. of protein solution(g mL−1), A10 = Absorbance at 10th min of homogenisation.
Time domain-nuclear magnetic resonance relaxometry
Spin–spin relaxation times (T2) were recorded using a Carr–Purcell–Meiboom–Gill (CPMG) pulse sequence on a 0.32 T (20.34 MHz) time domain-nuclear magnetic resonance (TD-NMR) instrument (Spin Track GmbH, Kirchheim/Teck, Germany). In the analysis, the repetition delay (TR) was set to 4 s and the number of scans was set at 16. For the hydration experiment, the echo time was 1000 μs and the number of echoes ranged from 100 to 800. For the emulsion case, the echo time of 3000 μs and the number of echoes within the range 2000–3000 were used. The data were plotted in MATLAB (The MathWorks Inc., Natick, MA, USA) by considering a mono-exponential behaviour.
TD-NMR for emulsions
Emulsions evaluated for the TD-NMR experiment were prepared as in the EAI method. Emulsions were decanted in NMR glass tubes (5 mm diameter), and T2 measurements were recorded within 30 min of emulsion preparation. The procedure is an adaptation of the previously mentioned protocol described by Kirtil & Oztop (2016). Measurements were taken in duplicates.
TD-NMR for hydration
The hydration behaviour of Chlorella conjugates and controls was assessed by TD-NMR experiment of the procedure mentioned by Tas et al. (2022) with slight modification. Chlorella conjugates (300 mg) and untreated control mixes (300 mg) were hydrated with 400 μL distilled water. T2 values were recorded at several intervals over a period of 240 min (4 h). Measurements were taken in duplicates.
Statistical analysis
Statistical analysis was performed on Minitab statistical software (Version 19.0; Minitab Inc., Coventry, UK). One-way analysis of variance (ANOVA) was used to compare the glycoconjugates with different molar ratios and treated and untreated controls. Tukey's comparison (t-test) was used for significance estimation, and significance interval was set at 95%. Where two groups were compared, paired t-test was employed at a 95% confidence interval.
Results and discussion
Glycation extent of chlorella-inulin conjugates
The extent of glycation of conjugates can be measured by the reduction of free amino groups (FAGs). Reduction in free amino groups indicates glycation as reducing sugar's carbonyl groups covalently attach to free amino groups leading to the formation of Schiff's base (Spotti et al., 2013). OPA assay serves as an indirect method to measure the extent of glycation by quantifying primary amino acids (Sun et al., 2006; de Oliveira et al., 2016) via comparison of samples with control. As depicted in Table 1, Chlorella-inulin conjugates S1:1 and S3:1 have shown a significant (P < 0.05) decrease in free amino groups compared to the treated control. FAGs with 0.119 (mg mg−1) and 0.060 (mg mg−1) of S1:1 and S3:1, respectively, hence, demonstrate the involvement of amino groups in glycation. Conjugate S5:1 indicated an insignificant (P > 0.05) decrease in FAGs compared to the treated control. Possibly, due to a lower substrate-to-protein ratio of S5:1, the inulin amount was insufficient to react to abundant free amino groups. The higher initial concentration of protein reactant limited the progress and completion of Maillard reaction as stated in a kinetic study on glutamic acid-glucose system (Zhang et al., 2020). Similarly, a higher sugar substrate ratio to protein leads to later-stage rearrangement of Amadori products (Yu et al., 2020). Moreover, in the glycation system, protein is influenced by heating, leading to a crowding effect of amino groups rendering inaccessibility for the Maillard reaction to take place, as suggested by Li et al. (2015), Pirestani et al. (2017) and Tas et al. (2022).
Free amino groups (FAGs) and browning intensity at A420
| Samples | Free amino groups (mg mg−1) | Browning intensity (Abs420) |
|---|---|---|
| S1:1 | 0.119 ± 0.0005c | 0.59 ± 0.0410a |
| S3:1 | 0.060 ± 0.0004b | 0.47 ± 0.00354b |
| S5:1 | 0.212 ± 0.0009a | 0.43 ± 0.00778b |
| Treated control | 0.199 ± 0.0004a | 0.46 ± 0.0262b |
| Samples | Free amino groups (mg mg−1) | Browning intensity (Abs420) |
|---|---|---|
| S1:1 | 0.119 ± 0.0005c | 0.59 ± 0.0410a |
| S3:1 | 0.060 ± 0.0004b | 0.47 ± 0.00354b |
| S5:1 | 0.212 ± 0.0009a | 0.43 ± 0.00778b |
| Treated control | 0.199 ± 0.0004a | 0.46 ± 0.0262b |
Alphabets that are shared indicate insignificant differences in the means of the group (P > 0.05). S1:1, 3:1 and 5:1 represent molar ratios of glycated samples. Treated control is heated chlorella devoid of substrate (inulin).
Browning index
Maillard reaction incurs a brown colour in the glycated conjugates due to the formation of several advanced glycation end products and melanoidins (Sun et al., 2011). The browning effect measured via increased absorbance at 420 nm is a quick and simple method to assess glycation events in samples (de Oliveira et al., 2016). As illustrated in Table 1, conjugate S1:1 demonstrates a significant (P < 0.05) high browning intensity consistent with free amino group results for a conjugate S1:1 significant decrease in FAGs (Table 1). Whereas S3:1 and S5:1 glycoconjugates did not demonstrate significant (P > 0.05) browning compared to the treated control. The molar ratio of reactants influences the extent of the Maillard reaction (Martinez-Alvarenga et al., 2014). Usually with the increase of substrate the browning intensity is increased. Various molar ratio was combined for soy protein hydrolysates to dextran including 2:1 and 1:2, where 2:1 showed the least browning effect while 1:1 demonstrated a considerably higher browning (Zhang et al., 2019). This is consistent with a higher protein ratio to substrate in our samples. Moreover, this trend in our samples could also be attributed to polyphenols present in Chlorella powder retendering α-dicarbonyl trapping limiting the progression of the Maillard reaction towards later stages (Lund & Ray, 2017).
Fourier transform infrared spectroscopy
Usually, for glycation, amide zone I (C=O, 1700–1600 cm−1), II (N–H, 1550–1450 cm−1), III (C–N, 1450–1200 cm−1), C–H and –OH stretches (3300–3200 cm−1) are examined for intensity and peak shifts due to Maillard reaction products such as pyrazine (C–N), Schiff base (C=N) and amadori compounds (C=O) (Boostani et al., 2017; Jiang et al., 2022). In FTIR spectra shown in Fig. 1, the amide zone depicts reduced absorbance intensity with a slight shift of peaks for all the samples compared to untreated control. Reduced absorbance intensity is indicative of amide groups' involvement in glycation (Chen et al., 2019). Moreover, the Chlorella-inulin conjugate S1:1 shows the lowest absorbance intensity in this region corresponding to glycation extent and browning intensity results. Furthermore, in amide region I, the absorption band at 1631 cm−1 in untreated Chlorella has shifted to 1625, 1642 and 1625 cm−1 for conjugates S5:1, S3:1 and S1:1, respectively have been ascribed to Schiff base due to glycation (Boostani et al., 2017). Furthermore, C–H and –OH stretches are wider and absorbance intensities are higher, this is attributed to the Maillard reaction and multiple intermediates that are formed during the reaction (Jiang et al., 2022; Wang et al., 2022). Additionally, absorbance intensity is high around 1020–1030 cm−1 for Chlorella-inulin conjugates accompanied by a peak shift from 1030 cm−1 (untreated control) to 1024 cm−1 for all conjugates. This is indicative of new (C–N) bonds (Wang et al., 2022) and was observed previously with WPI-Inulin conjugation (Wang et al., 2020b). Furthermore, FTIR spectral changes between glycated conjugates and control were found to be consistent with FAGs and browning intensity results.

FTIR spectra changes of Chlorella-inulin conjugates and controls. Spectra show changes at the amide zone (~1600–1400 cm−1) and −OH and CH stretches (~3500–3000 cm−1). S1:1, 3:1 and 5:1 represent molar ratios of glycated samples. Chlorella (Treated) is heated with Chlorella minus the inulin (substrate).
X-Ray diffraction
The crystalline or amorphous phase of the conjugates was assessed by examining the XRD spectrum (Fig. 7). Both controls (untreated and treated) show a characteristic amorphous state, having two diffused diffraction peaks at ~10o (α-helix) and ~19o (β-sheets) (Karabulut & Feng, 2024). α-helix distribution has changed for S1:1 and S3:1 as the magnitude of the shoulder peak at 10o is reduced and smoothly transitions to a more diffused broader peak around 19o associated with a flexible and disordered structure (Chen et al., 2021). This was observed in glycoconjugates previously reported (Chen et al., 2021; Karabulut & Feng, 2024; Parandi et al., 2024). This observation is attributed to the interaction of saccharides with protein sources resulting in disruption and mobility of the α-helix chain (Karabulut & Feng, 2024). However, the glycoconjugate S5:1 XRD spectrum remains unchanged compared to controls indicating lower glycation event, which is consistent with FAGS results. Since, incorporation of hydrophilic group can influence solubility (de Oliveira et al., 2016) as depicted in solubility results S1:1 and S3:1 was comparatively more soluble as discussed later.
Scanning electron microscopy
To examine the surface morphology of the conjugates scanning electron micrographs at ×1000 were analysed (Fig. 8). Untreated control demonstrates a smooth rounded bolus-like surface morphology compared to treated control which demonstrates a looser structure with more visibly shallow crevices. Conjugates S1:1, S3:1 and S5:1 depict more clumps and aggregation. This is similar to other studies indicating porous structure upon glycation (Zhong et al., 2019; Karabulut & Feng, 2024) associated with hydrophobic regions being exposed (Ji et al., 2017). Conjugate S1:1 displays deeper crevices/fine capillary space in powder matrices compared to S3:1, possibly due to interaction with inulin. Fine capillary spaces and loose flattened surface of S1:1 can be associated with interaction with saccharides providing steric hindrance to self-aggregation during heating (de Jongh, 2007). Moreover, inulin moiety can facilitate oil-binding (Mudannayake et al., 2015). This was also observed in OAC and hydration ability results, S1:1 showing enhanced oil-binding and reduced hydration behaviour. Conjugate S5:1 demonstrates larger aggregates and wider spaces owing to low glycation extent contributing to less steric hindrance and more clustering (de Jongh, 2007). This can facilitate faster penetration of water also depicted in hydration analysis.
Functional properties
Solubility
The solubility of protein content was assessed at different pHs by the Lowry method (Fig. 2). Heat-treated Chlorella demonstrated considerably lower solubility compared to the other samples possibly, due to the denaturation effect of heating. Nevertheless, glycation may have prevented aggregation of Chlorella-Inulin conjugates around an acidic medium, increased solubility and shift of isoelectric point (de Oliveira et al., 2016). Conjugate S1:1 solubility was significantly (P < 0.05) higher than untreated control (Chlorella). Similar increases in solubility were also reported previously with a 1:1 molar ratio of conjugates (Qi et al., 2010; Zhang et al., 2012; Xue et al., 2013). Untreated control showed the lowest solubility around pH three, an isoelectric point as reported previously (Hadjoudja et al., 2010). Two conjugates S1:1 and S3:1 demonstrated higher solubility near the isoelectric point of Chlorella powder pH3.0 and conjugate S1:1 showed significantly (P < 0.05) higher solubility at pH2.0 compared to the rest of the conjugates. However, the solubility of glycoconjugates S3:1 and S5:1 shows considerably lower solubility upon comparison with conjugate S1:1 (P < 0.05). With the increasing molar ratio of Chlorella, there has been an observable decrease in solubility. Molecular crowding may have influenced solubility as stated earlier by Tas et al. (2022) and Wen et al. (2020). Moreover, the heating step during glycation can also enhance the molecular crowding effect which would cause a lower solubility (Tas et al., 2022).
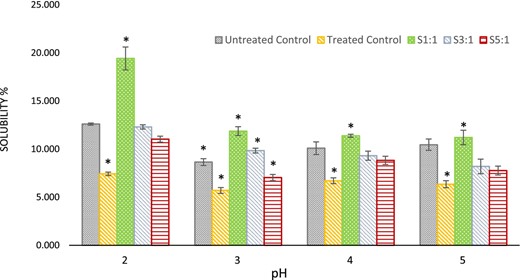
Changes in solubility (%) of samples and controls in different pH values. S1:1, 3:1 and 5:1 represent molar ratios of glycated samples. Treated control is heated Chlorella without the inulin (substrate). Untreated control here is native Chlorella powder. Asterisks (*) indicate significant differences only (P < 0.05).
Antioxidant capacity
Chlorella powder demonstrates good antioxidant activity (Machu et al., 2014; Rahimnejad et al., 2017). This is attributable to high flavonoids and phenolic acid compounds (Ferdous & Balia Yusof, 2021). To determine whether treated samples would demonstrate antioxidant activity, the free radical scavenging activity was assessed using the DPPH method to compare with untreated control. As shown in Fig. 3, the Chlorella-inulin conjugate S1:1 depicts the highest antioxidant activity (Trolox Eq. 0.002526 mg mL−1mg−1) (P < 0.05). The heat-treated control demonstrates the lowest antioxidant activity (P < 0.05) as heat can degrade phenolic compounds responsible for radical scavenging activity (Ghafoor et al., 2019). However, the S1:1 conjugated sample demonstrates the highest antioxidant activity (P < 0.05) possibly due to the presence of intermediate-stage compounds during the Maillard reaction (Tas et al., 2021). The results correspond with the browning intensity results for the S1:1 conjugate.
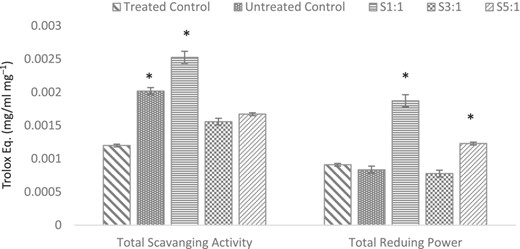
Antioxidant capacity of samples and controls expressed as Trolox Eq. S1:1, 3:1 and 5:1 represent molar ratios of glycated samples. Treated control is heated chlorella without the presence of inulin (substrate). Asterisks (*) indicate significant differences only (P < 0.05).
The total reducing power of the conjugates was also evaluated using the Prussian blue method. Conjugate S1:1 displayed 2.24-fold increase in reducing power (Trolox Eq. 0.001872 mg mL−1mg−1) (P < 0.05) compared to untreated control, followed by S5:1 and S3:1. These results can be ascribed to the formation of reductones as intermediated stage Maillard reaction product, facilitated by alkaline conditions (de Oliveira et al., 2016; Feng et al., 2022). The reducing power of S1:1 is consistent with browning intensity results.
Oil absorption capacity
The oil absorption of proteins can be influenced by heat treatment which modifies globular proteins' tertiary structures, exposing more hydrophobic regions that may increase oil/fat-holding ability (Wang et al., 2019). Moreover, inulin is considered a fat replacer due to its oil-holding capacity (Mudannayake et al., 2015). Glycation may have enhanced the oil-holding capacity of the glycoconjugates. The OAC of the S1:1 conjugate was improved (P < 0.05) compared to the treated and untreated control (shown in Table 2). This is suggestive that the degree of glycation has enhanced oil holding capacity. The results are similar to studies previously reported on soy protein and maltose systems (Xu & Zhao, 2019; Wang et al., 2020b). Inulin oil holding capacity was also taken into consideration which demonstrated significantly lower OAC (P < 0.05) compared to treated and untreated control samples. Conjugate S1:1 higher oil-binding can also be attributed to surface morphology which depicts hydrophobic regions and interaction of fat-binding inulin moiety as discussed earlier.
Oil absorption activity (OAC) of samples expressed as mg mg−1
| Samples | OAC (mg mg−1) |
|---|---|
| S1:1 | 2.39 ± 0.201a |
| S3:1 | 1.67 ± 0.083b |
| S5:1 | 1.26 ± 0.099c |
| Treated control | 1.55 ± 0.089b,c |
| Untreated control | 1.73 ± 0.128b |
| Inulin | 0.88 ± 0.061d |
| Samples | OAC (mg mg−1) |
|---|---|
| S1:1 | 2.39 ± 0.201a |
| S3:1 | 1.67 ± 0.083b |
| S5:1 | 1.26 ± 0.099c |
| Treated control | 1.55 ± 0.089b,c |
| Untreated control | 1.73 ± 0.128b |
| Inulin | 0.88 ± 0.061d |
Controls: untreated control (native Chlorella), treated control (heated devoid of the substrate) and Inulin powder. S1:1, 3:1 and 5:1 represent molar ratios of glycated samples. Alphabets that are shared indicate an insignificant difference in the means of the group (P > 0.05).
Emulsifying activity
Emulsifying activity index and emulsifying stability index
Protein exhibits emulsifying activity by forming inter-facial layers at oil–water interfaces adsorbing around oil droplets (Kuan et al., 2011; Tu et al., 2015). Protein modification, particularly glycation can enhance the emulsification process by improving the hydrophobic/hydrophilic balance, contributing to better adsorption in the oil–water interface (Wang et al., 2021). Such improvements have been reported previously in soy protein isolate conjugated with maltose exhibiting better emulsification properties compared to non-glycated samples (Xu & Zhao, 2019).
The emulsifying activity index (EAI) of Chlorella-inulin conjugates was carried out to compare with the treated and untreated controls. The experiments were carried out in three different pH ranges – 3.0, 4.0 and 5.0. It was observed that with the increase in pH value, the emulsifying properties improved across all sample ratios and controls (shown in Fig. 4a). Chlorella-inulin conjugate S1:1 at pH 3.0 displayed significantly higher emulsifying activity (P < 0.05) compared to other glycated conjugates and controls. This can be attributed to the high glycation extent of S1:1 conjugate contributing to better emulsifying ability at low pH. Moreover, better solubility of S1:1 conjugate may have influenced emulsifying behaviour, as the solubility of proteins plays a critical role in emulsification properties (Jiang et al., 2022). The emulsifying stability index (ESI) was also estimated. The stability of the Chlorella-Inulin S1:1 at pH 3.0 and pH 5.0 was significantly higher (P < 0.05) than the rest of the conjugates and controls (shown in Fig. 4b). The role of polysaccharides in emulsification activity and stability of conjugates have been reported previously within the protein-polysaccharide system (Wang et al., 2020a; Jiang et al., 2022). Furthermore, Bovine Serum Albumin-conjugated with glucose demonstrated lower emulsification stability indicating unstable film at the emulsion interface (Rangsansarid et al., 2008), as was observed in S3:1 and S5:1.
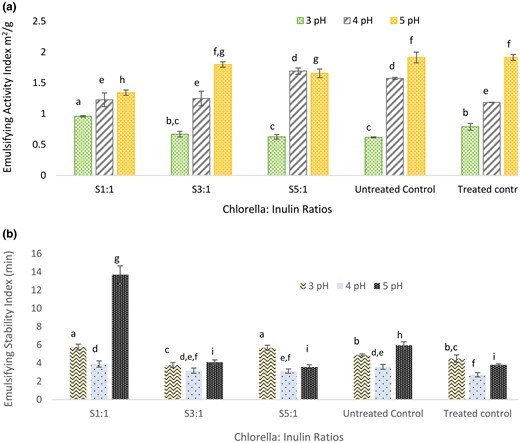
(a) Emulsifying activity index (EAI) of glycated conjugates (S1:1, S3:1 and S5:1) and treated (heat treated minus the substrate) and untreated (native chlorella powder) controls across pH range 3.0–5.0. (b) Emulsifying stability (ES) of glycated conjugates and treated and untreated controls across pH range 3.0–5.0. Alphabets shared indicate insignificant differences upon means comparison (P < 0.05).
Emulsifying activity via TD-NMR relaxometry
Emulsifying activity was also determined via T2 measurements using TD-NMR relaxometry. In emulsions, water mobility is restricted mainly due to the entrapment of water in the oil phase. Therefore, T2 measurements decrease with increasing emulsifying activity (Kirtil & Oztop, 2016). Comparison of T2 values can be suggestive of emulsification activity across samples (shown in Table 3). The T2 measured for samples and the controls was considerably high ranging between 930 and 1821 ms, this was expected as the emulsion prepared for the study was 80% water, hence, higher T2 values (Akkaya et al., 2021). The pH 3.0 facilitates better emulsifying ability, as T2 noticeably decreased compared to non-glycated (untreated) Chlorella-inulin mixtures across all molar ratios (P < 0.05). This is indicative of glycation contribution to a better emulsifying ability of Chlorella-inulin conjugates. Spin–spin relaxation time transitioned for glycoconjugate S1:1 from 930.75 ± 0 to 1432 ± 35.3 and 1118.68 ± 35.7 and the decrease in T2 (in %) when compared to control was 35, 3.8 and 47.7% at 3.0, 4.0 and 5.0 pH, respectively, implying better emulsion stability with increasing pH. A higher percentage difference in relaxation times in comparison to the control suggests physicochemical interactions in the interfacial layer (Akkaya et al., 2021).
Spin–spin relaxation time (T2) of emulsions in milliseconds for samples and control across different pH
| Samples | T2 (ms) 3.0 pH | T2 (ms) 4.0 pH | T2 (ms) 5.0 pH |
|---|---|---|---|
| S1:1 | 930.75 ± 0j | 1432.00 ± 35.3g | 1118.68 ± 35.7d |
| S3:1 | 990.12 ± 9.4j | 1278.88 ± 7.15h | 993.22 ± 42.2e |
| S5:1 | 946.245 ± 7.1j | 1188.4 ± 46.8h | 964.04 ± 36.2e |
| C1:1 | 1326.51 ± 40.8i | 1488.29 ± 2.67g | 1821.095 ± 6.5a |
| C3:1 | 1301.80 ± 20.2i | 1684.2 ± 45f | 1349.8 ± 8.3b |
| C5:1 | 1346.37 ± 46.6i | 1666.8 ± 37.1f | 1519.74 ± 25.8c |
Alphabets that are shared indicate insignificant differences (P < 0.05). S1:1, 3:1 and 5:1 represent molar ratios of glycated samples. C1:1, 3:1 and 5:1 represent molar ratios mixes without heating.
Moisture uptake
The addition of hydrophilic groups to protein can drastically increase the water retention ability (Boostani et al., 2017). Enhanced water binding has been observed in different protein isolate and saccharide conjugate systems (Chiu et al., 2009). Changes in moisture absorption were evaluated after keeping the samples at 75% RH. Conjugate S1:1 demonstrated the highest, 45% (P < 0.05) moisture-holding ability compared to before and after being kept at 75% RH followed by Chlorella-inulin conjugates S3:1 and S5:1 (shown in Fig. 5). This trend indicates the effect of inulin that can increase the moisture-holding ability. Several studies have observed similar results for glycoconjugates with a 1:1 molar ratio (Chiu et al., 2009; Matemu et al., 2009; Xu & Zhao, 2019; Wang et al., 2020b). This property is particularly useful in preventing water losses within food matrices (Boostani et al., 2017).
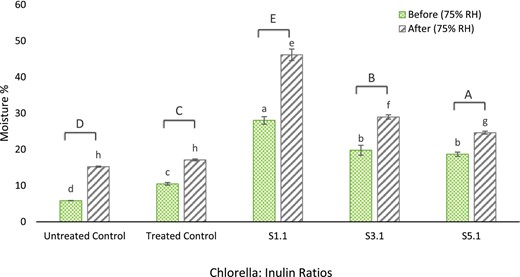
Change in moisture content (%) for samples and controls before and after placement in 75% relative humidity (RH). Lowercase alphabets that are shared indicate insignificant differences (P < 0.05) upon means comparison within the group. Uppercase alphabets indicate significant differences (P < 0.05) upon paired t-tests before and after 75% RH incubation.
Hydration via TD-NMR relaxometry
Hydration is a biphasic process involving diffusion followed by the stabilisation/equilibrium phase (Montanuci et al., 2015). Initially, the water molecules have high mobility within the system, and gradually, as the hydration progresses, the water becomes bound to the matrix (Tas et al., 2022). The change in mobility can be detected with T2 values. When water mobility is present, the T2 values are expected to be longer, and decreasing water mobility will result in shorter T2 values (Ohgi et al., 2021). Chlorella-inulin conjugates' hydration capacity was determined via T2 values (ms) which were measured periodically over a duration of 240 min. When plotted, the T2 values exhibited biphasic trends (as shown in Fig. 6) also observed by Machado et al. (1999). Each molar ratio of the conjugates and the untreated control mixes entered the relaxation phase at a different rate. Hence, the bend in the individual curves was determined by the first and second derivative, these data points for bend were considered as time (min) after which the curves transitioned into the relaxation phase. Conjugate S1:1 and S3:1 demonstrated relaxation at 30 min, conjugate S5:1 and its untreated control mix (C5:1) at 20 min, while untreated control mixes C1:1 and C3:1 entered stabilisation within 10 min. The initial diffusion phase in hydration curves exhibits linearity (Montanuci et al., 2015), therefore, the T2 values spanning the diffusion phase were fitted into a linear model. The S1:1 conjugate demonstrated the steepest fall in T2 values (slope = −1.085, P < 0.05), shown in Table 3, followed by the S3:1 conjugate (slope = −0.538, P < 0.05). The relaxation phase demonstrated a subtle change in T2 values indicating stabilisation in the hydration process until the 240th minute. Similar two phasic trends of hydration behaviour were also observed previously (Machado et al., 1999; Sayar et al., 2001; Prasad et al., 2010; Montanuci et al., 2015). Moreover, the T2 values at the start of the experiment were significantly short for all untreated Chlorella-inulin mixes compared to the glycoconjugates (shown in Table 4) indicating less water mobility (Ohgi et al., 2021) and therefore, quicker transition into the secondary phase. The water adsorption process involves permeability through capillary spaces in the powder/water interfaces and structural matrix (Johnny et al., 2015; Ji et al., 2017). For glycoconjugates, the structural morphology might have been altered by heating during the Maillard reaction. Henceforth, contributes to more hydrophobicity and denser structure, limiting the lateral distribution of water and slower transit into the secondary phase (Ji et al., 2017). The hydration behaviour is consistent with surface morphology of the conjugates as described earlier.
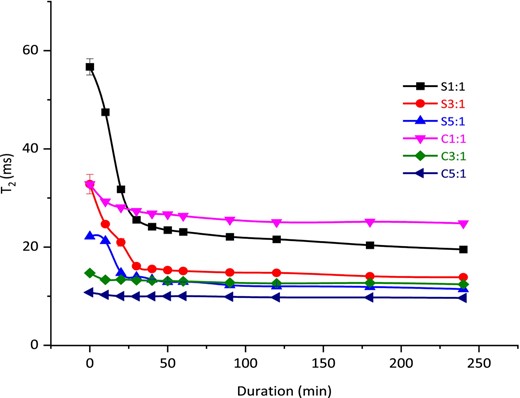
T2 relaxation time vs duration of hydration indicating hydration behaviour of treated samples (S1:1, S3:1 and S5:1) and untreated control mixes (C1:1, C3:1 and C5:1). A bi-phasic trend, the diffusion and relaxation phases are shown in accordance with the conjugate S1:1 curve bend point.
Linear regression fitting of hydration curve obtained for Chlorella-Inulin conjugates and control mixes
| Linear regression fitting (T2 = −bX + a) | |||
|---|---|---|---|
| Sample | Slope ‘b’* | Intercept ‘a’ | R2 |
| S1:1 | −1.085 ± 0.050d | 56.746 ± 1.277a | 0.974 ± 0.004 |
| C1:1 | −0.354 ± 0.050b | 32.811 ± 0.520b | 1.000 ± 0.000 |
| S3:1 | −0.538 ± 0.051c | 31.727 ± 1.491b | 0.969 ± 0.021 |
| C3:1 | −0.136 ± 0.013a | 14.716 ± 0.137c | 1.000 ± 0.000 |
| S5:1 | −0.372 ± 0.009b | 23.118 ± 0.253d | 0.842 ± 0.016 |
| C5:1 | −0.037 ± 0.001a | 10.738 ± 0.002e | 0.975 ± 0.005 |
S1:1, 3:1 and 5:1 represent molar ratios of glycated samples. C1:1, 3:1 and 5:1 represent molar ratios mixes without heating. Lowercase alphabets that are shared indicate insignificant differences upon comparison within the group (P < 0.05).
*Data points for regression fitting and slope were determined graphically from the first and second derivatives.
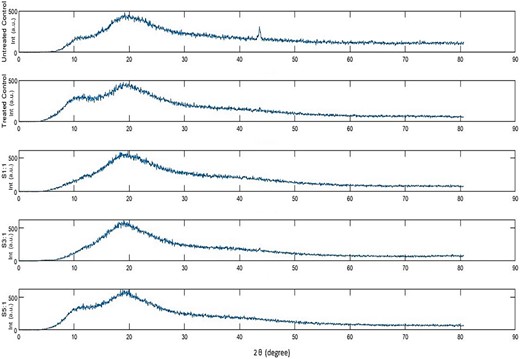
X-ray diffraction peaks for the conjugates with different molar ratios S1:1, S3:1, S5:1 and controls. Treated control is native Chlorella subjected to heating conditions. Untreated control represents native Chlorella.
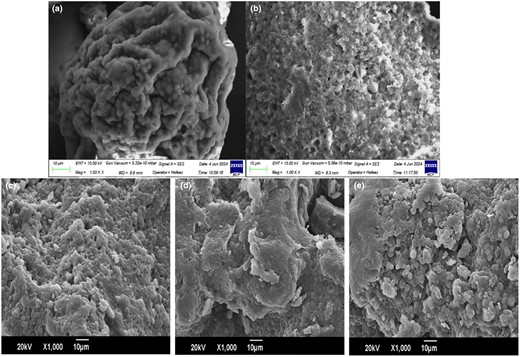
SEM images at 1000×. (a) Untreated control (Chlorella), (b) treated control (heated), (c) Conjugate S1:1, (d) Conjugate S3:1 and (e) Conjugate S5:1.
Conclusion
This present study reports an improvement in the functional properties of Chlorella powder via conjugation with inulin. It was proposed that Chlorella powder conjugated with inulin will contribute to improved functional properties. Different ratios (1:1, 3:1 and 5:1) of Chlorella to inulin were used to assess the impact on glycation extent and impact on the techno-functional properties. Significant improvement was observed for solubility in conjugated samples in an acidic medium, creating isoelectric point shift, particularly in glycated conjugate ratio S1:1 and S3:1. Improvement of solubility impacted other functional properties such that hydration behaviour and moisture analysis were significantly enhanced in Chlorella-inulin conjugates. Similarly, emulsification and oil-binding were also augmented. Moreover, the glycation process also contributed to antioxidant activity in the glycated conjugate S1:1. Overall, the findings obtained will contribute to Chlorella-inulin conjugates' employment in the food industry, particularly in protein-fortified products. Moreover, functional properties were more pronounced in acidic medium, promising its utility in acidified beverages. Further studies need to be conducted to better understand the performance and stability of the conjugates in food systems in general and beverages in particular.
Acknowledgments
The study was conducted in the Food Engineering Department at Middle East Technical University, Turkey and National University of Science and Technology (NUST), Pakistan. It was funded under the Horizon 2020 EU MSCA-RISE project SuChAQuality (Grant agreement 101008228).
Author contributions
Rabaila Riaz: Conceptualization; investigation; methodology; validation; writing – original draft. Ozan Tas: Validation. Mecit Halil Oztop: Funding acquisition; methodology; validation; conceptualization; resources. Hussnain Ahmed Janjua: Conceptualization; investigation; writing – original draft; methodology; validation; funding acquisition; supervision. Muhammad Bilal Khan Niazi: Formal analysis.
Conflict of interest
There is no conflict of interest.
Peer review
The peer review history for this article is available at https://www.webofscience.com/api/gateway/wos/peer-review/10.1111/ijfs.17371.
Data availability statement
Data available on request from the authors.
References
This article discusses the use of TD-NMR relaxometry for emulsion. Hence, arguments in this article is cited to discuss the results of emulsion with NMR relaxometry performed in this present study.
This book chapter discusses the structure and function of inulin polymer. This book chapter was cited in the introduction of this article to discuss Inulin carbohydrate.
This article evaluates the functional properties of kabuli chickpea protein, among others oil holding capacity was assessed. This article is cited for following the protocol for OAC.
This article discusses the functional properties of soy-dextran conjugate. It discusses moisture holding and water loss phenomenon in food matrices and these arguments were used to support the results of moisture uptake performed in this study.
This article is about glycation of WPI-gum acacia and FTIR was used as a characterisation method. Arguments regarding FTIR were cited to explain the FTIR spectra analysis performed in the present study.
