


Abstract
In this study, bioactive compounds, antioxidant activity, phytochemicals, fatty acid compositions, elements and sensory characteristics of the breads prepared using wheat flour and nutmeg powders at different concentrations were investigated. The results obtained regarding the physical and chemical properties of nutmeg breads exhibited some changes based on the nutmeg amounts added in bread production. Also, ‘L*’ results of the breads changed between 70.85 (1.0%) and 76.09 (0.5%). In addition, ‘a*’ and ‘b*’ results of breads with nutmeg powder were assigned to be between 0.47 (0.5%) and 1.93 (2.0%) to 18.44 (2.0%) and 20.42 (0.5%) and 1.93 (0.5%), respectively. Total phenol and flavonoid amounts of breads were established between 24.64 (0.5%) and 47.58 mg GAE per 100 g (2.0%) to 10.71 (control) and 177.38 mg per 100 g (2.0%), respectively. An increase in the redness value was monitored in nutmeg bread added at the rate of 1% and 2%. The amounts of phenolic constituents in the breads fluctuated depending on the added nutmeg concentrations. Gallic acid and 3,4-dihydroxybenzoic acid values of the breads were stated to be between 2.66 (2.0%) and 6.66 mg per 100 g (1.0%) to 1.48 (2.0%) and 2.71 mg per 100 g (control), respectively. Phosphorus and potassium quantities of the breads were found between 743.60 (control) and 810.50 mg kg−1 (0.5%) to 2077.37 (1.5%) and 2345.42 mg kg−1 (0.5%), respectively. The dominant fatty acids in bread oils were myristic, palmitic, oleic and linoleic acids. It can be seen that the addition of nutmeg in high concentration decreased the consumer's taste. In addition, the added nutmeg increased the colour value of the bread and corrected the textural structure.
Introduction
Bread is one of the oldest foods known as an important source of carbohydrates in the food pyramid. The way of cooking healthy depends on the formulation components of the foods (Ibrahim et al., 2015). The trend of enriching bread and bakery products with plant products has led to the development of production and better knowledge about biological active constituents (Dziki et al., 2014). In recent years, various herbal products, extracts, oleoresins, essential oils and herbal by-products have been added to foods, and various studies have been conducted on increasing the nutritional values as well as the biological values of foods (Sayed-Ahmad et al., 2018). The formulation of bread can be enriched with plant-based ingredients such as polyphenol and carotenoid, thus increasing the bioactive properties of bread (Rahaie et al., 2014). Enriching bread, which has an important place in our daily food consumption, with active ingredients such as phenolic antioxidants, is important for consumer health. Studies continue to make bakery products healthier by enriching them with functional ingredients (Akhtar et al., 2011). Therefore, the addition of oilseeds, which are rich in functional components, to bread not only increases the organoleptic properties of the bread, but also has a dual role to provide essential bioactive substances in the bread (de Lamo & Gomez, 2018). Nutritional fibres have long been used in products such as bread, cake and biscuits. In recent years, by adding dietary fibre to breads as well as natural ingredients with bioactive properties, the functional properties of bakery products are increased and they are made more beneficial to health (Meral & Doğan, 2009). In recent years, there has been a trend towards the use of plant materials rich in antioxidant activity in foods (Dziki et al., 2014). Diseases caused by unbalanced nutrition are one of the main global problems among humans. An effort should be made to produce bread enriched with physiological-functional components instead of traditional bread types (Stepankova et al., 2017). In the field of food production, efforts to diversify food products and improve their qualities are gaining momentum day by day with technological developments. However, consumer demands also change significantly. Consumers' awareness that nutrition and health are directly related has led them to expect additional physiological benefits from foods in addition to their nutritional properties (Kapsak et al., 2011). Recently, the use of spices with functional properties has come to the fore in order to enrich the nutritional value of cookies and to improve their nutritional and functional properties. Nutmeg is used as a sweetener in many types of baked goods, breads, confectionery, puddings, dairy products, meats, meat products, sauces, vegetables and beverages, due to the aroma compounds they contain. Consumer awareness and increased interest in different types of bread have led to an increase in the use of natural products and fibre products that improve the quality of flour in the food industry in recent years. Although bread has a very important place in the nutrition of people all over the world, the quality of the bread produced is not at the desired level. In this case, the use of nutmeg additive is inevitable in order to increase the nutritional value, sensory properties and quality of bread and to facilitate processing. Therefore, the purpose of present study was to investigate the bioactive compounds properties, phytochemicals, fatty acids, elements and sensory characteristics of the breads prepared using wheat flour and nutmeg powders at different levels.
Material and methods
Material
The nutmeg was provided from a local spice market in Konya-Turkey. Wheat flour was provided from a flour company in Konya-TURKEY. The chemical compositions of the wheat flour are 1.7% oil, 11.6% protein and 0.55% ash. Bread yeast (Efsane) was purchased from a local market.
Methods
Preparation of breads
Fifty grams flour, 57.5 mL drinkable water, 1% salt, 1% yeast and nutmeg to prepare the dough in production of bread were used. After the nutmeg nut powder (0.5%, 1.0%, 1.5% and 2.0% concentrations) was added to the dough mixture, the dough was thoroughly kneaded. After fermentation was applied for 30 min, the dough was cut by hand to give a round shape (about 8–10 cm), and then rested for 10 min. The cut dough were baked in an oven at 220 °C for 30 min.
Moisture content
The KERN & SOHN GmbH (Germany) electronic moisture analyser was used for the moisture amounts of the breads.
Colour value
A Minolta Chroma meter CR 400 (Konica Minolta, Inc., Osaka, Japan) was applied for the analysis of colour values of the bread samples.
Extraction procedure
After 10 mL of methanol:water (80:20 v/v) was added to 1 g ground bread sample, the mixture was sonicated for 30 min in ultrasound bath, and then it was centrifuged at 2817 g for 10 min. The supernatant was removed and filtered. The extract was filtered with 0.45 μm filter (Abreu et al., 2019).
Total phenolic content
Total phenolic amounts of the bread were stated using the Folin–Ciocalteu (FC) chemical according to the report defined by Yoo et al. (2004). After pretreatments, the findings are described as mg gallic acid equivalent per 100 g.
Total flavonoid amount
Total flavonoid quantities of the breads were depicted according to the study suggested by Hogan et al. (2009). The absorbance was displayed at 510 nm. The findings are given as mg quercetin per 100 g.
Antioxidant activity
The antioxidant activities of the breads were assessed by using DPPH (1.1-diphenyl-2-picrylhydrazyl) according to the research recommended by Lee et al. (1998). The absorbance was read at 517 nm. The findings are stated as mmol trolox kg−1.
Phenolic compounds
Chromatographic separation of phenolic compounds was determined by HPLC (Shimadzu, Japan) equipped with a PDA detector and an Inertsil ODS-3 (5 μm; 4.6 × 250 mm) column. The mobile phase was a mixture of 0.05% acetic acid in water (A) and acetonitrile (B) with the flow rate of 1 mL min−1 at 30 °C. The injection volume was 20 μL.
Oil content
After the bread samples were ground, 10 g of each sample was weighed into the cartridge and placed in the extractor, Soxhlet was obtained with petroleum ether for 5 h at 50 °C. At the end of this period, the petroleum ether in the micelle was removed in the evaporator and the oil yield was calculated as crude oil.
Fatty acid composition
Gas chromatography (Shimadzu GC-2010) equipped with flame-ionisation detector (FID) and capillary column (Tecnocroma TR-CN100, 60 m × 0.25 mm, film thickness: 0.20 μm) was used to identify fatty acids in bread oils esterified according to ISO-5509 (1978) method were analysed.
Sensory evaluation of breads
Sensory analysis of the breads was carried out by ranking test method and sixteen experienced personnel were selected for sensory testing. Breads were subjected to sensory evaluation 24 h after they came out of the oven. Samples were presented to each panellist at the same time, and asked to rate (1 = very bad, 2 = bad, 3 = moderate, 4 = good, 5 = very good).
Statistical analyses
The statistical analysis of the results obtained was carried out by JMP statistical program. Statistical changes were assigned by the analysis of variance (Anova) procedure in all data (P < 0.05). Differences between averages depending on concentrations were defined by the Duncan test. All analyses were performed in three replicates.
Results and discussion
Physico-chemical and bioactive properties of the breads
The physico-chemical properties of the breads added nutmeg powder at different concentrations (0.5%, 1.0%, 1.5% and 2.0%) are shown in Table 1. The physical and bioactive properties of the nutmeg breads exhibited some differences based on the nutmeg concentration added in bread production. The moisture of the breads was defined to be between 25.98 (1.0%) and 29.03% (1.5%). Some fluctuations were observed in the moisture amount of the breads with the addition of nutmeg at different concentrations. Also, ‘L*’ results of the breads were depicted to be between 70.85 (1.0%) and 76.09 (0.5%). In addition, ‘a*’ and ‘b*’ results of the bread samples with nutmeg powder were measured between 0.47 (0.5%) and 1.93 (2.0%) to 18.44 (2.0%) and 20.42 (0.5%) and 1.93 (0.5%), respectively. The obtained parameters-lightness (L*), greenness (a*), yellowness (b*) are assigned in Table 1. L* values of the breads varied between 64.53 and 68.33, while a* and b* values were found as 5.20–6.73 and 25.19–28.53, respectively. The highest L* (68.33) and b* (28.53) values of the breads were assessed in control. The a* values of cookies were close to each other. In a study conducted by Abdel-Samie et al. (2016), L* and b* results of cookies exhibited a decrease from 65.3 to 61.6–59.9 (L*); from 38.6 to 36.2–36.6 (b*) with the addition of cumin or ginger to flour. A decrease (from 8.9 to 7.1) and an increase (from 8.9 to 10.3) were monitored with the addition of cumin and ginger, respectively. In a previous study, as the poppy paste concentration of crackers made by adding yellow poppy seed paste at 10%, 20% and 30% concentrations increased, the L* value decreased, while an increase was monitored in the a* and b* values. In other study, L* values decreased from 73.14 to 29.25 with the addition of hemp flour to bread flour, while a* values increase from 0.85 to 3.36 (Mikulec et al., 2019). Romankiewicz et al. (2017) determined that the L*, a* and b* results of breads to which chia seeds were added varied between 67.31 and 75.7, (−) 0.69 and (−) 0.35, and 11.01 and 13.58, respectively. A partial decrease was monitored in the brightness and yellowness values of the breads after baking compared to the control (except 0.1%). However, an increase in the redness value was observed in nutmeg bread added at the rate of 1% and 2%.
Some chemical and bioactive properties of breads enriched with nutmeg powder at different concentrations
| Moisture content (%) | L* | a* | b* | |
|---|---|---|---|---|
| Control | 28.50 ± 0.11*b | 75.60 ± 0.04ab | 1.09 ± 0.46c | 19.68 ± 0.50b |
| 0.5% | 27.26 ± 0.32c | 76.09 ± 0.98a | 0.47 ± 0.15d | 20.42 ± 0.75a |
| 1.0% | 25.98 ± 0.93e | 70.85 ± 0.52e | 1.64 ± 0.22b | 19.68 ± 0.01b |
| 1.5% | 29.03 ± 0.15a | 74.70 ± 0.15c | 1.07 ± 0.33c | 18.44 ± 0.05d |
| 2.0% | 26.26 ± 0.15d | 72.67 ± 0.15d | 1.93 ± 0.12a | 19.58 ± 0.17bc |
| Total phenolic content (mg per 100 g) | Total flavonoid content (mg per 100 g) | Antioxidant activity (mmol kg−1) | Oil content (%) | |
|---|---|---|---|---|
| Control | 32.02 ± 4.10d | 10.71 ± 2.02e | 2.55 ± 0.02d | 0.54 ± 0.00e |
| 0.5% | 24.64 ± 0.19e | 119.29 ± 7.28d | 2.54 ± 0.06de | 0.72 ± 0.00c |
| 1.0% | 34.56 ± 0.30c | 160.71 ± 4.21c | 2.90 ± 0.01bc | 0.65 ± 0.14d |
| 1.5% | 39.88 ± 0.70b | 175.48 ± 14.40b | 2.99 ± 0.03b | 0.84 ± 0.05b |
| 2.0% | 47.58 ± 0.62a | 177.38 ± 5.99a | 3.27 ± 0.03a | 1.09 ± 0.03a |
Values within each column followed by different letters are significantly different at P < 0.05.
*Standard deviation.
Total phenol and flavonoid contents of breads were defined to be between 24.64 (0.5%) and 47.58 mg GAE per 100 g (2.0%) to 10.71 (control) and 177.38 mg per 100 g (2.0%), respectively. Antioxidant capacities of the breads were assigned to be between 2.54 (0.5%) and 3.27 mmol kg−1 (2.0%). In general, total phenol, total flavonoid amounts and antioxidant activities of the nutmeg bread samples increased when compared to the control. Some minor differences observed in the physical and chemical characteristics of the breads are probably due to the fact that the added nutmeg is not distributed homogeneously in the dough and the heat contact times are different. In a previous study, total phenol, total flavonoid amounts and antioxidant capacities of cheese bread with cowpea were 188.4 mg GAE per 100 g, 85.9 mg EQ per 100 g and 497.5 μmol TEAC per 100 g, respectively (Cavalcante et al., 2019). Bread produced by wheat flour only (no turmeric added) and with 8% turmeric powder, respectively, had 30.9 and 150.5 mg GAE per 100 g total phenolic contents (Lim et al., 2011). In a previous study, total phenol, total flavonoid amounts and antioxidant activities of cheese bread with cowpea were 188.4 mg GAE per 100 g, 85.9 mg EQ per 100 g and 497.5 μmol TEAC per 100 g, respectively (Cavalcante et al., 2019). 1.0%, 3.0, 5.0 and 7.0% concentrations of coriander leaf powder added to bread flour increased the antioxidant effect of bread, and adding 3% and 5% improved bread quality (Das et al., 2012). Total polyphenolic values of the different cookies were defined to be between 68.7 and 827.0 mg GAE per 100 g (Bertagnolli et al., 2014). Antioxidant activities and total phenolic amounts of cookies fortified with carob flour were assigned to be between 2.32 and 76.75% to 36.59 and 123.61 mg GAE per 100 g, respectively (Babiker et al., 2020). Das et al. (2012) reported that 1.0%, 3.0%, 5.0% and 7.0% concentrations of coriander leaf powder added to bread flour increased the antioxidant effect of bread, and coriander leaf powder added at 3% and 5% improved bread quality. The oil yields of the breads were stated to be between 0.54% (control) and 1.09% (2.0%). The highest fat was detected in nutmeg bread, which was added at the rate of 2%. A gradual increase was observed in the oil content. These differences in the results obtained can be probably due to the parts of pepper variety, flour type, baking and ingredients.
The phenolic compounds of the breads
The phenolics of the breads added nutmeg powder are displayed in Table 2. The phenolic components of the breads fluctuated depending on the added nutmeg concentrations. Gallic acid and 3,4-dihydroxybenzoic acid values of the breads added nutmeg powder at different concentrations were specified to be between 2.66 (2.0%) and 6.66 (1.0%) to 1.48 (2.0%) and 2.71 mg per 100 g (control), respectively (Fig. 1). In addition, catechin and rutin amounts of the breads were displayed to be between 0.76 (2.0%) and 3.46 (control) to 0.30 (1.5%) and 0.74 mg per 100 g (control), respectively. The amounts of other phenolic compounds were found below <0.20 mg per 100 g. In general, phenolic compounds of the breads decreased in parallel with the increase in nutmeg concentration. On the other hand, the ferulic acid, quercetin, cinnamic acid and kaempferol contents of nutmeg breads added at the rate of 2% were partially higher than the control. These changes in the phenolic constituents of the breads may be due to the low phenolic component amounts of the added nutmeg or the deterioration of their structure due to the applied heat treatment and how long the pepper powders added during the baking of the bread are in contact with the heat or not. The resveratrol, epicatechin and chlorogenic acid contents of kuki produced by enriching it with grape skin were established as 54.27, 43.94 and 35.70 mg per 100 g (Babiker et al., 2020). It has been reported that the overall quality values of cakes produced with clove, nutmeg, allspice, cinnamon, vanilla and spice mixtures are at the highest level. Cakes enriched with a mixture of cloves, allspice and spices were identified as having the highest routine content. Moreover, cakes enriched with a mixture of clove and cinnamon had the richest phenolic compounds (Przygodzka et al., 2015). These differences in the results of the phenolic component obtained when compared to the last reports may be due to the types and amounts of ingredients and additives used in the production of bakery products.
Phenolic compounds of breads enriched with nutmeg powder at different concentrations
| Phenolic compounds (mg per 100 g) | Control | 0.5% | 1.0% | 1.5% | 2.0% |
|---|---|---|---|---|---|
| Gallic acid | 5.31 ± 0.17*b | 4.39 ± 0.12c | 6.66 ± 1.12a | 3.91 ± 0.94d | 2.66 ± 0.54e |
| 3,4-Dihydroxybenzoic acid | 2.71 ± 0.14a | 2.49 ± 0.80c | 2.55 ± 0.62b | 1.61 ± 0.59d | 1.48 ± 0.54e |
| Catechin | 3.46 ± 0.86a | 2.22 ± 0.45c | 2.23 ± 0.52c | 2.94 ± 0.92b | 0.76 ± 0.08d |
| Caffeic acid | 0.20 ± 0.00a | 0.14 ± 0.03c | 0.06 ± 0.00e | 0.19 ± 0.01ab | 0.11 ± 0.02d |
| Syringic acid | 0.16 ± 0.00a | 0.11 ± 0.01d | 0.08 ± 0.01e | 0.15 ± 0.01b | 0.12 ± 0.01c |
| Rutin | 0.74 ± 0.09a | 0.61 ± 0.08b | 0.74 ± 0.09a | 0.30 ± 0.04d | 0.54 ± 0.09c |
| p-Coumaric acid | 0.09 ± 0.02a | 0.04 ± 0.01c | 0.07 ± 0.01b | 0.07 ± 0.01b | 0.07 ± 0.01b |
| Ferulic acid | 0.07 ± 0.01b | 0.07 ± 0.01b | 0.04 ± 0.00d | 0.06 ± 0.01c | 0.08 ± 0.00a |
| Resveratrol | 0.06 ± 0.01d | 0.07 ± 0.01c | 0.06 ± 0.01d | 0.09 ± 0.01a | 0.08 ± 0.02b |
| Quercetin | 0.26 ± 0.03b | 0.22 ± 0.02c | 0.15 ± 0.01de | 0.16 ± 0.01d | 0.47 ± 0.10a |
| Cinnamic acid | 0.34 ± 0.03e | 0.39 ± 0.05d | 0.42 ± 0.02b | 0.60 ± 0.01a | 0.41 ± 0.04bc |
| Kaempferol | 0.42 ± 0.07c | 0.42 ± 0.06c | 0.29 ± 0.06d | 0.54 ± 0.09b | 1.25 ± 0.07a |
Values within each row followed by different letters are significantly different at P < 0.05.
*Standard deviation.
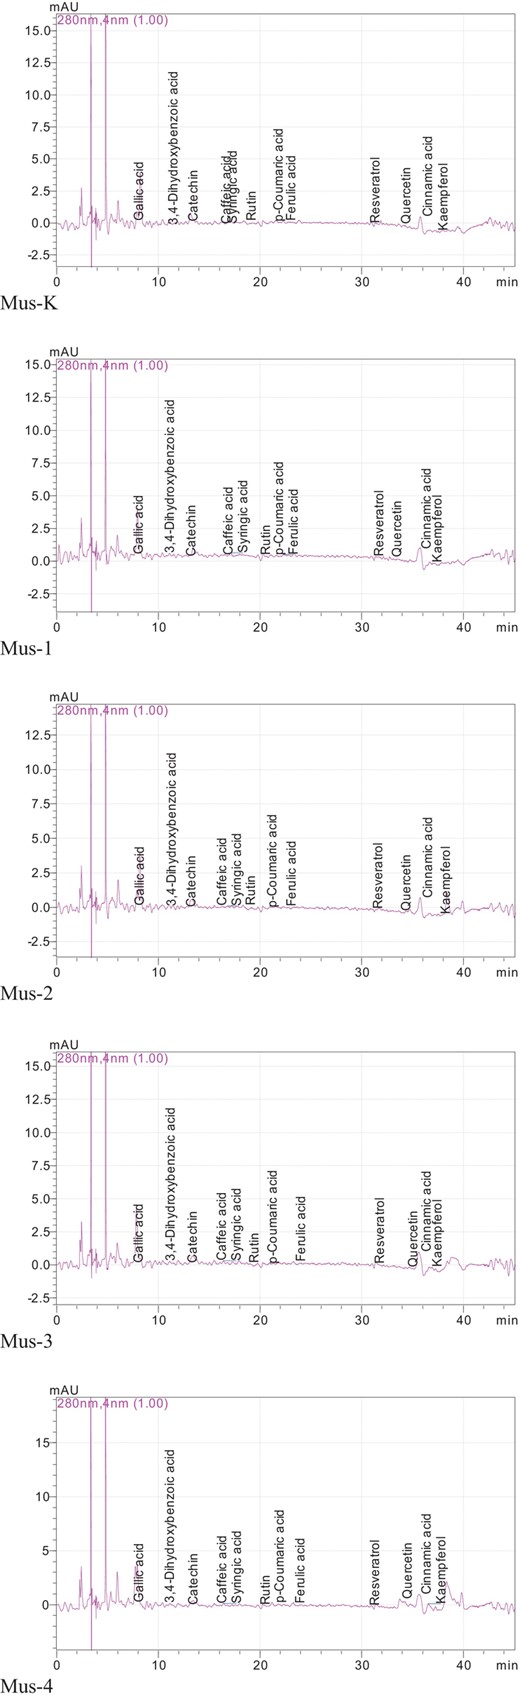
Phenolic chromatograms of bread samples with nutmeg powder.
The mineral and protein amounts of the bread samples
The mineral and protein values of the bread samples added nutmeg powder at different levels are illustrated in Table 3. Phosphorus and potassium values of the breads were found between 743.60 (control) and 810.50 mg kg−1 (0.5%) to 2077.37 (1.5%) and 2345.42 mg kg−1 (0.5%), respectively. Also, while Ca values of the breads change between 187.08 (1.5%) and 223.91 mg kg−1 (1.0%), Mg amounts of bread samples were defined to be between 246.66 (control) and 271.35 mg kg−1 (0.5%). Fe and Zn amounts of bread added nutmeg powder at different concentrations were measured between 9.19 (1.0%) and 14.13 mg kg−1 (1.5%) to 3.93 (2.0%) and 4.71 mg kg−1 (control), respectively. Mn quantities of the breads changed between 3.77 (control) and 4.64 mg kg−1 (0.5%). The protein values of the breads were assigned to be between 9.76% (2.0%) and 11.33% (0.5%). In general, the mineral amounts (except Fe) of 0.5% nutmeg added bread were found at the highest levels. The mineral content of breads made at other concentrations decreased gradually. This may probably be due to the low mineral content of the added nutmeg plant material, which reduces the mineral content of the main product, bread, with an increase in concentration. In addition, this decrease probably caused a decrease in minerals due to the low mineral amount of the added nutmeg and thus increasing the ratio in the cumulative weight of the breads. Cheese bread enriched with cowpea contained 211 Ca, 187 P, 204 K, 347 Na, 25.6 Mg, 1.3 Zn, 0.2 Mn and 0.07 mg per 100 g Cu (Cavalcante et al., 2019). These differences established in minerals of bread samples can be likely due to nutmeg type, ripening, drying, baking, dosage and amounts of ingredients and additives used in bread production.
Mineral and protein contents of breads enriched with nutmeg powder at different concentrations (mg kg−1)
| Concentrations (%) | P | K | Ca | Mg | S | Fe | Cu | Mn | Zn | B | Protein (%) |
|---|---|---|---|---|---|---|---|---|---|---|---|
| Control | 743.60 ± 3.62*e | 2118.01 ± 14.16d | 194.09 ± 3.00c | 246.66 ± 0.60e | 794.58 ± 1.23c | 9.86 ± 1.23d | 0.94 ± 0.02d | 3.77 ± 0.07d | 4.71 ± 0.09a | 2.82 ± 0.05a | 11.28 ± 0.14b |
| 0.5% | 810.50 ± 11.72a | 2345.42 ± 11.37a | 211.00 ± 3.66b | 271.35 ± 6.51a | 861.31 ± 12.49a | 10.62 ± 0.11b | 1.87 ± 0.08a | 4.64 ± 0.16ab | 4.62 ± 0.15 | 2.76 ± 0.09b | 11.33 ± 0.05a |
| 1.0% | 765.81 ± 26.10c | 2329.41 ± 119.49b | 223.91 ± 8.43a | 262.75 ± 9.46c | 847.08 ± 64.17b | 9.19 ± 0.89e | 1.75 ± 0.08c | 4.16 ± 0.04b | 4.15 ± 0.03 | 2.50 ± 0.03d | 10.49 ± 0.50c |
| 1.5% | 745.92 ± 6.98d | 2077.37 ± 8.30e | 187.08 ± 4.36e | 255.15 ± 1.42d | 755.34 ± 4.68e | 14.13 ± 2.10a | 0.87 ± 0.02e | 4.35 ± 0.11c | 4.35 ± 0.10 | 2.61 ± 0.06c | 10.32 ± 0.00d |
| 2.0% | 771.33 ± 32.28b | 2227.84 ± 67.56c | 191.81 ± 14.84d | 266.35 ± 21.92b | 781.24 ± 51.14d | 10.05 ± 0.55c | 1.82 ± 0.05ab | 4.36 ± 0.05c | 3.93 ± 0.48 | 2.62 ± 0.03c | 9.76 ± 0.29e |
Values within each column followed by different letters are significantly different at P < 0.05.
*Standard deviation.
Fatty acid profiles of the bread oils
Fatty acid profiles of the oils obtained from breads added nutmeg are defined in Table 4. The fatty acid profiles of the oils exhibited some changes based on the nutmeg concentrations added to bread production. While palmitic acid values of the bread oils change between 12.39% (1.5%) and 18.95% (control), myristic acid values of the oils obtained from breads were specified to be between 0.50% (control) and 37.62% (1.5%) (Fig. 2). Also, stearic acid amounts in the breads were stated to be between 1.57% (1.5%) and 2.46% (control). Oleic and linoleic acid values of the bread oils were assigned to be between 31.65 (1.5) and 57.51 (control) to 13.73 (2.0%) and 18.19% (control), respectively. The quantities of other fatty acids were depicted below <0.99%. In general, the fatty acid contents of the oils in breads enriched with coconut oil at different concentrations decreased compared to the control (except myristic acid). The temperature of the environment and the presence of oxygen may have probably contributed to this decrease. On the other hand, the myristic acid amounts of the oils obtained from breads increased. Therefore, the essential fatty acids of the nutmeg powder oils used in bread production showed their effect on bread. Palmitic, oleic, arachidic, stearic and lauric acid amounts of cookie samples enriched with carob flour were established as 32.58% and 35.86%, 28.84% and 29.59%, 19.49% and 24.18%, 5.73% and 6.16%, 3.91% and 4.31%, respectively (Babiker et al., 2020). These differences in fatty acids are probably due to the nutmeg concentration added to the bread and the baking process applied (temperature and time). In addition, the probable reason for these changes when compared to the last studies may be due to the nutmeg added to the breads.
Fatty acid compositions of the oils extracted from breads enriched with nutmeg powder at different concentrations (%)
| Fatty acids | Control | 0.5% | 1.0% | 1.5% | 2.0% |
|---|---|---|---|---|---|
| Lauric | 0.86 ± 0.03*a | 0.75 ± 0.00c | 0.86 ± 0.02a | 0.80 ± 0.05b | 0.58 ± 0.01d |
| Myristic | 0.50 ± 0.01e | 17.50 ± 0.07d | 18.80 ± 0.00c | 37.62 ± 1.43a | 33.10 ± 0.28b |
| Palmitic | 18.95 ± 0.01a | 15.31 ± 0.00b | 14.41 ± 0.01c | 12.39 ± 0.00de | 12.48 ± 0.06d |
| Stearic | 2.46 ± 0.01a | 2.12 ± 0.03b | 2.01 ± 0.00bc | 1.57 ± 0.06e | 1.70 ± 0.01d |
| Oleic | 57.51 ± 0.06a | 46.88 ± 0.16b | 45.12 ± 0.04c | 31.65 ± 0.95e | 37.32 ± 0.23d |
| Linoleic | 18.19 ± 0.00a | 16.40 ± 0.04c | 17.61 ± 0.01b | 14.92 ± 0.44d | 13.73 ± 0.07e |
| Arachidic | 0.40 ± 0.02a | 0.33 ± 0.00b | 0.31 ± 0.00c | 0.22 ± 0.01e | 0.27 ± 0.01d |
| Linolenic | 0.99 ± 0.00a | 0.87 ± 0.01b | 0.79 ± 0.00c | 0.73 ± 0.02d | 0.70 ± 0.00de |
| Behenic | 0.13 ± 0.01a | –† | 0.10 ± 0.00c | 0.09 ± 0.01d | 0.11 ± 0.01b |
Values within each row followed by different letters are significantly different at P < 0.05.
*Standard deviation.
†Nondetected.
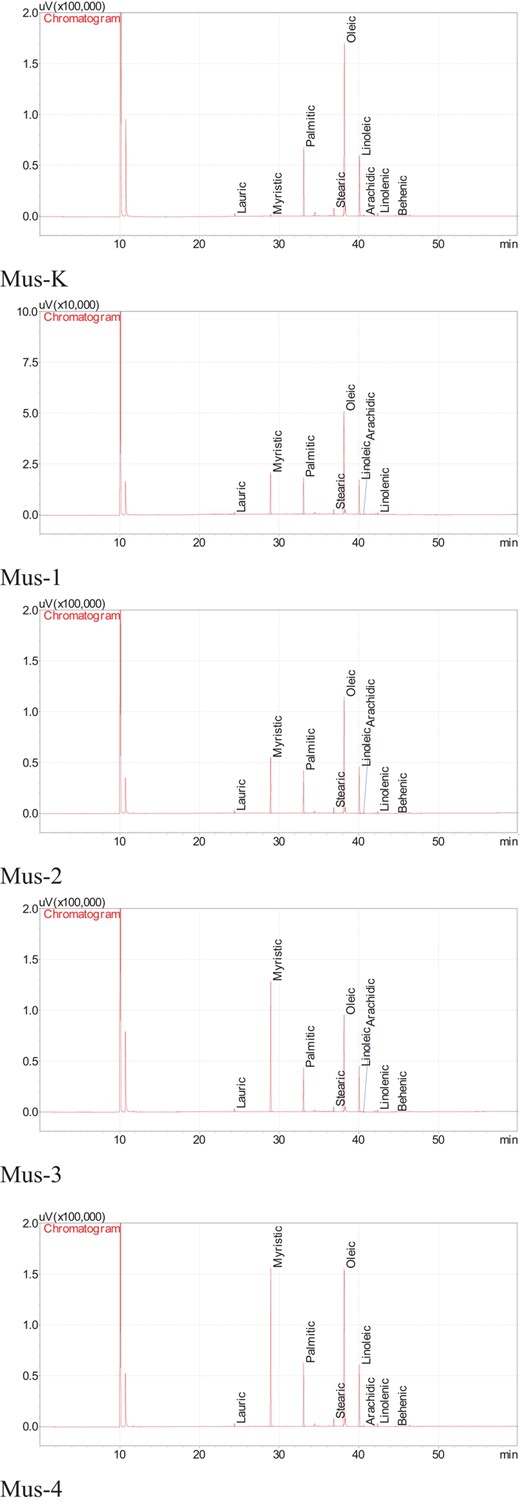
Fatty acid chromatograms of the oils extracted from bread samples.
Sensory properties of the bread samples
Sensory characteristics of the breads are depicted in Table 5. The sensory parameters of the breads got different scores depending on the nutmeg concentration. Flavour and smell scores of bread samples were found between 3.00 (2.0%) and 4.33 (control) to 3.17 (2.0%) and 4.33 (0.5%), respectively. Also, while colour values of breads are taking values between 3.83 (control) and 4.67 (1.0%), texture values of bread samples had took values between 4.00 (control) and 4.33 (1.5%). The flavour and smell (except 0.5%) values of the bread samples were less appreciated by the panellists than the control. The bread sample with nutmeg added at 0.5% concentration got the highest flavour, followed by control, 1.0%, 1.5% and 2.0% nutmeg added bread samples, in descending order. Also, it can be seen that the addition of nutmeg in high concentration decreased the consumer's flavour. The factor that may cause a decrease in overall sensory acceptance with increasing nutmeg levels may be due to the fatty acid composition and phenolic component structure of nutmeg oil. It was also observed that the added nutmeg increased the colour value of the bread and improved its textural structure. In a previous study, bread produced using 5% ginger powder had the highest average hedonic score in terms of colour, taste, flavour, texture and overall acceptability, making it considered the most acceptable bread by consumers (Akanbi & Folorunso, 2022). Nadeem et al. (2010) stated that breads prepared with the addition of up to 14% shelled sunflower seeds and wheat flour received acceptable high scores in terms of all sensory properties. The sensory characteristics of breads produced by adding ginger powder (3%, 4.5% and 6% levels) decreased (Balestra et al., 2011). Nadeem et al. (2010) stated that breads prepared with the addition of up to 14% shelled sunflower seeds and wheat flour received acceptable high scores in terms of all sensory properties. As a result, the most popular bread samples were enriched with 1.0% nutmeg powder, followed by 1.5%, 2.0%, 0.5% added bread samples in decreasing order. It was observed that as more nutmeg flour was added to the bread flour, the sensory scores of the bread samples decreased.
Sensorial properties of breads enriched with nutmeg powder at different concentrations
| Sample | Flavour | Smell | Colour | Texture | General view |
|---|---|---|---|---|---|
| Control | 4.33 ± 0.75*a | 4.17 ± 0.69b | 3.83 ± 0.37c | 4.00 ± 0.82c | 4.17 ± 0.69a |
| 0.5% | 4.00 ± 0.82b | 4.33 ± 0.47a | 4.33 ± 0.75b | 4.17 ± 0.69b | 4.00 ± 0.58ab |
| 1.0% | 3.67 ± 1.11c | 3.50 ± 0.96c | 4.67 ± 0.47a | 4.17 ± 0.69b | 3.83 ± 0.90c |
| 1.5% | 3.33 ± 0.94d | 3.50 ± 0.96c | 4.33 ± 0.47b | 4.33 ± 0.75a | 3.67 ± 0.94d |
| 2.0% | 3.00 ± 1.29e | 3.17 ± 0.90d | 4.33 ± 0.47b | 4.17 ± 0.69b | 3.33 ± 0.94e |
Values within each column followed by different letters are significantly different at P < 0.05.
*Standard deviation.
Principal component analysis of phenolic compounds
Principal component analysis (PCA) was performed to assess the addition of nutmeg on phenolic compounds of breads, which are given Fig. 3. PCA was constructed with two components accounting for 71.276% (44.983% for PC1 and 26.293% for PC2) of total variance. Gallic acid (−0.972) and 3,4-dihydroxybenzoic acid (−0.923) showed negative correlation with PC1, while a positive correlation with PC2 was observed in resveratrol (0.869) and kaempferol (0.849) (Table 6).
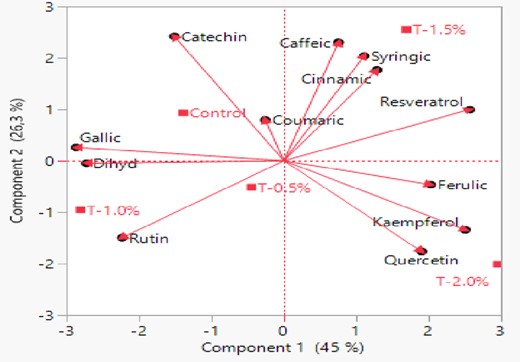
Biplot graph drawn with results of principal component analysis.
Principal component analysis results in relation to phenolic compounds of breads enriched with nutmeg powder
| PC1 | PC2 | |
|---|---|---|
| Eigenvalue | 5.398 | 3.155 |
| Variability (%) | 44.983 | 26.293 |
| Cumulative (%) | 44.983 | 71.276 |
| Correlation | ||
| Gallic | −0.972 | 0.088 |
| Dihyd | −0.923 | −0.016 |
| Catechin | −0.513 | 0.820 |
| Caffeic | 0.255 | 0.780 |
| Syringic | 0.375 | 0.690 |
| Rutin | −0.757 | −0.507 |
| Coumaric | −0.087 | 0.269 |
| Ferulic | 0.687 | −0.157 |
| Resveratrol | 0.869 | 0.337 |
| Quercetin | 0.644 | −0.598 |
| Cinnamic | 0.435 | 0.599 |
| Kaempferol | 0.849 | −0.456 |
Conclusion
In general, total phenol, total flavonoid amounts and antioxidant activities of the nutmeg bread samples increased when compared to the control. Phenolic compounds of the breads decreased in parallel with the increase of nutmeg concentration. The flavour and smell (except 0.5%) values of the breads were less appreciated by the panellists than in the control. In addition, the colour and texture properties of the breads were appreciated by the panellists in parallel with the increase in nutmeg level. The mineral content of breads made at other concentrations decreased gradually. The fatty acids (except myristic acid) of the oils obtained from breads containing different concentrations of coconut powder decreased compared to the control in parallel with the increase in nutmeg concentration. On the other hand, the myristic acid content of the oils obtained from bread increased with the increase in nutmeg concentration. Adding different concentrations of coconut flour to whole wheat flour to prepare fortified bread increased the bioactive properties and phenolic components of the bread.
Acknowledgment
The authors extend their appreciation to Researchers Supporting Project Number (RSPD2024 R1109), King Saud University, Riyadh, Saudi Arabia.
Author contributions
Akram A. Qasem: Investigation; validation. Isam A. Mohamed Ahmed: Data curation; writing – review and editing. Belal M. Mohammed: Data curation; validation; writing – review and editing. Mehmet Musa Özcan: Methodology; investigation; formal analysis; writing – review and editing; writing – original draft. Zainab Albakry: Data curation; software; methodology.
Conflict of interest
No conflict of interest.
Data availability statement
Data will be made available on request.
References
Studies continue to make bakery products healthier by enriching them with functional ingredients.
In recent years, there has been a trend towards the use of plant materials rich in antioxidant activity in foods.
By adding dietary fibre to breads as well as natural ingredients with bioactive properties, the functional properties of bakery products are increased and they are made more beneficial to health.
The formulation of bread can be enriched with plant-based ingredients such as polyphenol and carotenoid, thus increasing the bioactive properties of bread.
