


Abstract
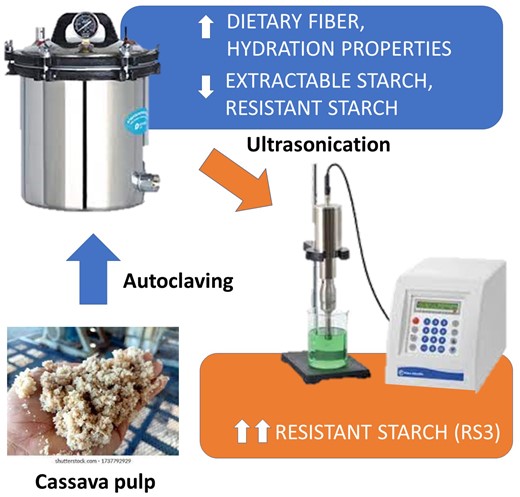
Autoclaving (15 min, 121 °C, 1 atm overpressure) and high-intensity ultrasound (3 pulses of 1 min, 750 W, 20 kHz, 80% amplitude) were evaluated individually or combined in cassava pulp to reduce the digestible starch and increase the fibre content. Ultrasound alone produced minimal modifications, and the subsequent autoclaving increased the oil-binding capacity and swelling. Autoclaving alone significantly increased total dietary fibre (TDF) from 14.7% to 21.4%, and the ratio of hemicellulose to lignocellulose. It also reduced the extractable starch from 42.7% to 7.5% and the resistant starch from 7.4% to 3.1%. Despite the higher digestibility, the starch digestion rate with pancreatic α-amylase was slower. Starch solubility increased at 25, 68, and 90 °C. Ultrasonication after autoclaving reduced the hemicellulose percentage, but the sorption properties remained unchanged. Resistant starch substantially increased to 39.9%, mainly composed of RS1 (inaccessible starch), and starch solubility decreased at the three temperatures assayed.
Introduction
Cassava (Manihot esculenta) root is a staple food in developing countries. Its production is mainly destined for fresh consumption and for obtaining cassava starch (Scott, 2021).
The cassava starch extraction residue, also known as cassava pulp, has moisture contents above 85%, for which 0.93–1.12 tons of pulp are produced per ton of root processed (Escaramboni et al., 2018). The dry matter of cassava pulp is mainly composed of carbohydrates (up to 82.8%) with ~50% of residual starch, low protein and ash contents (Polachini et al., 2016), and fibre between 20% and 30% (Wandee et al., 2014). The water and starch contents make cassava pulp a highly fermentable substrate. Thus, when disposed of in landfills, fermentation produces unpleasant odours and negatively impacts the environment (Morales et al., 2020). The transformation to a less spoilage-susceptible product might contribute to the commercial potential of cassava pulp or mitigate the environmental effects of disposing of it. Particularly, food-compatible processes that may increase the proportion of dietary fibre and/or improve its functionality expands the number of potential applications. In this sense, physical modifications such as ultrasound and autoclaving are sustainable, low-cost alternatives (Li et al., 2019; Bhargava et al., 2021). Ultrasound uses sound waves exceeding 20 kHz to generate compressions and decompressions in the medium particles releasing high amounts of energy (Bhargava et al., 2021). In food application, ultrasound of high intensity (10–1000 W/cm2) and low frequency (20–100 kHz) is used for disrupting food matrices and modifying their properties (Bhargava et al., 2021). Autoclaving, for its part, is a high-pressure hydrothermal process traditionally used for sterilisation, which can also modify the technological and nutritional properties of foods and food-derived products (Naibaho et al., 2021).
Agro-industrial residues from starchy crops rich in digestible starch can also contain considerable amounts of resistant starch. Starch entrapped in the fibrous structure that becomes inaccessible to the digestive enzymes constitutes type I resistant starch (RS1). Ultrasound and autoclaving can reduce RS1 by releasing the entrapped granules but can also be used to solubilise digestible starch, leading to an increased proportion of fibre. These treatments were also reported to increase type III resistant starch (RS3, retrograde starch) by promoting the disorganisation and subsequent recrystallisation of amylose chains (Mapengo & Emmambux, 2022).
This work aimed to assay inexpensive food-compatible physical treatments: ultrasonication and autoclaving, individually or combined, to increase the percentage of fibre in cassava pulp by reducing the digestible starch and/or generating resistant starch, and evaluate the modifications in their composition and sorption properties and the potential impact on their microbiological stability.
Materials and methods
Obtention of fibrous residues from cassava starch extraction
Cassava (Pombero cultivar) was cultivated at Paraje Esperanza (Misiones, Argentina). Starch extraction was performed according to Strack et al. (2021), based on the industrial cassava starch extraction process. In brief, roots were peeled and diced, added with tap water (1:1, w:v), ground, and left for 24 h at 4 °C, then filtered. The retained bagasse was added with fresh water and the procedure was repeated. After six filtrations, one-third of the insoluble residue was separated, vacuum-dried at 70 °C and 50 mbar (Vacuubrand PC 500, Germany) for 24 h, milled, and sieved (1 mm mesh size), corresponding to sample C.
The starch slurry was left to sediment at 4 °C, dried in a convection oven at 40 °C, milled, and sieved (100 mesh) according to Malgor et al. (2019) to obtain native cassava starch.
Ultrasonic and thermal treatments of fibrous residue from starch extraction
The remaining fibre from Section 2.1 was treated as described in Strack et al. (2021): suspended in distilled water (DW, 1:1, w:v) and autoclaved (121 °C, 15 min, 1 atm of overpressure). Half of the suspension was filtered, washed with DW, vacuum dried, milled, and sieved as described in Section 2.1 to obtain residue CA. The other half was subjected to ultrasound treatment. Conditions were tuned from those reported by Mustač et al. (2019) for Proso millet bran modification: 5 min, 100% amplitude, 24 kHz, 400 W. A Vibra-Cell™ VCX-750 Ultrasonic Liquid Processor (Sonics & Materials Inc., USA) with a 13 mm tip diameter probe (115 μm maximum amplitude) was used at 20 kHz, 750 W, and 80% amplitude. Three pulses of 1 min each were applied to the dispersions while kept in an ice bath to avoid temperature rise, then filtered, washed, dried, milled, and sieved, as described above, to obtain residue CAU.
Inverse steps were also assayed, in which the remaining insoluble residue from starch extraction (Section 2.1) was first subjected to the ultrasound treatment (residue CU) and then autoclaved (residue CUA).
Characterisation of the residues
Moisture, ash, and protein contents
Moisture content and total ash were determined according to the AOAC methods 925.10 and 923.03, respectively (AOAC, 1990).
Total proteins were determined by the Kjeldahl method using 6.25 as the nitrogen-to-protein conversion factor.
Total and extractable starch
Total starch was quantified using the Total Starch (AA/AMG) Assay Kit (Megazyme, Ireland) for samples with D-glucose and maltodextrins.
Extractable starch was quantified following the protocol described in Strack et al. (2021), expressed as percentage % (w/w) db. Samples were dispersed in DW (1:20, w:v), intermittently vortexed for 2 h, and filtered. The filtrate (10 mL) was microwave-heated for 1 min and ultrasound-treated (450 W, 5 min). An 800 μL aliquot was added with 0.25 M HCl and iodometric reagent (1 mM KIO3/5 mM KI). Absorbance (λ = 600 nm) was measured against an iodometric blank. The calibration curve was built using the native cassava starch obtained in Section 2.1. Results were expressed as percentage %(w/w) db.
Total, insoluble, and soluble dietary fibre (TDF, IDF, and SDF)
TDF and IDF were determined using a Total Dietary Fibre Assay Kit (Megazyme, Ireland) and expressed as % (w/w) db, and SDF was calculated by difference.
Neutral detergent fibre and acid detergent fibre (NDF and ADF)
NDF and ADF were determined according to Hatfield et al. (1994) with modifications. Samples (0.4 g) were pre-treated with 6 U/mL of α-amylase from porcine pancreas (Sigma-Aldrich, St. Louis, MO, USA) at 37 °C for 20 min (additionally, for CA, 16 h): NDF-PPA, or from Bacillus licheniformis (Sigma-Aldrich, 20 min, 100 °C): NDF-BL, then added to 80 mL of boiling neutral detergent for 60 min. The residue was filtered through a filter crucible, washed with hot water and acetone, dried at 105 °C overnight, and weighed. For ADF determination, 1.0 g of sample was treated with 400 mL of boiling acid detergent for 60 min, filtered, washed, and dried as for NDF. Results were expressed as %(w/w) db. ADF (%) corresponds to the percentage of lignocellulose in the sample. Hemicellulose content was calculated as:
Colour
A CR-400 colorimeter (Konica Minolta, Osaka, Japan) was used. Five readings were made for each residue. The whiteness index (WI) was calculated from the colour parameters L*, a*, and b* according to Malgor et al. (2019) as
Sorption properties
The swelling power (SP), water-holding capacity (WHC), water-binding capacity (WBC), and oil-binding capacity (OBC) were determined following the protocols described in Strack et al. (2021).
The sample's weight and volume were measured in a 15 mL Falcon tube; DW was added (1:10 w/v) and incubated at 20 °C for 20 h. The volume was measured again and the SP was calculated as:
Excess water was removed and the tube was weighed to calculate the WHC as:
Finally, the tube was centrifuged (1500× g, 10 min) and the pellet was weighed to calculate the water-binding capacity (WBC) as:
The OBC was determined as the WBC using commercial sunflower oil (1:10, w:v) instead of water.
Total resistant starch and RS types I, II, and III
Total resistant starch (RS) was determined on 100 mg of sample sieved through 1 mm (original sample) using the K-RSTAR kit (Megazyme, Ireland). The determination of RS types I, II, and III (RS1, RS2, and RS3) was based on the protocols described in Perera et al. (2010) with some modifications: samples were milled and passed through a 0.2 mm sieve. In these samples, the entrapped (physically inaccessible) starch is released and RS1 is eliminated (Perera et al., 2010). RS was determined on 100 mg of the milled sample using the K-RSTAR kit, corresponding to RS2 + RS3 of the original sample. RS1 in the original sample was calculated by difference:
For the determination of RS3 (retrograded starch), 100 mg of the sample milled and sieved (0.2 mm) was added with 1.25 mL of sodium maleate buffer (100 mM, pH 6.0) in Hach tubes, mixed, and heated in a water bath at 100 °C for 1 h to eliminate RS2 (Perera et al., 2010). The tubes were thermostatted at 37 °C for 30 min and then added with 4 mL of the α-amylase+amyloglucosidase solution of the K-RSTAR kit and incubated for 16 h at 37 °C in a shaking water bath (as stated in the kit). Subsequently, 5.25 mL of absolute ethanol was added (1:1 v:v ratio of ethanol to aqueous medium). The procedure was then followed exactly as stated in the kit. RS of the milled and cooked sample corresponds to RS3 of the original sample.
The RS2 in the original sample was calculated as:
Starch solubilisation
Samples (0.6 g) were added with 10.00 mL of DW and left for 12 h at 4 °C. Hydrated samples were equilibrated at room temperature for 30 min and then incubated in a water bath at 25 °C; 68 °C (gelatinisation temperature of native cassava starch) or 90 °C (complete gelatinisation of starch), respectively, for 20 min. As a control, 13 mg of native cassava starch (moisture content 9.0%) was added with 100.00 mL of DW and heated in a water bath at 90 °C for 20 min in agitation.
An aliquot of each sample and the control were centrifuged (2500× g, 10 min). An appropriate volume of the sample's supernatant was added to a 25 mL volumetric flask and diluted to ~20 mL with DW. The iodometric reagent (2 mg/mL KI + 0.2 mg/mL I2) was added dropwise until a stable blue colour was reached, and the volume was adjusted to 25 mL with DW. The control (5 mL) was analysed undiluted. The absorbance was measured at 635 nm against the corresponding blank.
The absorbance of the control (Abs635nm = 0.238) was used as reference for complete starch solubilisation. The percentage of starch solubilised from each sample at the respective temperature was calculated as:
where A is the absorbance of the sample corrected with the corresponding reagent blank, DF is the dilution factor, m is the mass of sample (g) expressed on a dry basis and TS are the mg of total starch per g of sample on a dry basis obtained in Section 2.3.2.
Thermogravimetric analysis (TGA)
The samples (~6 mg) were heated from 30 to 550 °C at a ratio of 10 °C/min under a nitrogen atmosphere using a Q-500 TA Instruments equipment (New Castle, DE, USA). Decomposition temperature and the maximum rate of mass loss were determined from the (x,y) coordinates of the maximum of the peak in the derivative of the thermogravimetric curve.
Statistics
Determinations were carried out at least in triplicate. Results were analysed by a one-way ANOVA, followed by a Fisher's Least Significant Difference test at p = 0.05.
Results and discussion
Cassava pulp is mainly composed of water (>85%). After drying to an equilibrium value, the moisture content of all samples ranged from 9.8 to 11.8% (Table 1). Cassava pulp is also rich in residual starch, which can be either occluded within the fibre, located on its external surface, or free. Extractable starch is the fraction of free and external starch granules that can be removed without breaking the fibre structure. The untreated residue (C) had 42.7% of extractable starch, which was decreased to 7.5% after autoclaving (CA), representing a reduction of 82.5% (Table 1). Autoclaving is performed in excess of water, with temperature and pressure conditions far exceeding those of starch gelatinisation; thus, disintegration and solubilisation of most of the external granules are produced, as observed by electronic microscopy in a previous work (Strack et al., 2021). The subsequent ultrasonic treatment (CAU) left a remaining 5.6% of external starch, which represents a reduction of 86.9% of that present in C. Cavitation produces the rupture of plant cell walls (Gan et al., 2021) which was expected to increase the detachment of starch granules, but the extractable starch was only slightly decreased. It is worth mentioning that the increase in temperature produced by the friction in the ultrasound treatment also helps to break down the tissues. In this case, the conditions were kept controlled so that the process was not thermal, and was only a result of the cavitation process, conditions that turned out to be mild. Likewise, when the ultrasound was applied immediately after the starch extraction (CU) the amount of extractable starch in the fibre was only reduced by 2.7% (6.2% of that present in C). The subsequent autoclave treatment (CUA) reduced the extractable starch by 86.9% of the original amount, not differing (p > 0.05) from the inverse treatment (CAU).
Composition and properties of untreated and physically treated cassava pulp
| Sample | Moisture (%) | WI | Extractable starch (%) | Total starch (%) | TDF (%) | IDF (%) | SDF (%)* | NDF-PPA (%) | ADF (%) |
|---|---|---|---|---|---|---|---|---|---|
| C | 10.7 ± 0.1c | 86.5 ± 0.1d | 42.7 ± 1.5d | 58.2 ± 0.8a | 14.7 ± 0.9a | 12.0 ± 0.1a | 2.7 | 13.2 ± 0.5a | 4.4 ± 0.5a |
| CA | 11.8 ± 0.1 e | 60.1 ± 1.4a | 7.5 ± 0.1b | 60.9 ± 1.8b | 21.4 ± 0.6c | 17.9 ± 2.3b | 3.5 | 42.0 ± 3.7b | 7.8 ± 0.5bc |
| CAU | 11.6 ± 0.0d | 64.8 ± 1.0b | 5.6 ± 0.1a | 66.4 ± 1.1c | 21.3 ± 0.7c | 19.0 ± 0.5b | 2.3 | 46.5 ± 4.7b | 9.0 ± 0.9c |
| CU | 10.2 ± 0.1b | 83.7 ± 2.0c | 40.0 ± 0.6c | 58.1 ± 3.0a | 14.5 ± 0.3a | 12.1 ± 0.3a | 2.4 | 9.3 ± 0.8a | 6.8 ± 0.0b |
| CUA | 9.8 ± 0.1a | 66.2 ± 1.1b | 5.6 ± 0.1a | 64.7 ± 0.8c | 18.1 ± 0.2b | 14.7 ± 1.2a | 3.4 | 43.1 ± 1.2b | 9.2 ± 1.7c |
Note: Results are expressed as mean ± SD db.
Different letters within a column indicate significant differences (P < 0.05).
Abbreviations: ADF, acid detergent fibre; NDF-PPA, neutral detergent fibre of the sample pre-treated with α-amylase from porcine pancreas; TDF, IDF and SDF, total, insoluble and soluble dietary fibre, respectively.
Calculated as the difference between TDF and IDF.
Sample C showed the highest whiteness index (WI), followed by CU, which was directly related to the increased values of extractable starch in these samples (Table 1). Autoclaving considerably reduced the WI to values below 67 (Table 1). This was mainly, but not exclusively, related to the reduction of the extractable starch since the ultrasound following autoclaving slightly increased the WI in CAU (Table 1), probably due to the removal of coloured compounds. The inverse treatment (CUA) provided similar results.
Total starch, including extractable starch and that trapped inside the fibre structure, is the major component of all the samples' dry matter: >58% db (Table 1). Total starch in sample C was similar to that informed by Lopak et al. (2020) for dried industrial cassava pulp (59.1% db). Noteworthy, while the autoclave and ultrasonic treatments significantly reduced the amount of extractable starch, the total starch content was significantly increased (p < 0.05), except for CU, which did not differ from C (P > 0.05) (Table 1). These results indicate that the treatments not only remove external starch but also solubilise components of the cell wall and other compounds, not producing a considerable release of granules from the internal structure, thus increasing the proportion of total starch in the residues.
The percentages of total, insoluble, and soluble dietary fibre (TDF, IDF, and SDF) in cassava pulp (C) were slightly different from those reported by Lopak et al. (2020): TDF (18.6%), IDF (18.0), and SDF (0.55%) for the industrial residue, but with a similar trend of IDF as the predominant fraction.
As observed for the total and extractable starch, the fibre content was also similar between C and CU, the latter showing just a slight increase in the percentage of acid detergent fibre (ADF) (p < 0.05). Dried cassava pulp (C) showed low amount of ADF (lignocellulose), and comparable values of total dietary fibre (TDF, 14.7%) and neutral detergent fibre of the sample pre-treated with pancreatic α-amylase (NDF-PPA, 13.2%) (Table 1). Autoclaving (alone or combined with ultrasound) significantly increased the TDF, NDF-PPA, and ADF, probably as a result of the solubilisation of external digestible starch (Table 1). However, the NDF-PPA was increased at a considerably higher rate than the TDF and the ADF (Table 1).
The discrepancy between NDF-PPA and TDF observed in CA, CAU and CUA, suggests that part of the starch is being included in the NDF-PPA quantification. This could be either because it is resistant to PPA and not to the heat-stable α-amylase from Bacillus licheniformis used in the TDF quantification, or because the digestion with PPA is delayed and the digestible starch is not completely hydrolysed under the incubation conditions (37 °C, 20 min).
In CA and CUA, the autoclaving step increased the soluble dietary fibre (SDF) content, as reported by Li et al. (2019) for soybean curd residue, while ultrasonication after autoclaving (CAU) reduced it (Table 1). Ultrasonication is recognised as an effective technique for pectin extraction from plant materials (Khedmat et al., 2020) which is consistent with the reduction in SDF.
Figure 1 shows the sorption properties of the residues. When applied as the first modification step, ultrasound did not change the WHC and WBC of CU compared to C but increased the OBC and swelling. According to Gan et al. (2021), after ultrasonication, the structure of the fibre is altered, and the tissue is loosened, which can be the reason for a higher swelling capacity. Surface hydrophobicity can also change, which can be related to the modification of the OBC. Considering CU still contains high amounts of extractable starch (Table 1), the increased OBC can also be an effect of the ultrasonic treatment on the starch granules. Increased oil absorption was reported for potato, wheat, corn, and rice starches sonicated at the same frequency (20 kHz) but lower power and longer time (170 W, 30 min) (Sujka & Jamroz, 2013) than those used in the present work.
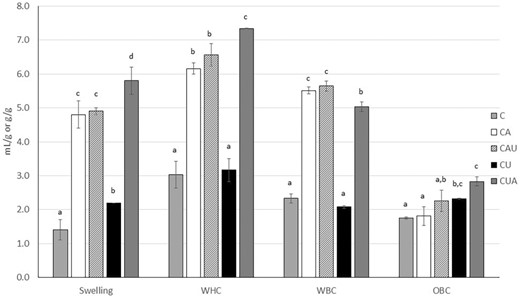
Sorption properties of the fibrous residues expressed as mL/g (Swelling) or g/g. OBC, oil-binding capacity; WBC, water-binding capacity; WHC, water-holding capacity.
Contrary to that observed for CU, autoclaving applied as the first modification step (CA) did not modify the OBC (P > 0.05) but the hydration properties were significantly increased (Fig. 1) in agreement with the increased SDF content. The swelling power was also enhanced.
The ultrasonication after autoclaving (CAU) did not lead to significant modifications in the swelling or sorption properties of the residues. However, when the ultrasonic treatment was followed by autoclaving (CUA), all the sorption properties were enhanced compared to the ultrasonication alone (CU). If compared with the autoclaving alone (CA), CUA showed increased WHC but lower WBC, indicating a more loose and porous structure with lower interaction with the water molecules (more hydrophobic). This agrees with the OBC and the swelling capacity of CUA being the highest among the analysed samples (Fig. 1).
Ultrasonication under the assayed conditions produced slight or no modifications in the composition and properties of the samples. The subsequent autoclaving increased some sorption properties and the TDF, NDF-PPA, and ADF.
When autoclaving was applied directly to cassava pulp (CA), the hydration properties were improved, especially the WBC. NDF-PPA and ADF were increased to a similar value to CUA, but the TDF was higher.
Autoclaving also provides immediate microbiological stabilisation by removing most of the extractable starch (substrate readily available for microbial fermentation) and eliminating the initial microbial load. Thus, CA and CAU were selected for further assays.
Table 2 shows the composition of the selected samples. Protein and ash are very low in C, and just mildly increased by autoclaving, being fibre and starch as the major components, as previously stated. NDF assayed on the residues pre-treated with heat-resistant α-amylase from Bacillus licheniformis (NDF-BL, 100 °C, 20 min), the same enzyme used in TDF determination, resulted lower than NDF-PPA and similar to TDF (Table 2). This result reinforces the evidence that starch is not being completely hydrolysed by pancreatic α-amylase after 20 min at 37 °C, while 20 min is enough when using α-amylase from Bacillus licheniformis (BL) at 100 °C. Thus, the hemicellulose content was calculated as the difference between NDF-BL (insoluble hemicellulose+lignocellulose) and ADF (lignocellulose). Hemicellulose was increased by the hydrothermal treatment, while ultrasound reduced it below the percentage present in C (Table 2). Lignocellulose (ADF) was raised by autoclaving and further increased by ultrasonication (Table 1).
Composition and resistant starch fractions of untreated and selected physically treated cassava pulp
| Sample | Protein (%) | Ash (%) | NDF-BL (%) | Hemicellulose (%) | Estimated RS (%) | RS (%) | RS milled (%) | RS milled and cooked: RS3 (%) | RS1 (%) | RS2 (%) | RS (% of total starch) |
|---|---|---|---|---|---|---|---|---|---|---|---|
| C | 0.60 ± 0.04a | 0.75 ± 0.08a | 8.5 ± 2.1a | 4.1 | 4.7 | 7.4 ± 0.3bB | 10.4 ± 0.4cC | 0.9 ± 0.3aA | NC | 9.5 | 12.7 |
| CA | 0.70 ± 0.00ab | 1.13 ± 0.01b | 20.0 ± 3.2c | 12.2 | 22.0 | 3.1 ± 0.1aB | 2.0 ± 0.4aA | 2.2 ± 0.1bA | 1.1 | - | 5.1 |
| CAU | 0.84 ± 0.04b | 1.32 ± 0.05b | 12.7 ± 1.3b | 3.6 | 33.8 | 39.9 ± 3.7cC | 9.5 ± 1.3bB | 1.1 ± 0.4aA | 30.4 | 8.4 | 60.1 |
Note: Results are expressed as mean ± SD db. Hemicellulose: calculated as the difference between NDF-BL and ADF from Table 1. Estimated RS: calculated as the difference between NDF-PPA from Table 1 and NDF-BL. Lowercase letters indicate significant differences within a column (P < 0.05). Uppercase letters indicate significant differences within a row (P < 0.05).
Abbreviations: NC, not calculated; NDF-BL, neutral detergent fibre of the sample pre-treated with α-amylase from Bacillus licheniformis; RS, RS milled, and RS milled and cooked, resistant starch of the original sample (<1 mm), the sample milled (<0.2 mm), and the sample milled and cooked, respectively; RS1, RS2 and RS3, resistant starch type I, II and III, respectively.
The amounts of total resistant starch estimated by the difference between NDF-PPA (Table 1) and NDF-BL (Table 2) were in the order of those determined using the assay kit for resistant starch in C and CAU, but CA differed considerably (Table 2). Therefore, the low starch digestion rate in NDF-PPA of CA is due to a hindered enzyme activity at 37°, for which 20 min is not enough to hydrolyse all the digestible starch. This observation was confirmed when the digestion of CA with PPA at 37 °C, prior to NDF determination, was extended to 16 h and the value of NDF-PPA dropped to 13.5 ± 1.4%, indicating that starch digestion is taking place but slower. SDF, which was increased in CA, has been related to the retardation of starch hydrolysis by interacting with the digestive enzymes and reducing glucose diffusion (Zhu et al., 2022). Among the insoluble fractions, hemicellulose (highest in CA) was reported to effectively reduce the digestibility rate of rice starch (Sun et al., 2019).
As observed in Table 2, cassava pulp shows relatively low amount of resistant starch (RS), mainly composed of RS2: naturally occurring non-digestible starch in products uncooked or cooked with limited amount of water (Li et al., 2019). RS1 could not be calculated in C because milling, which is expected to reduce the amount of resistant starch by releasing the encapsulated granules (RS1), conversely increased it. One hypothesis is that breaking the fibrous particles, besides releasing starch granules, also removed some components of the cell wall that may interact with the starch granules and/or the digestive enzymes reducing the starch digestion rate.
After autoclaving most of the remaining starch is encapsulated, having been gelatinised and partially retrograded inside the fibre. Onyago et al. (2006) found that RS3 of cassava starch autoclaved at 121 °C for 1 h and incubated at 60 °C for 24 h was significantly increased from 0.44 to 6.04 g/100 g, with 15 min of autoclaving being enough to produce this increment. In the present work, 15 min of autoclaving and drying in a vacuum oven at 70° C increased the amount of RS3 in CA, in a lower proportion than that reported by Onyago et al. (2006), while total resistant starch was significantly reduced (P < 0.05), representing a 5.1% of the total starch (Table 2).
Ultrasonication following the autoclave treatment (CAU) dramatically increased the resistant starch content (P < 0.05), which represented 50.9% of the total starch (Table 3). Ultrasound raised the RS2 to a value similar to that of C but mainly increased the RS1, indicating that a large proportion of the starch present is encapsulated and inaccessible to pancreatic α-amylase. This suggests that the solubilisation of cell wall components leaves the fibre mesh more closed or the starch granules interacting more tightly with the fibre.
Starch solubilisation at different temperatures was also modified by the applied treatments. As observed in Fig. 2, sample C, in which extractable starch is the majority, shows the lowest solubility at the three temperatures assayed. The solubility was below 1% at 25 °C and increased with temperature, remaining almost constant when the temperature rose above the gelatinisation temperature of native starch (68 °C). These results indicate that, at 68 °C, gelatinisation has occurred in C. However, above the gelatinisation temperature, the percentage of starch solubilised is considerably lower than the extractable starch, indicating that the leached amylose chains are interacting with the fibrous particles. Autoclaving increased starch solubilisation, as reported by Raungrusmee & Anal (2019) for rice starch. This was more notorious at higher temperatures, showing a pronounced increment from 68 to 90 °C (Fig. 2). Considering that autoclaving removed most of the external starch, this increment could be related to a more open fibre structure at a higher temperature. This agrees with the higher rate of hydrolysis obtained with the thermostable bacterial α-amylase, than with the pancreatic one, since at higher temperature not only the glucose diffusion is higher, but also the entrapped starch granules swell, opening the fibre structure (Li et al., 2021) and facilitating the diffusion of the enzyme onto the granule's surface (Moore et al., 2015).
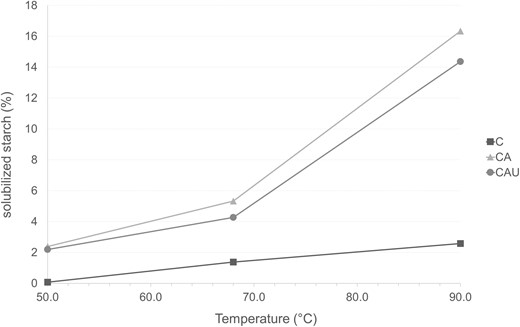
Percentage of solubilised to total starch. Datapoints of different samples at each temperature resulted significantly different (P < 0.05), and error bars are hidden behind the markers.
Ultrasound decreased starch solubility to an intermediate value between C and CA, showing similar dependence with temperature to CA. This is consistent with the more tightly encapsulated starch granules, which produced increased RS1.
The thermogravimetric analysis (Fig. 3) revealed water loss around 100 °C and a main thermal event between 250 and 375 °C, with similar peak temperature among samples. Peak temperature was also similar to that of the degradation of native cassava starch (Fig. 3b), but can be overlapping that of cellulose, hemicellulose and lignin in the samples (Yang et al., 2007). The maximum rate of mass loss (peak height in the DTG graph, Fig. 3b) was significantly lower for CA and CAU (P < 0.05) with no significant difference between them (p > 0.05). Total mass loss was also similar between both samples. A greater interaction of the starch with the fibre would be expected to modify the thermal stability of the matrix; thus, these results suggest that the lower solubilisation of starch in CAU is due to a more closed fibre network.
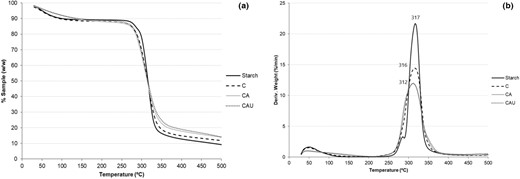
(a) Thermogravimetric curves of the samples and native cassava starch. (b) Derivative of the thermogravimetric curves.
Conclusions
The starch in cassava pulp is mostly extractable starch, with a resistant fraction of 7.4%, mainly composed of RS2. Ultrasonication did not considerably change the extractable starch content, while autoclaving reduced it by 82.5%. Besides removing the microbial load from the residue, autoclaving also increased the TDF, hydration properties and swelling. Resistant starch was reduced, but the hydrolysis rate of the digestible fraction at 37 °C was lower. Autoclaving also increased starch solubilisation with a more noticeable effect at higher temperature. The ultrasonication following the autoclaving did not change the sorption properties or the TDF, but the total resistant starch dramatically increased, mainly composed of encapsulated starch (RS1). The fibre matrix becomes more closed, reflected not only in higher resistance to digestive enzymes but also in a lower solubility of the starch compared to the autoclaving alone.
The combination of autoclaving followed by ultrasonication provides a less digestible fibrous residue with improved hydration properties.
Acknowledgments
This work was supported by projects PICT-2019-2827, PICT-2019-2867 and PICT-2020-SERIEA-01008.
Author contributions
Karen Nataly Nataly Strack: Data curation (lead); investigation (lead); methodology (equal); writing – review and editing (equal). María Alejandra García: Conceptualization (supporting); funding acquisition (equal); methodology (supporting); project administration (equal); resources (equal); writing – review and editing (equal). Darío Marcelino Cabezas: Data curation (equal); funding acquisition (equal); resources (equal); writing – review and editing (equal). Sonia Zulma Viña: Conceptualization (lead); formal analysis (equal); funding acquisition (equal); methodology (equal); project administration (equal); resources (equal); writing – review and editing (lead). Cecilia Dini: Conceptualization (lead); formal analysis (lead); funding acquisition (equal); methodology (equal); project administration (equal); writing – original draft (lead).
Conflict of interest
The authors declared no conflict of interest.
Ethics approval
Ethics approval was not required for this research.
Peer review
The peer review history for this article is available at https://publons.com/publon/10.1111/ijfs.16212.
Data availability statement
Data available on request from the authors.
References
The authors have summarized the current knowledge about how cell wall porosity restricts enzyme access in a size-dependent manner and can regulate the extent of macronutrient digestion and fermentation, mainly focused on starch.
In this study, the effect of autoclaving time in the formation of type III resistant starch from native cassava starch was evaluated, with and without the presence of lactic acid, and showed that autoclaving starch in water for 15 min was enough to increase the amount of retrograded starch.
This work provides insights into the effect of physical treatments (autoclaving and ultrasonication) on the structure, hydration, and gelling properties of cassava bagasse.
Sun et al. studied how hemicellulose, the primary cell wall component of rice endosperm, reduces in vitro rice starch digestibility. It was found that endogenous hemicellulose slowed starch digestibility by interacting with amylose and amylopectin (particularly the long-chain ones).
