


Abstract
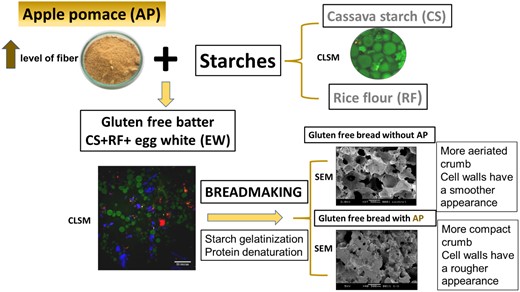
Apple pomace (AP) is the by-product obtained after juice extraction. It is a potential ingredient for the fibre enrichment of foods. In the present work, AP was combined in gluten free-mixtures with cassava starch (CS), rice flour (RF), egg white (EW) and sucrose (SR) to analyse its effect on thermal transitions of starch and the batter and bread crumb microstructures. Model systems with all or part of the main ingredients (CS:RF:AP:EW:SR in 4:4:1:1:1 proportions) and a batter formulation with AP were prepared by dry mixing and then dispersing the solids in water. CLSM allowed observing the distribution of egg proteins, AP and RF particles and CS granules. The batter enriched with AP exhibited higher apparent viscosities and dilatant behaviour. Thermal transitions were analysed by DSC. Endotherms ranged between 57 and 97°C. Gluten-free bread microstructure was analysed by SEM. A more irregular and compact crumb structure was observed when AP was used, with the air cell walls constituted by gelatinized starch granules and AP particles interpenetrating them. By measuring the firmness of crumb along storage, it could be concluded that amylopectin retrogradation was partially inhibited by the presence of AP in model systems but in bread, this inhibiting effect was not evident.
Introduction
Dietary fibre (DF) is a functional component of natural or processed foods that are composed of non-digestible polysaccharides and lignin. An adequate intake of DF is recommended in order to prevent certain chronic illnesses such as gastrointestinal disorders, obesity and cardiovascular diseases (O'Keefe, 2019; Ioniță-Mîndrican et al., 2022). With respect to colon cancer prevention, epidemiologic studies that compare colorectal cancer incidence among countries with estimates of national dietary fibre consumption suggest that DF may protect against colon cancer though more evidence is needed to establish definite conclusions. Zeng et al. (2020) demonstrated that the anticancer property of DF is related to increased production of short-chain fatty acids (SCFAs), that is acetate, propionate and butyrate, during DF fermentation in the colon. These authors demonstrated an inhibitory potential on cell proliferation, mainly by butyrate. Through a pooled analysis of nine studies, Hidaka et al. (2020) demonstrated that high DF intake exhibited a negative association with colorectal cancer risk for cases consistent with the traditional adenoma-colorectal cancer pathway.
The official recommendations concerning fibre intake vary according to the country or region and are given per day, on a basis of a 2000 kcal diet, for example 28 g dietary fibre per 2000 kcal in the United States (28 g/d), 25 g/d in the European Union, 25 g/d in Mexico, 40 g per 2000 kcal in India and 18–38 g/d in South Africa (Miller, 2020). As it is well known, whole grains, vegetables and fruits regularly consumed as part of a balanced diet can provide an adequate intake of DF. However, occidental diets are frequently based on refined flour and processed foods and are usually deficient in fibre. Thus, an increase in the consumption of fibre-rich foods is advisable.
Paradoxically, every year, millions of tons of bagasse, the remnant from processing of different fruits are obtained worldwide, particularly as by-products of the juice and wine industry and this trend is growing due to increased production. For the most part, due to the lack of sustainable management, these remnants are wasted, causing a negative environmental impact as well as social and economic damage. As an alternative to their disposal, these by-products have been traditionally used as feed for livestock, for composting or as sources of energy (biogas, bioethanol or bio-hydrogen) (Reguengo et al., 2021). However, these by-products have demonstrated a great potential to be included in the human diet, as sources of vitamins, minerals, fibre, oils and bioactive compounds with functional properties. During the last decade, a large number of investigations have shown that by-products are promising sources of high-value compounds with antioxidant and/or antimicrobial properties. As an example of the economic losses of valuable food ingredients, it is estimated that 7.15, 6.36 and 1.12 million metric tons of DF are wasted every year due to the disposal of orange pomace, apple pomace (AP) and grape pomace, respectively (Gómez-García et al., 2021; Iqbal et al., 2021). Besides, banana peel, other important by-products of banana consumption and processing, represents 36 million tons of waste every year (Zaini et al., 2022). From an economic point of view, the circular economy concept has been promoting suitable strategies to manage and valorise these by-products; these strategies would reduce pollution and promote sustainable bioeconomical growth (Gómez-García et al., 2021). From this point of view, knowledge about the composition and functionality of each by-product is quite necessary to optimise the use of each one of them.
Orange by-products (peels and seeds) are obtained from industrial citrus juices and are rich in fibre, essential oils, flavonoids and vitamins. They exhibit antioxidant, anti-inflammatory and antihypertensive effects. DF content ranges from 54.82% to 82.22%, protein content from 4.89% to 10.38% and mineral contents (as ashes) varies from 2.97% to 8.48% (Iqbal et al., 2021). Grape by-products (peels, seeds and remaining pulp) are obtained from the juice and wine industry; they contain varying profiles of phenolic compounds which depend on the type of grape and seeds are also an oil source (Reguengo et al., 2021). DF from red grape pomace ranges between 17.3% and 74.5%, its protein content varies between 5.4% and 14.17% and the mineral content (determined as ashes) ranges from 3.3% to 7.2% (Iqbal et al., 2021). Banana peel is a good source of DF (47%–53% dry basis, d.b.), minerals (9%–11% d.b., as ashes) and protein (5.5%–7.87% d.b.) (Zaini et al., 2022). It also exhibits antioxidant and antimicrobial activities (Hikal et al., 2022).
Apple pomace (AP) global production is estimated at an average of 4 million tons/year and is expected to increase in the future (Gołębiewska et al., 2022). This by-product consists of peel, flesh, stem, core, seeds and juice residues and the flour obtained from it stands out by its content of antioxidant components (total phenols content, 4.6–8.1 mg GAE g−1 and total flavonoids content, 18.6–34.6 mg QE g−1) and DF (35%–45%) (Gorjanović et al., 2020). Other authors have reported DF values in the range of 14.5%–42.5% (d.b.) (Lyu et al., 2020). Minerals, as determined by ashes range from 1.5% to 2.5% (d.b.) and include P, Ca, Mg and Fe among other elements (Lyu et al., 2020). Previous studies by other authors (Leyva-Corral et al., 2016; Barreira et al., 2019) have demonstrated that approximately 58% of phytochemicals (catechin, procyanidin, phloridzine, phloretin, glucosides and ferulic and caffeic acids) remain in the pomace during industrial apple processing. Thus, due to its high content of DF and other healthy components, AP can be, if adequately treated, a potential food ingredient and an interesting alternative source of fibre, particularly the insoluble one. As a complementary advantage, the processing and use of this bagasse as a food ingredient could also help to reduce the environmental impact that is a consequence of its waste.
Bread products and other foods based on starches or flours are appropriate matrices for fibre enrichment since they are commonly made with refined ingredients that contain low levels of fibre. This is particularly true in the case of gluten-free products. However, fibre addition implies that changes must be made in order to adapt formulations and processes and thus obtain an acceptable product. The presence of fibre can affect hydration properties, thermal properties and the rheology of dough or batters. In previous work, a response surface design was employed to analyse the effect of AP and water amounts on the quality of gluten-free bread obtained with cassava starch (CS), rice flour (RF) and egg white (EW) as a structuring agent (Rocha Parra et al., 2015a). It was observed that bread volume and crumb quality decreased when AP increased and water amount decreased. Besides, by RVA measurements, it was stated that AP affected the amylographic profile (both peak and final viscosities were decreased) in model systems composed of CS and rice flour (Rocha Parra et al., 2015b).
During the early stages of baking, increasing temperatures cause batter viscosity to decrease, gas cells to expand and fat crystals to melt. In the late baking phase, viscosity increases and the liquid batter is transformed into a solid foam and the structure sets. Batter viscosity is an important parameter defining bread quality. The batter viscosity should still be sufficient to minimise gas cell coalescence, bubble rise and to keep the dense starch granules suspended before gelatinization and egg proteins denaturation occurs (Wilderjans et al., 2013; Manik & Nur, 2021). Consequently, information about the relationship among thermal properties, microstructure and product quality could contribute to understand and predict the impact of adding fibre-rich ingredients into these complex systems (Arslan et al., 2019; Ma et al., 2021; Zhou et al., 2021).
The objective of this work was to analyse the influence of AP incorporation on batter microstructure, starch thermal transitions and bread staling of gluten-free bread formulation. Simplified model systems consisting of rice flour, CS, EW and sucrose (SR) were used to analyse the effect of adding AP into a complex gluten-free matrix in order to better understand the interactions among components.
Materials and methods
Materials
Rice flour (82% carbohydrate, 4.2% protein and 1.6% fibre, according to supplier's information) and CS (90% carbohydrate according to supplier's information) were provided by Kapac (Argentina) and were both gluten-free certified. Raw AP was gently provided by the juice producer company Jugos SA (Río Negro, Argentina) and processed as described in previous work (Rocha Parra et al., 2015a). Briefly, crude AP (85% moisture content) was dried at 50°C for 24 h employing a forced convection oven (GMX 9203A PEET LAB, USA). Solids were then ground and sieved through a 60 mesh (250 μm) to obtain a fine uniform powder that was sterilised (20 min at 121°C). The final composition of this powder was (on a 100 g basis) as follows: moisture 14.02 g, protein 4.28 g, ash 1.77 g, total dietary fibre (TDF) 41.04 g and carbohydrates different from fibre (calculated by difference): 38.89 g. Dehydrated EW was provided by Ovobrand (Argentina). Yeast (fresh), chemical leavening agent (CLA), SR and margarine (M) were obtained from the local market. Other reagents used in the assays were of analytical grade.
Methods
Samples
Model systems
Model systems were formulated with a proportion of main ingredients (CS, RF, AP, EW, SR) similar to that of batters for gluten-free bread. Thus, the following model systems were assayed (Table 1): CS + RF (containing only CS and RF in equal proportions), CS + RF with AP as fibre source (in a proportion of 4:4:1), CS + RF with EW as structuring agent (in a proportion of 4:4:1), a mixture of CS + RF + AP + EW (4:4:1:1) and a mixture including SR CS + RF + AP + EW + SR (4:4:1:1:1). These ingredients were dry mixed and the mixtures were dispersed in distilled water with stirring up to a final solids concentration of 50% (w/w).
Composition of the studied systems
| Model systems | Complete formulations | ||||||
|---|---|---|---|---|---|---|---|
| CS + RF (1:1)a | CS + RF + EW | CS + RF + AP | CS + RF+ AP + EW | CS + RF+ AP + EW + SR | Control | Fibre-rich | |
| (4:4:1) | (4:4:1) | (4:4:1:1) | (4:4:1:1:1) | (A) | (B) | ||
| CS | 50 | 40 | 40 | 40 | 40 | 45 | 45 |
| RF | 50 | 40 | 40 | 40 | 40 | 45 | 45 |
| EW | – | 10 | – | 10 | 10 | 10 | 10 |
| AP | – | – | 10 | 10 | 10 | – | 17.8 |
| SR | – | – | – | – | 10 | 10 | 10 |
| M | – | – | – | – | 2 | 2 | |
| SSL | – | – | – | – | 0.5 | 0.5 | |
| CLA | – | – | – | – | 0.1b | 0.1b | |
| Yeast | – | – | – | – | 2.7b | 2.7b | |
| Water | 100 | 90 | 90 | 100 | 110 | 100 | 120.1 |
Note: Proportions in weight are indicated between parentheses.
Abbreviations: AP, apple pomace; CLA, chemical-leavening agent; CS, cassava starch; EW, egg white; M, margarine; RF, rice flour; SR, sucrose; SSL, stearoyl sodium lactylate.
Proportions in weight.
Only added for breadmaking assays.
Gluten-free batter and bread
A high-fibre batter formulation of gluten-free bread obtained from previous work (Rocha Parra et al., 2015a) was selected and used as a reference for comparisons in the present work (Table 1). This formulation contained the ingredients mentioned above plus M, SSL and leavening agents. Besides, a formulation with the same proportions of CS and RF but without AP was used as a control batter (Table 1). Bread were obtained according to the breadmaking procedure reported by Rocha Parra et al. (2015a). A schema of this procedure is shown in Fig. 1.
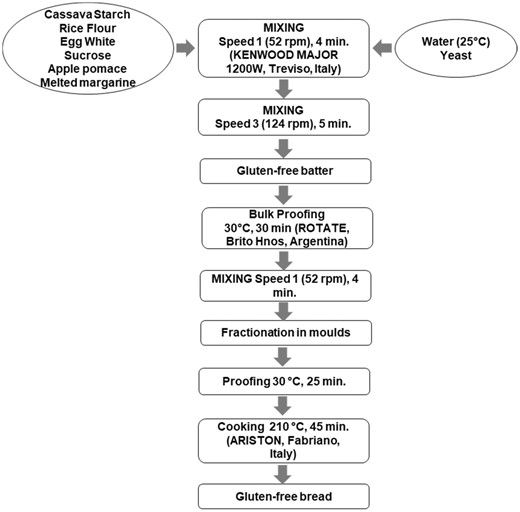
Batter preparation based on (Rocha Parra et al., 2015a).
Microscopy
Model systems and batters
The microstructure was analysed with confocal laser scanning microscopy (CLSM) through differential dying with fluorophores. An aliquot of each ingredient or mixture of ingredients in aqueous media was spread on a glass slide and dyed with solutions of rhodamine B (0.001%), fluorescein isothiocyanate (FITC; 0.01%) and calcofluor white (0.01%) in distilled water (Burbano et al., 2022). The samples were left to rest for 1 h within a closed dark recipient, and then the specimen was washed with distilled water and covered with a glass cover slip. An inverted microscope equipped with Ar and HeNe laser was used (LEICATCS SP5, Mannheim, Germany). The excitation wavelengths were 488 nm (FITC), 568 nm (rhodamine B) and 365 nm (calcofluor white) the emission wavelengths were 518 nm (FITC), 625 nm (rhodamine B) and 420 nm (calcofluor white). Micrographs were obtained at 40× and 4×.
Bread
For microscopy evaluation of porosity, a scanning electron microscope Jeol JSM-6360 LV (Jeol, Japan) was employed to obtain images of different fields with various magnifications. Small portions of crumb (2 mm diameter and 1 mm thick) were cut and stored in 2.5% glutaraldehyde solution v/v at 4°C. Dehydration of the samples was performed by washing them with consecutive solutions of acetone at increasing concentrations (0, 25, 50, 75 and 100% v/v). Samples were dried at the critical point and coated with gold particles, based on the procedure of Arp et al. (2018). Micrographs were obtained at 37×, 40× and 100×.
Batter viscosity
For measurements of batter viscosity, a rotational viscosimeter Fungilab Expert Series model RVT (FUNGILAB SA, Barcelona, Spain) was used. Sensors R6 and R7 were selected according to the system viscosity. Measurements were performed at room temperature (20°C) and apparent viscosity values were obtained as a function of the rotational speed (10–140 rpm). The tests were performed by duplicates.
Thermal properties by DSC
Gelatinization
Aliquots (approximately 10 mg) of each sample were weighed and hermetically sealed in aluminium pans. Heating was performed from 20 to 140°C in a DSC cell (Q100 TA Instruments, USA) at a heating rate of 10°C min−1 (Bigne et al., 2018). As a reference, an empty pan was used and calibration with Indium was performed. For each peak, onset (To), peak (Tp) and end (Te) temperatures and enthalpy values (J/g) were calculated. In all cases, when enthalpy was calculated with respect to total solids (including protein when present), it was considered a ‘global enthalpy’ that encompassed starch gelatinisation and protein denaturation. When it was possible to refer the calculated enthalpy to the present starch, it was considered gelatinisation enthalpy. Assays were performed at least by duplicates.
Retrogradation
Model systems
To simulate baking conditions, approximately 10 mg of each formulation were weighed and sealed in aluminium pans and a simulation of the oven cooking process was performed between 5 and 105°C (considering the maximum temperature attained by the crumb) at a heating rate of 10°C min−1. Pans containing the heated batters were stored at room temperature and 1, 3, 6 and 9 days, samples were reheated to evaluate amylopectin retrogradation. For this analysis, heating at 5°C min−1 between 5 and 140°C was conducted. From each thermogram, temperatures and retrogradation enthalpy were obtained, based on the procedure of Bigne et al. (2016). Assays were performed at least by duplicates.
Bread
To evaluate retrogradation, bread obtained by the cited breadmaking procedure (Rocha Parra et al., 2015a) were stored in plastic bags at room temperature and samples were tested at 1, 3, 6 and 9 days for evaluation of amylopectin retrogradation. Approximately 10 mg of crumb were weighed and sealed in aluminium pans and heated at 5°C min−1 between 5 and 140°C. From each thermogram, temperatures and retrogradation enthalpy were determined as described above. Assays were performed at least by duplicates.
Statistical analysis
Anova was applied to data and significant differences among means were determined using Tukey's HSD test with a confidence level of 95%. Statgraphics Centurion XV software was used.
Results and discussion
Microstructure of model systems and batter
Figure 2 shows the microstructure of individual ingredients and batter. A batter for gluten-free bread is a complex dispersed system where emulsifiers, proteins and/or hydrocolloids serve as structuring agents and help stabilise the air bubbles. It is well known the ability of EW proteins to stabilise foams by locating in the air–liquid interface (Mine, 1995). In Fig. 2a, it can be seen how EW (dyed with rhodamine B) is mainly located at the surface of the bubble as reddish spots. In the liquid phase of the raw batter, starch granules form a dispersion. In Fig. 2b, c, it can be appreciated (dyed in green by FITCI) the different sizes and shapes of CS and RF particles, these ones including rice starch granules. Fibre-rich particles that are naturally present in RF can be also observed (dyed in blue with calcofluor white) (Fig. 2c, d). The incorporation of AP introduces a significant additional amount of fibre-rich particles (dyed in blue) and proteinaceous materials (dyed in red with rhodamine B) (Fig. 2e, f). However, differently from the model system CS + RF + AP (Fig. 2e), batter with AP (Fig. 2f) was submitted to aeration during mixing and exhibits dark zones corresponding to the air bubbles. Accordingly, starch granules and AP particles are located within the liquid layers among bubbles, increasing the viscosity of the dispersing phase. Fibre-rich AP particles have even higher water imbibing capacity than native CS or RF (Rocha Parra et al., 2015b) and this could enhance the contribution of AP to the viscosity of the liquid layers. This fact as well as the presence of the EW proteins in the interface contributes to the stabilisation of the air cells in the batter. In the absence of gluten, these interactions and the changes occurring during thermal treatment are responsible for the structuring effect that renders a spongy crumb.
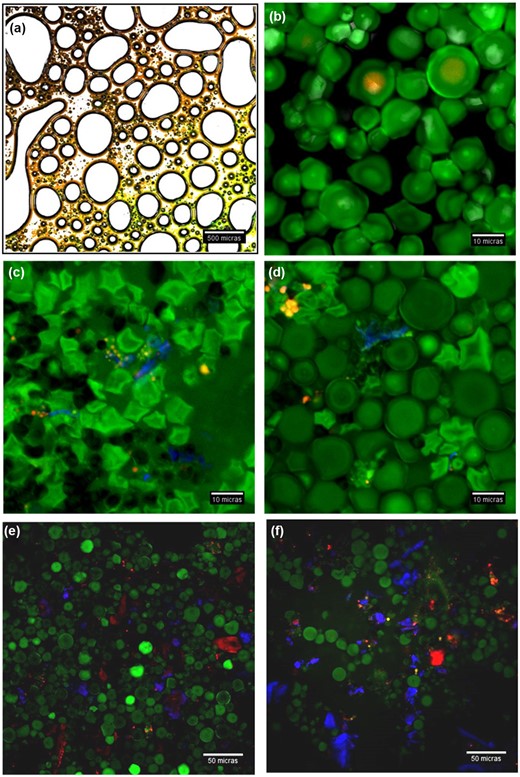
Micrographs of (a) EW batter (solids:water = 1:1) (4×); (b) CS (solids:water = 1:1) (40×, zoom 4); (c) RF (solids:water = 1:1) (40×, zoom 4); (d) CS + RF; (e) CS + RF + AP; (f) batter with AP (Table 1, formulation B) without yeast (40×). (a) dyed with FITC and rhodamine B; (b–f) dyed with FITC, rhodamine B and calcofluor white (solids: water = 1:1). CS, cassava starch; RF, rice flour; EW, egg white; AP, apple pomace.
To analyse more specifically the thickening effect of AP, apparent viscosities of batters without and with AP were measured at different rpm, and the curves are shown in Fig. 3. It is observed that the control batter exhibits much lower viscosities than the batter enriched with fibre, and the apparent viscosity remains almost constant at rotational speeds between 60 and 200 rpm (2.439–2.325 Pa.s). On the other hand, the batter with AP presents much higher viscosities and the dispersion exhibits dilatancy; values between 60 and 140 rpm were 15.332 and 26.055 Pa.s, respectively. It was not possible the measurement above 140 rpm because of the increased viscosity of the system. Dilatant behaviour is typical of concentrated dispersed systems that have an ordered arrangement at zero or low shear rates but become disordered when shear rates increase above a critical point. Above this point, the shear forces overcome the repulsive particle–particle interactions, and this leads to the disordering of the arrangement of particles, causing an increase in viscosity (Boersma et al., 1990). Consequently, the presence of high levels of fibre can represent a stabilising factor through the increase in the viscosity of the aqueous phase.
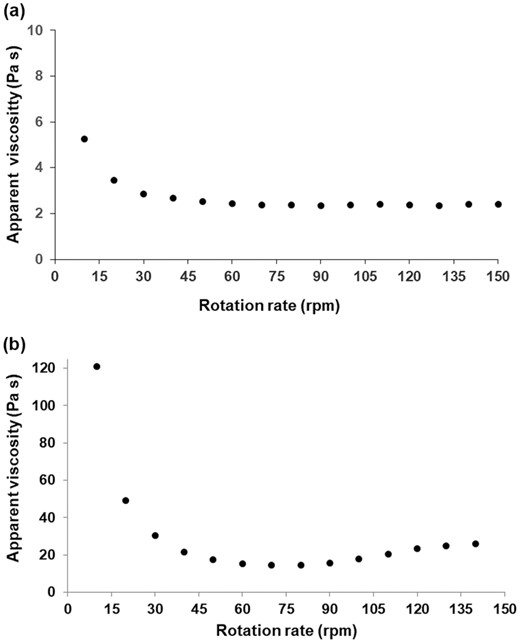
Apparent viscosity (Pa s) of control batter (a) and rich-fibre batter (b) as a function of rotational rate.
Thermal transitions in model systems and batter
When batters are submitted to leavening and subsequent heat treatment for making bread, a spongy aerated structure is obtained. For a better understanding of the interactions among components that lead to an aerated crumb in a gluten-free matrix, calorimetric assays in simplified model systems were performed.
In Table 2, the calorimetric parameters for each individual ingredient (CS, RF and EW) are shown, for a solids:water ratio equal to 1:1. AP did not exhibit any endothermic change in the studied range (data not shown). The respective endotherms are shown in Fig. 4 (curves a, b and c) and they can be assigned to starch gelatinisation in the case of CS or RF and protein denaturation in EW systems. It can be observed that the gelatinisation temperature ranges corresponding to the starchy ingredients are almost overlapping (59.79–95.33°C for CS and 61.00–91.78°C for RF). In the case of the CS + RF mixture, only one endotherm was obtained in the range from 56.83 to 93.23°C (thermogram not shown); the observation of a unique endotherm suggests the co-gelatinization process of both starches (Karam et al., 2006). In the case of EW protein denaturation, this transition begins later than starch gelatinisation (Ti = 72°C) but extends up to almost the same temperature (Te = 94.81°C), that is the endotherm is narrower, thus implying that the denaturation process is more cooperative than gelatiniation one. It has been reported that EW has two endothermic peaks, at 72 and 85.4°C corresponding to the denaturation of conalbumin + lisozime and ovoalbumin, respectively (Kobylañski et al., 2004). Ibanoglu & Erçelebi (2007) have reported somewhat inferior temperatures (68.5 and 84.1°C). In the present work, only one peak was detected, at 82.46°C which would correspond to the more stable protein, ovoalbumin. The more thermolabile proteins were probably denatured during the industrial dehydration process. Starch gelatinization in the presence of a structuring agent like EW (that denatures within a similar range of temperatures) is responsible for the production of a sponge similar to crumb in gluten-free bread.
Thermal parameters obtained by DSC for the basic ingredients at a solid:water ratio (S:W) = 1:1
| Sample | S:W | To(°C) | T p (°C) | Te (°C) | ΔH (J/g) |
|---|---|---|---|---|---|
| CS | 1:1 | 59.79 ± 0.02a | 70.37 ± 0.03b | 95.33 ± 4.91a | 13.13 ± 0.46b |
| RF | 1:1 | 61.00 ± 0.19a | 67.85 ± 0.15a | 91.78 ± 0.97a | 9.03 ± 1.30a |
| EW | 1:1 | 72.18 ± 0.53b | 82.46 ± 0.19c | 94.81 ± 0.52a | 6.56 ± 0.06a |
Note: Different superscripts on values within the same column indicate significant differences (P < 0.05).
Abbreviations: CS, cassava starch; EW, egg white; RF, rice flour; Te, gelatinization end temperature; To, gelatinization onset temperature; Tp, gelatinization peak temperature; ΔH, gelatinization enthalpy.
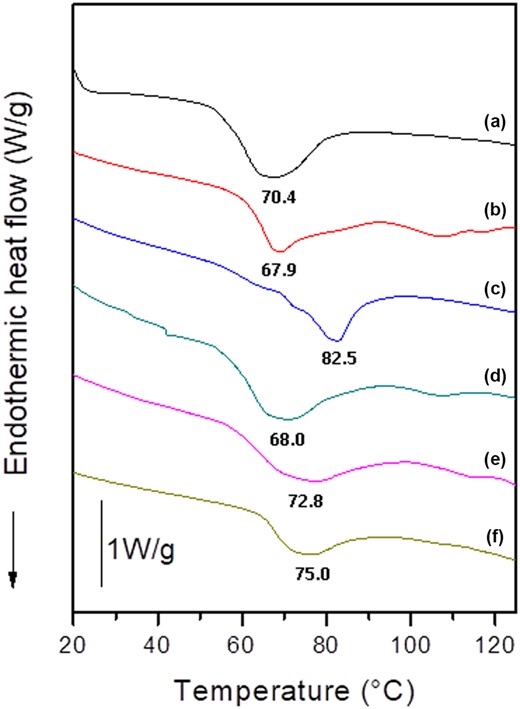
Typical thermograms and mean peak temperatures of different model systems and individual components at a solids/water ratio close to 1:1. Curves: (a) CS, (b) RF, (c) EW, (d) CS + RF + AP, (e) CS + RF + AP + EW, f) CS + RF + AP + EW + SR. CS, cassava starch; RF, rice flour; EW, egg white; AP, apple pomace; SR, sucrose.
In Table 3, the effect of the addition of AP and/or EW on the starch transition in the CS + RF system is shown. The initial and final temperatures of the transition were not significantly (P > 0.05) modified by the addition of EW or AP. However, a tendency to higher initial and peak temperatures was evident when EW was present, due to the contribution of protein denaturation, which begins at higher temperatures. The thermal interchange (global enthalpy) is the result of starch gelatinisation plus protein denaturation and no significant differences were found among samples. The endotherm of the CS + RF mixture was not substantially altered by the addition of AP (Fig. 4, curve d). Fibre has been reported to increase gelatinization temperatures when it is added at high concentrations (Santos et al., 2008). These authors reported that the higher the fibre concentration in a hydrated flour-fibre blend (they explored the range 3.6–17.4 g fibre/100 g), the higher the initial and peak temperatures but the lower the conclusion temperature and ΔH. They attributed the delayed gelatinisation of starch granules to the presence of dietary fibres that absorbed water, reducing the effective water concentration. In the case of the present work, the assayed fibre levels were lower. Since AP contained 41% DF, DF ranged from 1.84 to 2.87 g/100 g hydrated blend. It was concluded that these levels would not be high enough to produce a significant shift to higher gelatinisation values. However, the combined addition of EW plus AP led, as expected, to a broadening of the gelatinisation range (40°C) (Fig. 4, curve e).
Thermal properties of model systems and batter with AP
| Formulation | Solids:water | To (°C) | Tp (°C) | Te (°C) | Global ΔH (J/g)a | ΔHgb (J/g) |
|---|---|---|---|---|---|---|
| CS + RF | 1:1 | 56.83 ± 0.40a | 66.23 ± 1.39a | 93.23 ± 0.51a | 14.14 ± 0.52b | 14.73 ± 0.55a |
| CS + RF + EW | 1:1 | 59.43 ± 0.23bc | 69.91 ± 1.00bc | 93.32 ± 2.48a | 14.26 ± 0.75b | nd |
| CS+ RF + AP | 1:1 | 57.77 ± 0.95ab | 67.96 ± 0.76ab | 94.34 ± 2.07a | 11.98 ± 2.90ab | 14.09 ± 3.41a |
| CS + RF + AP + EW | 1:1 | 57.32 ± 0.25ab | 72.84 ± 0.88cd | 97.19 ± 1.05a | 11.67 ± 1.20ab | nd |
| CS + RF + AP + EW + SR | 1:1 | 61.48 ± 0.83c | 75.05 ± 0.30d | 96.52 ± 3.34a | 8.79 ± 1.49a | nd |
| Fibre-rich batter | 0.9:1 | 65.47 ± 0.86d | 73.70 ± 0.18d | 91.98 ± 3.35a | 9.33 ± 0.52a | nd |
Note: Different superscripts on values within the same column indicate significant differences (P < 0.05).
Abbreviations: AP, apple pomace; CS, cassava starch; EW, egg white; RF, rice flour; SR, sucrose; Te, gelatinization end temperature; To, gelatinization onset temperature; Tp, gelatinization peak temperature; ΔHg, gelatinization enthalpy.
Global enthalpy involves all the simultaneously occurring transitions.
Gelatinization enthalpy, only determined when EW was absent, on starch basis components ratio (see Table 1).
In a previous study, it was demonstrated that the addition of SR alone or with hydrocolloids not only alters the gelatinisation kinetics but also the final size of the hydrated granule (Krüger et al., 2003). In the present work, the addition of SR (Fig. 4, curve f) significantly raised the initial gelatinisation temperature compared to the blend of CS + RF + AP + EW without SR, the peak temperature showed a trend to higher values but the end temperature was not significantly altered. Similar results were shown by Teobaldi et al. (2021), who found that DSC endotherms showed higher enthalpy and shifts to higher gelatinisation temperatures and narrower endotherms when SR was incorporated. The effect of SR was proposed to be based on the competition for water with starch granules at the first stages of the gelatinisation process. In spite of the small differences in ingredients proportions and the presence of more components, the fibre-rich batter showed similar behaviour to the model system CS + RF + AP + EW + SR; however, the initial temperatures were higher and final temperatures were lower, indicating a more cooperative transition.
Effect of apple pomace addition on the final product
Microstructure of bread crumb
In Fig. 5, the microstructure of the crumb obtained with the two batter formulations A and B (Table 1) is shown. Air cell walls in the formulation without fibre (Fig. 5a, b) have a uniform and smooth appearance and cells exhibit rounded shapes. When AP is incorporated (Fig. 5c, d), the cell walls have a rougher appearance, and air cells have a more irregular form which is related to restrictions and difficulty to expand during leavening. Crumbs are also more compact in this case. The addition of ingredients rich in fibre, such as AP particles, can lead to an increase in compactness as reported by Polaki et al. (2010) who used whole oat flour as a baking ingredient in wheat composite bread. In gluten-free bread, this compactness is even more enhanced since the structuring effect of gluten proteins cannot be completely substituted by EW proteins, thus leading to a denser matrix. This fact turns even more critical than the effect of the addition of fibre. In a previous work (Rocha Parra et al., 2015a), it was reported that the specific volume and texture attributes (such as hardness, resilience and cohesiveness) of gluten-free bread with AP were dependent on both the level of AP and water. A high amount of AP in systems with water restriction led to higher viscosity batters, as seen in Fig. 3, and restricted expansion during leavening thus rendering lower volumes and more compact and harder crumbs. Other authors have reported similar trends when adding AP to gluten-free formulations and have pointed out that in addition to its effect on viscosity, fibre content would alter the specific volume because of its high water-binding capacity, which leads to limited fermentation and gas production (Cantero et al., 2022). It is necessary to note that the hardness of a spongy breadcrumb is the result of two contributions: the hardness of cell walls and the relative density of the crumb (Attenburrow et al., 1989; Zghal et al., 2002). In the case of the present work, the cell walls would be strengthened by the insertion of fibre-rich AP particles, and the relative density of crumb is increased by the lesser volume thus leading to harder bread.
![Micrographs of the crumb of control bread [without apple pomace (AP)] (37×, a) (100×, b); bread with higher AP (40×, c) (100×, d). The images b and d are the magnification of the green box of the respective images a and c.](https://oup.silverchair-cdn.com/oup/backfile/Content_public/Journal/ijfst/58/9/10.1111_ijfs.16194/1/m_ijfs16194-fig-0005-m.jpeg?Expires=1750232901&Signature=fH7~4cy0bUrjuQVT2uicBAJMRtik-stqiGH13i85iTDr0Co4J12QXHwy8WQ9mRFH--CSXSuGUuAR4aU6qmmwS5OCB0Q461jL9Id52vIX7LUqJGZM6rbkVMpN0e86AuDc4pSLLGrdBp1iN0rqYMOwnR59Fla0be5ARUJtAjbRAgHDTeMEUIbEqes5DfzRIi-0LvBGVw6UZEp955OyzkyrBVNikppm~jzJXWcx-Br4sC3Ii5BS~qsDJ4EuincvxQEaNUu6lXxbqJL4WQgBVztjxi6xEgJhhWRIP33opU1BftC3gcr0AB6I7IH7f~WTzGNAiEHlV1uLlBfNqnoT4t8~cw__&Key-Pair-Id=APKAIE5G5CRDK6RD3PGA)
Micrographs of the crumb of control bread [without apple pomace (AP)] (37×, a) (100×, b); bread with higher AP (40×, c) (100×, d). The images b and d are the magnification of the green box of the respective images a and c.
Retrogradation in model systems and bread
Retrogradation is a complex phenomenon that depends on several factors: interactions among components, water content and distribution and crumb porosity (Fadda et al., 2014). The effect of AP on starch retrogradation was studied on model systems without AP and with the addition of AP. Besides, retrogradation was also analysed in control bread and bread with AP, obtained from formulations A and B (Table 1). In all these cases, the endotherm obtained in the thermograms was assigned to the fusion of amylopectin crystals formed by retrogradation and enthalpy values could be obtained on the starch basis, since there is no superposition with other thermal events. Temperatures corresponding to the fusion of amylopectin crystals formed during retrogradation showed a tendency to increase with storage time (data not shown); for the fibre-rich product (formulation B), the retrogradation endotherm ranged between 45 and 75.5°C after a day of storage but after 9 days, the range shifted to 48.7–77.7 °C. This temperature increase is related to the formation of more stable crystals.
In Fig. 6 the variation of retrogradation enthalpies along time is shown. The presence of AP in gelatinised model systems seems to inhibit at least partially the amylopectin retrogradation, but this tendency is not observed in bread crumbs except for the first day of storage. The presence of other ingredients and the lack of uniformity in the cell walls are factors that could affect the performance of the fibre in a real matrix. In the previous work, it was reported that the crumb hardness increased during storage and this increase was significantly higher when AP was present (Rocha Parra et al., 2015a). Hardness increase during storage is related mainly to water migration (from crumb to crust) or evaporation and starch retrogradation. From the previous discussion about microstructure, it is evident that the gelatinised starch granules and RF proteins can interact with AP particles and EW within the cell walls in the crumb. Amylopectin retrogradation (occurring inside the granule) hardens the granule remnants and so, the matrix. Fibre could contribute to different water distribution and higher water retention, leading to the increased retrogradation observed at 9 days of storage.
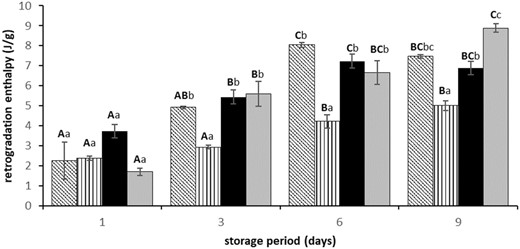
Retrogradation enthalpy (J/g starch) as a function of the days of storage for CS + RF (oblique strips), CS + RF + AP (4:4:1) (vertical strips), control bread without fibre – formulation A (black) and bread with AP – formulation B (high fibre) (grey). Different capital letters indicate significant differences (P < 0.05) within the same system during the storage period. Lowercase letters compare differences in systems within the same storage time. CS, cassava starch; RF, rice flour; AP, apple pomace.
In the literature, there are no conclusive reports with respect to the fibre effect on amylopectin retrogradation. Santos et al. (2008) tested several types of fibre (soluble as inulin, partially soluble as sugar beet and pea cell wall and insoluble like pea hull) in the formulation of high fibre wheat flour blends systems (9.7–17.4 g fibre/100 g of hydrated flour-fibre blends). These authors found that, in general, all the mixtures with fibre exhibited lower and slower amylopectin retrogradation with the most marked effect for sugar beet fibre. Other authors (Curti et al., 2015) have reported an enlargement of amylopectin retrogradation in the presence of bran fractions in wheat bread. Nevertheless, according to the results of Purhagen et al. (2012), oat bran provided similar or better results than the control for all staling parameters, while other additives (fine durum, rye bran and wheat bran) gave no general improvements. The diversity of these results is probably related to the fibre composition and other physicochemical properties such as solubility, particle size (in the case of insoluble fibres) and the ability of interacting with other components. These characteristics would influence both water distribution and mobility (dependent on water binding to other hydrophilic components) which are fundamental parameters in diffusion-dependent processes such as retrogradation.
Conclusions
Apple pomace is one of the most abundant wastes from the fruit industries; it is the by-product of apple juice and cider production, among others. It has been demonstrated that when adequately treated (dried, ground), AP can be a suitable source of fibre for breadmaking products. Particularly, gluten-free bread functionality can be much improved since they are usually fibre deficient because they are formulated with refined starchy ingredients (RF, CS). Apple pomace not only enriches with fibre the gluten-free product but also contributes with minerals and aromatic components that help improve the sensory profile of bread. From a technical point of view, AP exerted a thickening effect on the batter and a hardening effect on the crumb. These two facts were related since, as AP particles were located in the liquid layers surrounding bubbles in batters, after gelatinization, they resulted well integrated into cell walls in the crumb. Moreover, the presence of AP did not substantially alter the gelatinization parameters of the studied systems, the fact that could represent an advantage in bread manufacture. With respect to retrogradation, though AP seems to exert a significant inhibiting effect on amylopectin retrogradation in model systems, the same trend was not evident in the complete formulation probably because of the dissimilar processing history and final distribution of components in the real matrix. From a technological point of view, understanding the main facts concerning the incorporation of AP as a food ingredient can contribute to facilitate its employment and to expanding the types of foods where it can be incorporated.
Acknowledgements
The authors would like to acknowledge Universidad Nacional de La Plata (Argentina), Universidad Nacional de Cordoba (Argentina) and CONICET for the financial support and to the Company JUGOS SA (Río Negro, Argentina) for apple pomace donation.
Author contributions
Andrés Felipe Rocha Parra: Conceptualization (equal); data curation (equal); formal analysis (equal); investigation (equal); methodology (equal); writing – original draft (equal); writing – review and editing (equal). Gabriela Noel Barrera: Data curation (equal); formal analysis (equal); investigation (equal); writing – original draft (equal). Pablo Daniel Ribotta: Conceptualization (equal); funding acquisition (equal); methodology (equal); project administration (equal); supervision (equal); visualization (equal); writing – original draft (equal). Cristina Ferrero: Conceptualization (equal); formal analysis (equal); funding acquisition (equal); project administration (equal); resources (equal); supervision (equal); visualization (equal); writing – original draft (equal); writing – review and editing (equal).
Ethical guidelines
Ethics approval was not required for this research.
Peer review
The peer review history for this article is available at https://publons.com/publon/10.1111/ijfs.16194.
Data availability statement
The data that support the findings of this study are available from the corresponding author upon reasonable request.
References
This reference enumerates the nutritional losses involved when by-products of the fruit industry are wasted. These data give the support to the objective of converting pomaces in valuable food ingredients, source of fiber, minerals, and bioactive compounds.
This work contains several examples of the thermal behavior of starchy mixtures. It has contributed to the interpretation of the endotherms obtained by Differential Scanning Calorimetry in a complex system such as the batter for obtaining gluten-free breads.
This work has contributed to elucidate the thermal behavior of one of the main structuring components used in gluten-free beads, i.e. egg white. The absence of gluten makes critical the function of this component and the changes produced during the heating stage in the oven.
This research allowed stating the main technological effects of adding apple pomace in a gluten- free formulation. From these results, questions about the interactions among components and the thermal behavior of the systems arised and promoted the present research.
This study contributes to the interpretation of the mechanical properties of crumb on the basis of the global crumb density and the cell wall density. Thus, the effect of the different ingredients on a very important attribute of bread such as hardness can be related to the crumb structure.
