


Abstract
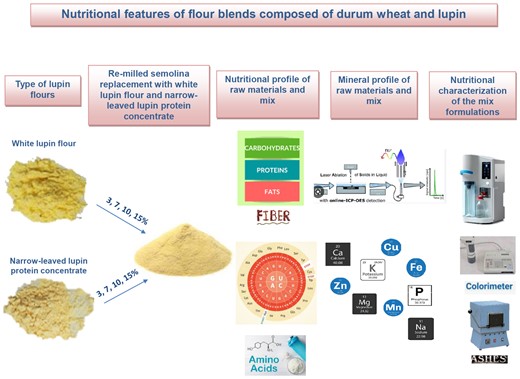
This study aims to improve the nutritional characteristics of durum wheat re-milled semolina by adding 3%, 7%, 10% and 15% lupin flour (Lupinus albus L.) (L For lupin protein concentrate (LPC) (Lupinus angustifolius L.). Lupin flour showed a high protein content (40.05 g/100 g), which further increased to 55.00 g/100 g in the protein concentrate. Compared to re-milled semolina, the protein content of the flour blends significantly increased for additions of LPC ≥ 3% and LF ≥ 7%. The lysine score significantly increased at levels of addition of LF or LPC ≥ 7%. The addition of LF at levels ≥ 3% determined an increase of manganese and iron, while copper and zinc increased at addition levels ≥ 10%. The macroelements significantly increased with the addition of LF (at levels ≥ 3% for magnesium; ≥10% for potassium and calcium; ≥15% for phosphorous) and LPC (at levels ≥ 3% for potassium and magnesium and ≥10% for calcium). The obtained flour mixes are potentially suitable for the formulation of biofortified and functional foods.
Introduction
During the last few years, functional foods have gained attention from the food industry and consumers because of their potential role in the maintenance of health and well-being. The use of pulse flour, alone or mixed with wheat flour, in the production of pasta, biscuits and bread substitutes has particularly increased in recent years (Costantini et al., 2021; Spina, 2020; Pasqualone et al., 2019). The addition of pulse flours represents a promising strategy to improve the nutritional and nutraceutical value of food (Ficco et al., 2018).
In particular, lupins have recently gained considerable interest for their good nutritional and technological value (Spina et al., 2022), thanks to their high content of proteins (30%–45%) and soluble and insoluble dietary fibres (14%–16%), coupled with very low starch content (0.7%–2.2%) (Sirtori et al., 2010), good quality lipids (10%–12%) and high lysine amino acid content. Recent clinical investigations have indicated that the consumption of lupins may be beneficial due to their hypocholesterolaemic effect (Sirtori et al., 2004). Lupins are also capable of lowering the glycaemic index due to relatively low starch content combined with the presence of the γ-conglutin, an insulin-mimetic protein (Spina, 2020).
Lupin seeds are a good source of minerals, such as potassium, calcium, phosphorus and iron, among others (Ruiz-López et al., 2019). The mineral micronutrients are essential for both plant and human health. Specifically, iron plays a fundamental role in the metabolic functions being part of haemoglobin, and zinc is critical for the immune system, protein synthesis and cell division (Jurowski et al., 2014). A regular daily intake of these micronutrients is needed to maintain a steady state in the body. The European Food Safety Authority (EFSA) has established dietary reference values for some essential microelements. The population reference intake (PRI) for the adults has been set at 11–16 mg day−1 for iron, and 7.5–12.7 mg day−1 for zinc. The EFSA also set the average nutrient intake (AI), that is, the level considered adequate for the population's needs, accounting for 1.3 mg day−1 for copper (no more than 5 mg day−1), and 3 mg day−1 for manganese. Biofortification of wheat flour with minerals is considered a strategy for reducing micronutrient deficiency (Velu et al., 2019). A simpler strategy could be, instead, the addition of lupin flour (LF), which is well suited to the formulation of snacks, baked goods, pasta, food supplements.
Durum wheat [(Triticum turgidum L. subsp. durum Desf.) Husnot] ‘re-milled’ semolina is the product obtained by repeatedly milling the grains of durum wheat to a smaller particle size than semolina. The particle size reduction causes a partial starch damage which makes this kind of durum wheat flour suitable for bread making. Typically, durum wheat re-milled semolina is used for the production of bread in the Mediterranean area (Pasqualone, 2012). Recently, the addition of LF to soft wheat flour for bread making has been proposed (Plustea et al., 2022); however no studies have been done so far to evaluate the effects of the addition of LF to re-milled semolina.
The main aim of the present study was to improve the nutritional characteristics of durum wheat re-milled semolina by adding LF or lupin protein concentrate (LPC). Pure lupin flours and blends with re-milled semolina at increasing levels (3, 7, 10 and 15 g/100 g) were analysed to assess the impact of the addition on the proximate composition, the amino acid profile and the mineral elements, to identify the best level for a possible use in the production of biofortified durum wheat bread.
Materials and methods
Flours
Fifty kilograms of re-milled semolina (RMS) were provided by Società Cooperativa Agricola “Valle del Dittaino” a.r.l. (Assoro, Enna, Italy), a company holding both an industrial mill and a bakery plant. The industrial mill ground the durum wheat grains by a series of roller mills (Golfetto, Padua, Italy) alternated with plansifters (Golfetto, Padua, Italy). The bakery plant mainly produced the “Pagnotta del Dittaino” Protected Designation of Origin (PDO) durum wheat bread, so RMS met the quality characteristics imposed by the technical sheet of this PDO bread, namely ash content 0.70–0.90 g/100 g, protein content ≥ 10.5 g/100 g and Falling Number 480–800 s (European Commission, 2014). Re-milled semolina showed 70% of particles in the range 160–200 μm.
Twenty-five kilograms of LF and 25 kg of LPC were purchased from Terrena (Martigné-Ferchaud, France) and from L.I. Frank (Twello, The Netherlands), respectively. Lupin flour was obtained by milling dehulled sweet white lupin (Lupinus albus L.), while LPC was prepared by milling narrow-leaved lupin (Lupinus angustifolius L.) and subsequent flour air-fractioning the flour, then collecting the fine fraction. Lupin protein concentrate had 95% particles < 100 μm, while LF showed 89% of particles in the range 280–400 μm. Flours from the two lupin species are considered similar in composition and would yield similar protein concentrates when similarly processed.
For preparing homogeneous flour blends, 10 kg of RMS and an amount of LF and LPC accounting for 3%, 7%, 10% and 15% (w/w) were mixed for 3 min by a spiral mixer with a capacity of 12 kg (Conti, Bussolengo, Verona, Italy). The range of levels considered has been defined by preliminary trials, since at levels < 3% there were no significant differences compared to RMS, while above 15% excessive increases of ash content and brown index occurred. Representative samples were extracted from the mixes by taking three sub-samples for each of them.
Physical determinations
The colour evaluations were made by using a colorimeter (CR 200, Minolta, Osaka, Japan). The CIELab colorimetric model was adopted, measuring the L* (luminosity), a* (from green to red) and b* (from blue to yellow) colour coordinates. The brown index (100 − L*) was then calculated, which indicates the darkness level, ranging from 0 to 100 (Sanfilippo et al., 2023). The analyses were carried out in triplicate.
Determination of the proximate composition
The moisture content was determined by oven drying (Memmert, Milano, Italy) according to the AOAC method 935.25 (AOAC, 1995). The protein content was measured according to the AOAC 950.36 method (AOAC, 1995), considering 5.7 as the nitrogen-to-protein conversion factor for RMS and 6.25 for LF and LPC. The total dietary fibres were determined by using an enzymatic–gravimetric procedure, according to the AACC method 32–07.01 (AACC, 2000). The crude fat content was determined by Soxhlet extraction, following the AACC method 30–25.01 (AACC, 2000). The ash content was determined according to the ISO method 2171 (ISO, 2007). Available carbohydrates were calculated by difference: Carbohydrate = 100 − (moisture + ash + crude fat + protein + fibre). The amino acid profile was analysed as reported in Gorissen et al. (2018). The amino acid score was calculated as mg amino acid in 1 g of test protein/mg amino acid in 1 g of reference protein × 100. The analyses were carried out in triplicate.
Multielemental analysis
The multielemental analysis was carried out by Inductively Coupled Plasma Optical Emission spectroscopy (ICP-OES). An amount of 0.5 g of flour was accurately weighed to the nearest 1 mg in a microwave vessel. Then, 2 mL of deionised water, 8 mL of nitric acid (concentration ≥ 69.0%) and 2 mL of extra-pure hydrogen peroxide (30% w/w) were added for the digestion, according to Spina et al. (2022), waiting for 12 h for the stabilisation of the reaction, until the formation of bubbles had finished. The vessel was then sealed and heated in the MARS6 Microwave Digestion System (CEM Corporation, Matthews, NC, USA), adopting the following thermal conditions (Spina et al., 2022): the temperature was raised to 150 °C in approximately 20 min and maintained for 30 min, then raised to 200 °C in approximately 20 min and maintained for 30 min. After cooling, the digested solution was filtered through a filter with a 0.45 μm pore size. The solution was supplemented with water to reach a 25 mL volume and analysed using the Optima 2100 DV ICP/OES (PerkinElmer, Waltham, MA, USA), coupled with the WinLab32 software for ICP/OES, version 3.4.1.0271, according to the following operating conditions: spray chamber type = cyclonic; plasma aerosol type = wet; sample flow rate = 1.50 mL min−1; plasma = 15 L min−1; aux = 0.2 L min−1; nebulizer = 0.4 L min−1; power = 1300 Watt; purge gas = nitrogen ultra-high purity (UHP) 99.99%; dual backside-illuminated, cooled, CCD detector (PerkinElmer, Waltham, MA, USA). The analyses were carried out in triplicate.
Statistical analysis
All data (mean ± standard deviation) were subjected to one-way analysis of variance (ANOVA) by using the Statgraphics® Centurion XVI (Statpoint Technologies, The Plains, VA, USA) software. The difference between the means was determined by the Tukey test, at the probability level P ≤ 0.001 for all the parameters, with the exception of b* (P ≤ 0.01).
Results and discussion
The physical–chemical characteristics of the flours
Table 1 shows the proximate composition and colour features of the pure flours and their blends. The moisture content of LPC (8.20 g/100 g) and LF (9.10 g/100 g) was lower than RMS (12.25 g/100 g), while the flour mixes showed intermediate values. The protein content was significantly higher in LF and LPC than in RSM. In particular, a very high value was observed in LPC (55.00 g/100 g) due to the process of protein concentration adopted for its preparation. The protein level of LF was slightly lower than the value reported by other authors (Hamad et al., 2020). Re-milled semolina, instead, had a protein content of 11.93 g/100 g, meeting the requirements of current rules for this kind of flour (European Commission, 2014). The addition of LF and LPC resulted in a significant increase in the protein content of the flour mixes, except when LF was added at the lowest percentage (LF 3%). Similarly, Plustea et al. (2022) achieved protein increases by mixing white lupin flour (10%, 20% and 30%) and soft wheat flour.
Proximate composition and colour features of re-milled semolina (RMS), narrow-leaved lupin protein concentrate (LPC), white lupin flour (LF) and their mixes at different percentages (3, 7, 10 and 15 g/100 g)
| Sample | Moisture | Protein | Fat | Fibre | Carbohydrate | Ash | Brown index | a* | b* |
|---|---|---|---|---|---|---|---|---|---|
| (g/100 g) | (g/100 g) | (g/100 g) | (g/100 g) | (g/100 g) | (g/100 g) | (100-L*) | |||
| RMS | 12.25 ± 0.07c | 11.93 ± 0.06h | 1.35 ± 0.06d | 2.30 ± 0.06c | 71.54 ± 0.16a | 0.73 ± 0.03d | 10.26 ± 0.01e | −2.38 ± 0.18ef | 17.17 ± 0.59d |
| LPC | 8.20 ± 0.02h | 55.00 ± 0.35a | 9.70 ± 0.11a | 4.77 ± 0.03b | 19.33 ± 0.22d | 3.00 ± 0.70a | 13.42 ± 0.01a | −0.07 ± 0.01a | 20.64 ± 1.60c |
| LF | 9.10 ± 0.14g | 40.05 ± 0.09b | 12.01 ± 0.21a | 6.01 ± 0.16a | 29.84 ± 0.04c | 3.00 ± 1.41a | 13.20 ± 0.02a | −2.18 ± 0.03de | 31.45 ± 0.01a |
| LPC 3% | 12.53 ± 0.01a | 13.20 ± 0.03fg | 1.60 ± 0.06c | 2.41 ± 0.21c | 69.53 ± 0.09ab | 0.73 ± 0.07cd | 11.07 ± 0.02d | −1.66 ± 0.10c | 19.91 ± 0.04c |
| LPC 7% | 12.31 ± 0.01bc | 14.94 ± 0.12e | 1.93 ± 0.02c | 2.53 ± 0.54c | 67.49 ± 0.21ab | 0.80 ± 0.05bcd | 11.82 ± 0.21bc | −1.70 ± 0.01c | 22.61 ± 0.02bc |
| LPC 10% | 12.43 ± 0.01ab | 16.24 ± 0.14d | 2.19 ± 0.01bc | 2.68 ± 0.11c | 65.63 ± 0.18ab | 0.83 ± 0.03bcd | 11.85 ± 0.01bc | −1.41 ± 0.01b | 23.37 ± 0.01bc |
| LPC 15% | 12.15 ± 0.02c | 18.43 ± 0.30c | 2.60 ± 0.04b | 3.18 ± 0.03c | 62.71 ± 0.16b | 0.93 ± 0.03bc | 11.98 ± 0.01b | −1.27 ± 0.01b | 23.90 ± 0.01b |
| LF 3% | 10.82 ± 0.02de | 12.72 ± 0.09gh | 1.67 ± 0.05c | 3.56 ± 0.09c | 70.60 ± 0.05a | 0.63 ± 0.02d | 11.45 ± 0.01cd | −2.02 ± 0.01d | 22.16 ± 0.02bc |
| LF 7% | 10.71 ± 0.01ef | 13.85 ± 0.01ef | 2.10 ± 0.03bc | 4.19 ± 0.08c | 68.29 ± 0.02ab | 0.86 ± 0.01bc | 11.51 ± 0.01cd | −2.32 ± 0.01ef | 23.17 ± 0.01bc |
| LF 10% | 10.90 ± 0.02d | 14.69 ± 0.15e | 2.42 ± 0.04b | 3.04 ± 0.02c | 68.02 ± 0.06ab | 0.93 ± 0.01bc | 11.78 ± 0.01bc | −2.30 ± 0.01ef | 23.95 ± 0.02b |
| LF 15% | 10.66 ± 0.02f | 16.10 ± 0.01d | 2.95 ± 0.01b | 4.03 ± 0.06bc | 65.30 ± 0.11ab | 0.96 ± 0.01b | 11.87 ± 0.01bc | −2.42 ± 0.01f | 24.14 ± 0.03b |
Different letters in column indicate a significant difference (P ≤ 0.001; P ≤ 0.01 for b*).
The ash content of LPC and LF, closely related to the amount of minerals, was very high compared to RMS. Consequently, the flour mixes showed higher ashes than RMS, with significant differences when LF was added at levels ≥ 7% and LPC ≥ 15%. The ash content of LF was slightly lower than the value reported by Plustea et al. (2022). The ash content of RMS complied with the legal limits established in Italy (Italian Republic, 2001).
Lupin flour and LPC showed higher values of fat (9.70 g/100 g in LPC and 12.01 g/100 g in LF) than RMS (1.35 g/100 g), therefore their addition to the latter resulted in significant increases, starting from levels ≥ 3% for both the lupin milling products. The amount of fat assessed in LF agreed with other studies (Plustea et al., 2022). The fat content of RMS was slightly lower than the value reported for semolina (Pasqualone et al., 2014), indicating a substantial agreement, being semolina a less refined product of durum wheat milling than RMS. A similar behaviour was observed for the fibre content (2.30, 4.77 and 6.01 g/100 g for RMS, LPC and LF, respectively), but in this case the increases of fibre in the flour mixes respect to RMS were not statistically significant. The level of fibres of LF was between the findings of Plustea et al. (2022) and those of Alomari & Abdul-Hussain (2013) and Hamad et al. (2020), while the content of fibre of RMS agreed with other studies (Pasqualone et al., 2017).
As regards the quantity of carbohydrates, the maximum value was found in RMS (71.54 g/100 g) and the minimum in LPC (19.33 g/100 g). Blending therefore reduced the carbohydrate content, but the difference was statistically significant, relative to RMS, only in the LPC 15% mixture.
The colour of the three pure flours and their mixes was substantially yellowish, but significant differences were assessed by the instrumental evaluation. The highest value of a* was assessed in LPC, but particularly interesting was the very high value of b* determined in LF, which indicates intense yellowness and is attributable to the presence of relevant amounts of carotenoid compounds in the lupin seeds (Khan et al., 2015; Brandolini et al., 2022). Carotenoids have known provitamin A activity. Re-milled semolina showed values of brown index (100-L*) and a* in the usual range for re-milled semolina, but b* was slightly lower (Giannone et al., 2018). The addition of LPC and LF to RMS caused an increase in the brown index, b*, and a*, proportional to the percentage of LPC and LF used in the flour mixes. A similar trend was observed by Alomari et al. (2016) with the addition of increasing amounts (5%, 10%, 15% and 20%) of germinated lupin flour to soft wheat flour.
Legumes are known to contain more lysine and less methionine and cysteine than cereals, as confirmed by the analysis of the amino acid profile (Table 2). In LF and LPC the prevailing amino acids were, in decreasing order, leucine, lysine, phenylalanine, valine, isoleucine and threonine, with values in agreement with other studies (Sujak et al., 2006; Martínez-Villaluenga et al., 2010). In the flour mixes, some amino acids increased, namely leucine (with significant differences, compared to RMS, only for LF at addition levels ≥ 15%), threonine (with significant differences for LPC ≥ 10%), tyrosine (with significant differences for LPC ≥ 15% and LF ≥ 10%) and lysine (with significant differences for LPC and LF ≥ 10%). On the contrary, decreases were observed for cysteine and methionine (significant for LF ≥ 15%), and for phenylalanine (significant for LF ≥ 10%).
Amino acid profile and lysine score of re-milled semolina (RMS), narrow-leaved lupin protein concentrate (LPC), white lupin flour (LF) and their mixes at different percentages (3, 7, 10 and 15 g/100 g)
| Sample | Lysine score (%) | Lysine | Methionine | Cysteine | Isoleucine | Leucine | Phenylala nine | Tyrosine | Valine | Threonine | Tryptophan |
|---|---|---|---|---|---|---|---|---|---|---|---|
| (g/16 g N) | (g/16 g N) | (g/16 g N) | (g/16 g N) | (g/16 g N) | (g/16 g N) | (g/16 g N) | (g/16 g N) | (g/16 g N) | (g/16 g N) | ||
| RMS | 50.9 ± 0.9e | 2.65 ± 0.05d | 1.75 ± 0.04a | 2.10 ± 0.02a | 3.35 ± 0.07c | 6.60 ± 0.02d | 4.40 ± 0.02a | 2.70 ± 0.03d | 4.25 ± 0.07a | 2.70 ± 0.02d | 1.25 ± 0.07a |
| LPC | 90.9 ± 0.6a | 4.73 ± 0.03a | 0.87 ± 0.05c | 1.35 ± 0.02c | 3.72 ± 0.04b | 6.80 ± 0.01b | 4.02 ± 0.03c | 4.23 ± 0.04a | 4.02 ± 0.03b | 3.82 ± 0.06a | 0.81 ± 0.04b |
| LF | 88.6 ± 0.8b | 4.61 ± 0.04b | 0.75 ± 0.04c | 1.27 ± 0.02c | 3.98 ± 0.04a | 7.01 ± 0.02a | 3.74 ± 0.01d | 4.34 ± 0.05a | 3.75 ± 0.02b | 3.32 ± 0.03b | 0.63 ± 0.05b |
| LPC 3% | 52.3 ± 1.1e | 2.72 ± 0.05d | 1.73 ± 0.05ab | 2.09 ± 0.01a | 3.36 ± 0.07c | 6.60 ± 0.01d | 4.39 ± 0.01a | 2.72 ± 0.01d | 4.24 ± 0.07a | 2.74 ± 0.01d | 1.26 ± 0.08a |
| LPC 7% | 54.0 ± 1.2d | 2.80 ± 0.06cd | 1.70 ± 0.06ab | 2.07 ± 0.01ab | 3.38 ± 0.06c | 6.62 ± 0.01d | 4.37 ± 0.01a | 2.78 ± 0.02cd | 4.23 ± 0.06a | 2.78 ± 0.02cd | 1.25 ± 0.06a |
| LPC 10% | 55.3 ± 1.1cd | 2.86 ± 0.05c | 1.68 ± 0.06ab | 2.06 ± 0.01ab | 3.39 ± 0.06c | 6.62 ± 0.01d | 4.36 ± 0.01ab | 2.82 ± 0.03bcd | 4.23 ± 0.06a | 2.82 ± 0.02c | 1.25 ± 0.06a |
| LPC 15% | 57.1 ± 1.2c | 2.97 ± 0.06c | 1.64 ± 0.06ab | 2.05 ± 0.02ab | 3.41 ± 0.05c | 6.63 ± 0.01d | 4.35 ± 0.01ab | 2.89 ± 0.03b | 4.22 ± 0.07a | 2.89 ± 0.01c | 1.25 ± 0.06a |
| LF 3% | 52.1 ± 1.1e | 2.71 ± 0.05d | 1.72 ± 0.07ab | 2.08 ± 0.01ab | 3.37 ± 0.07c | 6.61 ± 0.01d | 4.38 ± 0.01a | 2.75 ± 0.01d | 4.23 ± 0.07a | 2.72 ± 0.01d | 1.23 ± 0.07a |
| LF 7% | 53.6 ± 1.2d | 2.79 ± 0.06cd | 1.68 ± 0.06ab | 2.06 ± 0.01ab | 3.41 ± 0.06c | 6.64 ± 0.01d | 4.35 ± 0.01ab | 2.82 ± 0.03cd | 4.21 ± 0.06a | 2.74 ± 0.01d | 1.21 ± 0.06a |
| LF 10% | 54.8 ± 1.1cd | 2.85 ± 0.05c | 1.65 ± 0.06ab | 2.05 ± 0.02ab | 3.43 ± 0.06c | 6.65 ± 0.01cd | 4.33 ± 0.01b | 2.87 ± 0.01bc | 4.20 ± 0.06a | 2.76 ± 0.01d | 1.19 ± 0.06a |
| LF 15% | 56.7 ± 1.1c | 2.95 ± 0.05c | 1.61 ± 0.04b | 2.04 ± 0.01b | 3.47 ± 0.06c | 6.68 ± 0.01c | 4.30 ± 0.01b | 2.95 ± 0.03b | 4.18 ± 0.06a | 2.80 ± 0.01cd | 1.16 ± 0.06a |
| Reference value† | 100 | 5.2 | 2.6 | 3.1 | 6.3 | 4.6 | 4.2 | 2.7 | 0.74 | ||
Different letters in column indicate a significant difference (P ≤ 0.001).
Values suggested for children aged 1–2 years (WHO/FAO/UNU Expert Consultation, 2007). For methionine + cysteine and phenylalanine + tyrosine the reference value is referred to the sum of the two amino acids.
Based on the reference value suggested for children aged 1–2 years (WHO/FAO/UNU Expert Consultation, 2007), accounting for 5.2 g/16 g N, the limiting amino acid was lysine both in the pure flours and in their mixes. However, RMS showed a significantly lower lysine score (50.9) than LF and LPC (88.6 and 90.9, respectively). Therefore, the addition of LF and LPC improved the lysine score of the flour mixes, reaching, respectively, the values of 56.7 and 57.1 at the highest dose of addition (15%). The increase of lysine score was significant for levels of addition of LF and LPC ≥ 7%.
The microelements (Cu, Mn, Zn, Fe), the macroelements (K, P, Ca, Mg, Na) and the heavy metals (As, Cr, Pb, Cd, Ni)
Re-milled semolina showed a significantly lower content of microelements compared to LPC and LF (Table 3). The most abundant element was Mn, with the highest level detected in LF (116 mg kg−1). This value was in agreement with other studies (Plustea et al., 2022; Spina et al., 2022). Re-milled semolina, instead, showed 11.03 mg Mn kg−1, in agreement with Yaver & Bilgiçli (2021). The Mn content of the flour mixes increased significantly with the addition of LF ≥ 3%. Lupin protein concentrate showed a significantly lower Mn content than LF, therefore the increase of Mn in the flour mixes was significant only for levels ≥ 15%. Other authors reported increases of the Mn content with the addition of 10% lupin flour to soft wheat flour (Plustea et al., 2022).
Content of microelements and macroelements of re-milled semolina (RMS), narrow-leaved lupin protein concentrate (LPC), white lupin flour (LF) and their mixes at different percentages (3, 7, 10 and 15 g/100 g)
| Microelements | Macroelements | ||||||||
|---|---|---|---|---|---|---|---|---|---|
| Sample | Cu | Mn | Zn | Fe | K | P | Ca | Mg | Na |
| (mg kg−1) | (mg kg−1) | (mg kg−1) | (mg kg−1) | (mg kg−1) | (mg kg−1) | (mg kg−1) | (mg kg−1) | (mg kg−1) | |
| RMS | 3.15 ± 0.03e | 11.03 ± 0.01h | 16.29 ± 0.06f | 13.91 ± 0.01i | 2212 ± 92f | 1387 ± 19d | 233 ± 9d | 383 ± 17h | 113 ± 7c |
| LPC | 4.94 ± 0.10b | 22.04 ± 0.04f | 32.05 ± 0.05b | 40.81 ± 0.06a | 8421±76a | 2774 ± 40b | 2140±81a | 1685±54a | 494±29a |
| LF | 8.13 ± 0.13a | 116.00 ± 1.14a | 48.58 ± 0.08a | 35.62 ± 0.03b | 1705 ± 14j | 4705±59a | 1685 ± 87b | 1084 ± 53b | 195 ± 5b |
| LPC 3% | 3.17 ± 0.04de | 11.35 ± 0.03gh | 16.74 ± 0.01ef | 15.53 ± 0.04g | 2266 ± 92e | 1436 ± 81d | 288 ± 4cd | 426 ± 1g | 126 ± 1c |
| LPC 7% | 3.22 ± 0.04de | 11.81 ± 0.02gh | 17.57 ± 0.01cdef | 15.63 ± 0.08g | 2469 ± 39d | 1462 ± 87d | 362 ± 14c | 477 ± 3f | 142 ± 2bc |
| LPC 10% | 3.33 ± 0.01de | 12.12 ± 0.03gh | 18.10 ± 0.12cdef | 16.58 ± 0.01e | 2791 ± 64c | 1541 ± 2.8d | 416 ± 5c | 520 ± 14d | 153 ± 3bc |
| LPC 15% | 3.44 ± 0.06d | 12.66 ± 0.04g | 19.03 ± 0.04c | 17.84 ± 0.06c | 3164 ± 52b | 1619 ± 12cd | 510 ± 3c | 580 ± 5c | 171 ± 2bc |
| LF 3% | 3.20 ± 0.04de | 54.32 ± 0.02e | 17.25 ± 0.05cdef | 14.65 ± 0.06h | 2197 ± 91fg | 1496 ± 25d | 279 ± 5cd | 404 ± 3g | 115 ± 3c |
| LF 7% | 3.26 ± 0.04de | 61.39 ± 0.04d | 18.40 ± 0.06cdef | 15.62 ± 0.01g | 2177 ± 49fgh | 1659 ± 42cd | 271 ± 2cd | 439 ± 4g | 121 ± 3c |
| LF 10% | 3.67 ± 0.15cd | 64.52 ± 0.08c | 19.06 ± 0.76c | 16.04 ± 0.061f | 2161 ± 82gh | 1752 ± 68cd | 383 ± 10c | 462 ± 10f | 124 ± 4c |
| LF 15% | 3.97 ± 0.01c | 65.23 ± 0.31b | 21.14 ± 0.01b | 17.12 ± 0.06d | 2136 ± 86h | 1957 ± 80c | 466 ± 4c | 501 ± 2e | 128 ± 2c |
Different letters in column indicate a significant difference (P ≤ 0.001).
Iron, detected in the order LPC > LF > RMS, significantly increased in the flour mixes after additions of LPC and LF as little as 3%. Slightly lower Fe levels were reported by Plustea et al. (2022) in LF, while slightly higher values were reported in Spina et al. (2022). Plustea et al. (2022) reported significant increases of Fe in blends of soft wheat with lupin flour at levels of 10%. Levels of Fe ranging from 18.8 to 20.2 mg kg−1 have been ascertained in the whole meal of durum wheat landraces from Mexico and Iran (Hernandez-Espinosa et al., 2020), in agreement with the value detected in RMS (13.91 mg kg−1), considered the lowering effect of the milling and refining process.
The level of Cu, accounting for 8.13 mg kg−1 in LF, 4.94 mg kg−1 in LPC and 3.15 mg kg−1 in RMS, agreed with the findings of Yaver & Bilgiçli (2021) in bitter lupin flour and durum wheat semolina. The flour mixes showed a significant increase of Cu, compared to RSM, for levels of addition of LF ≥ 10% and LPC ≥ 15%. Increases in the content of Cu were reported by other authors when LF was added to soft wheat flour (Plustea et al., 2022) and to semolina (Yaver & Bilgiçli, 2021). Contents of Zn observed in LF (48.58 mg kg−1) and LPC (32.05 mg kg−1) are approximately in line with other findings (Wasilewko & Buraczewska, 1999; Mazumder et al., 2021; Yaver & Bilgiçli, 2021). Re-milled semolina showed a content of 16.29 mg Zn kg−1, in agreement with the findings of Plustea et al. (2022) in soft wheat flour. The Zn content of the flour mixes increased significantly with additions of LF ≥ 10% and LPC ≥ 15%. Increases in the content of Zn were observed also by Plustea et al. (2022) and Yaver & Bilgiçli (2021) in blends of lupin flour with soft wheat flour or semolina.
The macro-elemental profile (Table 3) of the three pure flours was dominated by K, followed by P. Lupin flour showed lower contents of K than those reported in LF by other authors (Mazumder et al., 2021), while the other elements approximatively agreed with other studies (Aslan & Bilgiçli, 2021; Mazumder et al., 2021; Yaver & Bilgiçli, 2021). Interestingly, all the macroelements except P were more concentrated in LPC than in LF. Although LPC was a commercial product, with no detailed information about the process conditions adopted to concentrate the protein fraction, studies have shown that protein concentrates obtained by dry-fractionation of pulse flours are richer in K and Ca than the starting flours (De Angelis et al., 2021). The contents of macroelements assessed in RMS were lower than those reported by Yaver & Bilgiçli (2021) in semolina for pasta-making, probably due to a higher refining degree of RMS. The macroelements of the flour mixes significantly increased with the addition of LF (Mg at levels ≥ 3%, K and Ca at levels ≥ 10% and P at levels ≥ 15%) and LPC (K and Mg at levels ≥ 3% and Ca at levels ≥ 10%). Increases in the content of Ca, K and Mg were observed also by Plustea et al. (2022) by mixing LF with soft wheat flour, while Yaver & Bilgiçli (2021) reported increases of Ca and P in blends of LF with semolina.
The analysis of heavy metals (Table 4) detected values of As, Pb and Cd < 0.01 mg kg−1, both in the pure flours and in their mixes, complying with the limits imposed by the EU Reg. 1881/06 (for As), EU Reg. 2021/1317 (for Pb) and EU Reg. 2021/1323 (for Cd). Cd and Pb contents ranging from not detectable to 0.01 mg kg−1 were reported in six L. angustifolius L. and three L. albus cultivars by Mazumder et al. (2021). Cr was in the order LPC > LF > RMS and proportionally increased in the mixes according to the percentage of addition. Higher values were detected for Ni, especially in the lupin milling products (0.30 mg kg−1 in LF, 0.94 mg kg−1 in LPC, 0.06 mg kg−1 in RMS). Therefore, compared to RMS, the flour mixes showed higher contents of Ni, which increased proportionally with increasing additions of LF and LPC. Ni has recently become the object of attention by the European Food Safety Agency (EFSA), which has raised its tolerable daily intake (TDI) from 2.8 to 13 μg kg−1 of body weight (Schrenk et al., 2020). In wheat flour, levels of Ni from 0.08 to 0.09 mg kg−1 were observed by Tejera et al. (2013), while Bawiec et al. (2014) reported an increase from 0.09 to 0.31 mg kg−1 with the decrease of wheat flour refining degree. Levels of Ni of 0.02 mg kg−1 were reported by Plustea et al. (2022) in LF.
Heavy metal content of re-milled semolina (RMS), narrow-leaved lupin protein concentrate (LPC), white lupin flour (LF) and their mixes at different percentages (3, 7, 10, 15 g/100 g)
| Sample | As | Cr | Pb | Cd | Ni |
|---|---|---|---|---|---|
| (mg kg−1) | (mg kg−1) | (mg kg−1) | (mg kg−1) | (mg kg−1) | |
| RMS | <0.01 | 0.01 | <0.01 | <0.01 | 0.06 |
| LPC | <0.01 | 0.31 | <0.01 | <0.01 | 0.94 |
| LF | <0.01 | 0.16 | <0.01 | <0.01 | 0.30 |
| LPC 3% | <0.01 | 0.03 | <0.01 | <0.01 | 0.16 |
| LPC 7% | <0.01 | 0.04 | <0.01 | <0.01 | 0.17 |
| LPC 10% | <0.01 | 0.07 | <0.01 | <0.01 | 0.27 |
| LPC 15% | <0.01 | 0.08 | <0.01 | <0.01 | 0.54 |
| LF 3% | <0.01 | 0.02 | <0.01 | <0.01 | 0.13 |
| LF 7% | <0.01 | 0.02 | <0.01 | <0.01 | 0.15 |
| LF 10% | <0.01 | 0.03 | <0.01 | <0.01 | 0.19 |
| LF 15% | <0.01 | 0.04 | <0.01 | <0.01 | 0.34 |
Conclusions
Lupins have recently come under the spotlight for their unique nutritional characteristics, not to mention the recognised health benefits of this legume, so there has been a boom in lupin-based snacks and a growing trend has been established in their consumption.
Overall, the results obtained in this study show that re-milled durum wheat semolina can be effectively fortified with LF, and especially with LPC. The incorporation of lupin remarkably improved the nutritional profile of the flour mix in terms of proteins and minerals.
To quantify, the protein content significantly increased in the flour blends for additions of LPC ≥ 3% and LF ≥ 7%. The lysine score significantly increased at levels of addition of LF or LPC ≥ 7%. Additions of LPC at levels as little as 3% were sufficient to determine a significant increase of iron, manganese and magnesium, while copper, zinc, potassium and calcium increased at addition levels ≥ 10%.
These results suggest a promising use of the flour mixes in the production of biofortified durum wheat breads and other widely consumed baked products, assumed that further studies are made to evaluate their technological performance. Such baked goods would meet the increasing request for more nutritious plant-based food products expressed by the modern consumers.
Acknowledgments
The authors thank “Valle del Dittaino” Agricultural Cooperative Society (Enna, Italy), for kindly donating the re-milled semolina used in the experimental trials.
Author contributions
Alfio Spina: Conceptualization (lead); data curation (lead); formal analysis (lead); investigation (lead); project administration (lead); resources (lead); supervision (lead); validation (lead); visualization (lead); writing – original draft (lead); writing – review and editing (lead). Michele Scarangella: Methodology (equal); resources (equal); validation (equal). Michele Canale: Conceptualization (equal); data curation (equal); methodology (equal); software (equal); validation (equal); visualization (equal); writing – original draft (equal); writing – review and editing (equal). Rosalia Sanfilippo: Data curation (equal); validation (equal); writing – original draft (equal). Virgilio Giannone: Conceptualization (equal); methodology (equal); resources (equal). Carmine Summo: Validation (equal); visualization (equal); writing – review and editing (equal). Antonella Pasqualone: Conceptualization (equal); formal analysis (equal); investigation (equal); project administration (equal); supervision (equal); validation (equal); visualization (equal); writing – review and editing (equal).
Funding information
Part of this research was supported by the ALI.FU.I.DE.A. Project (Functional foods and nutraceutical supplements based on white lupin and citrus derivatives), action 4.1.1.1 of PO FESR Sicilia 2007–2013, funded by ‘Regione Siciliana’ (grant number 3060/3).
Conflict of interest statement
The authors declare no conflicts of interest.
Ethical approval
Ethical approval was not required for the present research.
Peer review
The peer review history for this article is available at https://www.webofscience.com/api/gateway/wos/peer-review/10.1111/ijfs.16592.
Data availability statement
The data used to support the findings of this study can be made available by the corresponding author upon request.
References
It has been cited to describe in detail the physical-chemical characteristics of durum wheat re-milled semolina.
It has been cited because it provides comprehensive information on the nutritional features of nine lupin cultivars, useful for comparing our results.
It has been cited because reports a study on the effect of blending wheat and lupin flours similar to our study (but using soft wheat instead of durum wheat re-milled semolina), therefore useful for comparisons.
It has been cited because it reports the standard values to calculate the amino acid score.
