


Abstract
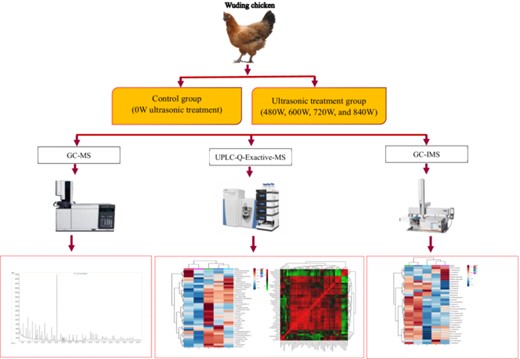
The chicken broth was pre-treated with ultrasound at 0, 480, 600, 720 and 840 W for 30 min before stewing, and the changes of free fatty acids, small molecular compounds, volatile flavour compounds, umami polypeptides in the chicken broth were determined by GC–MS, UPLC-Q-Exactive-MS, GC–IMS and LC–MS/MS, respectively. 600 W ultrasonic treatment group outperformed the other groups in terms of sensory evaluation (P < 0.05). Palmitic acid and stearic acid were the chief free fatty acids in chicken broth. 530 and 236 small molecule metabolites were found. 36 volatile compounds were identified in chicken broth, mainly aldehydes. The proportion of sweet and umami amino acids in the chicken broth of the 600 W ultrasonic treatment group accounted for 63% of the total polypeptide sequence, indicating that pre-ultrasonication can increase the content of sweet and umami polypeptides in chicken soup. The overall taste and flavour of Wuding chicken soup under pre-ultrasonication with 600 W power were the best combined with sensory evaluation scores. These results can provide scientific and theoretical guidance for the further understanding of the effect of ultrasound assistance on the quality of chicken broth and the intensive processing of local chicken.
Introduction
Chicken has the advantages of low fat, high protein, low cholesterol and low calorie (Wang et al., 2014; Cao et al., 2021), and is considered a nutritious meat product (Zhang et al., 2018). Chicken broth is rich in active peptides, free amino acids, vitamins, trace elements and other nutrients, which have the effects of enhancing immunity (Gu & Li, 2020; Rennard et al., 2020), relieving cold symptoms, and improving anxiety (Li et al., 2017), and also plays a physiological role in promoting body metabolism, improving blood poverty and enhancing antioxidant activity (You et al., 2019). With the deepening of the research on the nutritional composition and health function of chicken, the chicken market has great development potential in the future.
Stewing, the hot processing of meat products, is the most traditional chicken cooking method. After stewing, the micro-organisms and parasites on the surface and inside of the meat will be killed, and a special flavour will be produced. Compared with other methods, this method will also play a positive role in preserving the colour of meat (Yu et al., 2021a). After a long time of stewing, the flavour precursors in the chicken will be released into the chicken broth and further react to produce a variety of flavour substances, mainly volatile flavour substances, and taste components. Some previous reports found that the longer the chicken broth was simmered, the fewer aroma compounds it contained (Yu et al., 2021b). Therefore, it is necessary to study new methods to maximise the retention of its nutrients and flavour.
Amino acids, divided into sweet, sour, bitter, salty, umami and tasteless amino acids, have a certain influence on the flavour of the chicken broth, and umami amino acids and their derivatives on the largest contribution to the chicken broth taste (Li et al., 2017). Some scholars believe that peptide components contribute greatly to the delicacy of chicken broth, mainly composed of umami and sweet amino acids such as glutamine, alanine and serine (Kong et al., 2017). A previous study has also shown that nucleotides and some free amino acids, like aspartic acid and glutamate, are also key sources of the flavour of chicken broth (Li et al., 2017).
In addition, chicken broth is well known for its unique taste, it mainly comes from lipid oxidation and Maillard reaction products (Fan et al., 2018; Feng et al., 2018). Some studies have shown that amino groups on amino acid side chains and the terminal hydroxyl groups in polysaccharide molecules may form covalent bonds through the Maillard process, which is critical for the colour and taste of food (Deng et al., 2018; Yu et al., 2020a; Liu et al., 2021).
Reasonable thermo-oxidative changes in lipids may lead to the generation of satisfactory aromatic compounds in cooked meat, especially the oxidation of fatty acid components, which can produce hundreds of volatiles, including aldehydes, hydrocarbons, ketones, carboxylic acids, alcohols, esters and oxidative heterocyclic compounds, such as alkyl furans (Sun et al., 2018; Barola et al., 2020). A previous study has shown that aldehydes are the chief volatile substances in chicken broth, and alkenes and dienals are considered to be two characteristic volatile components of chicken broth because of their low thresholds (Qi et al., 2017). In addition, unsaturated alcohols like 1-octen-3-ol contribute greatly to the chicken broth flavour. However, owing to the high threshold of saturated fatty alcohols, they are not easy to be identified, so their contribution is relatively small (Li & Zhao, 2010). Furans are produced by the oxidation of lipids and are thought to have a sweet taste and impart a good flavour to meat products (Chen et al., 2020b).
The umami peptide can not only produce a special flavour by itself but also synergize with other flavour substances to enhance the original flavour characteristics of food (Zhang et al., 2018). It is also known as a flavour-enhancing peptide, which is mainly produced by glutamic acid monosodium salt, nucleotides and some peptide components (Yang et al., 2022). At present, various umami peptides have been isolated from various animal and plant hydrolyzates, such as ham, bacon, soy sauce, soy protein and peanut protein, and it has been confirmed that they are a major contributor to the flavour of food. Zhuang et al. (2016) synthesised and identified LPEEV from soy sauce by solid-phase chemical synthesis, and found that peptides such as AQALQAQA and EQQQQ have umami characteristics. Yu et al. (2021b) have discovered umami peptide molecules from soybean hydrolysate by molecular docking.
Ultrasound, a food processing technology, is considered to be an impelling dietary component interacting perfect tool (Vargas et al., 2021; Esua et al., 2022; Zou et al., 2022). Because of its good directionality, strong penetrating ability, easy way to obtain relatively concentrated acoustic energy and tremendously beneficial result on the function of diverse food components, it has been widely used and gained more attention than other non-heat treatment forms (Zou et al., 2022). High-frequency and low-energy ultrasonic waves are mainly used in food-assisted enzymatic hydrolysis (Wen et al., 2020; Chen et al., 2022a), fruit and vegetable product drying (Putranto & Chen, 2020), cutting, emulsification and hazardous substance detection.
Stewing Wuding chicken broth is favoured by locals, and we have studied the metabolic characteristics of Wuding chicken during growth and the changes in flavour precursors during processing (Xiao et al., 2019a, 2019b, 2021). However, there is no relevant report on the quality of Wuding chicken broth, especially the quality of Wuding chicken broth stewed with different powers of ultrasound. Therefore, the effects of pre-ultrasonication with different powers (0, 480, 600, 720, 840 W; 40 kHz) on the changes of free fatty acids, umami peptides and small molecular and volatile flavour compounds in Wuding chicken broth were determined by GC–MS, ultra-high performance liquid chromatography-mass spectrometer (UPLC-Q-Exactive-MS), gas chromatography-ion mobility spectrometer (GC–IMS), and liquid chromatography-tandem mass spectrometer (LC–MS/MS), severally. The information obtained in this study shows the influence of ultrasound on the quality of chicken broth and provides scientific and theoretical guidance for the deep processing of chicken.
Materials and methods
Materials
Thirty 140-day-old Wuding hens were selected from the Experimental Chicken Farm of Yunnan Agricultural University. After slaughtering, cleaning and removing the head, neck and feet of the chicken, the carcass weight was about 1600 ± 120 g. N-Hexane, isopropanol and methanol used were HPLC-grade, while acetonitrile, ammonium acetate and ammonium hydroxide were LC–MS grade. All were purchased from CNW Technologies GmbH Co. (Düsseldorf, Germany). Mix49 and Stearic-d35 acid were obtained from Sigma-Aldrich (St. Louis, USA). All the solutions were prepared using ultrapure water (18.2 MΩcm; Millipore, Bedford, MA, USA).
Wuding chicken broth processing and sampling
Wuding chicken broth was stewed concerning our previous method (Xiao et al., 2021). Thirty chicken carcasses were casually divided into six chickens in each group, a total of five groups. The chicken carcass was pre-boiled in boiling water for 3 min, rinsed with cold water, drained and weighed. The chicken carcass and ultrapure water were put into a stainless-steel container at a ratio of 1:2 (m/m) and then placed in an ultrasonic apparatus for ultrasonic treatment at 0 W, 480 W, 600 W, 720 W and 840 W for 30 min, respectively. Each chicken was individually ultrasound treated. The ultrasound frequency is 40 kHz (JP-240ST; Inner slot size: 550 × 400 × 350 mm; 77 L; Max Ultrasonic,1200 W; Power, 220 V; Heating, 3000 W; Shenzhen Skymen Cleaning Equipment Co., Ltd, Guangdong Province, China). After ultrasonic treatment, the chicken and water were transferred to the casserole and placed on the induction cooker, boiled, skimmed the scum on the surface of the broth, and stewed for 2.5 h on a low heat of 300 W in the induction cooker (JYC-21HEC05, 120–2100 W, 346 × 214 × 430 mm, 5.2 Kg, Joyoung Co., Ltd, China). The time was counted when the water was boiling, and 2.5% salt was added to the broth based on the weight of the chicken carcass. After the stewing, the chicken broth was weighed, and warm water was added to reach the initial weight. It was then divided into two parts, one for sensory evaluation and the other for the analysis of small molecule metabolites and flavour compounds.
Analysis methods
Sensory evaluation
The chicken broth was placed in clean, disposable paper cups and twenty evaluators were invited to conduct a sensory evaluation on the chicken broth, with a male-to-female ratio of 1:1. Sensory panellists had some experience in sensory evaluation for at least 1 year and gave informed consent to participate in the sensory testing of this study (Liu et al., 2020). They were all healthy, non-smoking, taste and smell-free panellists. According to the test requirements, the colour (Shiny X1), oil slick (Fat X2), aroma (Aron X3), taste (Taste X4) and umami (Umam X5) were scored, respectively, and the corresponding weights were based on the first five evaluation indicators. That was, the total score X = 0.15X1 + 0.15X2 + 0.2X3 + 0.35X4 + 0.15X5, where X1, X2, X3, X4 and X5 represent each indicator.
Physical and chemical indicators
Crude protein and Crude fat were analyzed using the method of James (2013), Kadim et al. (2009), Hammad et al. (2019) and Hammad et al. (2021). Turbidity and pH were analyzed using the method of Pérez-Baltar et al. (2020) and Lai et al. (2022).
Free fatty acid
The 7890B-5977B GC–MS instrument (Agilent, Palo Alto, USA) was used to detect the sample (Liu et al., 2019). 50 μL sample was put in a microcentrifuge tube, and then 430 μL extract (isopropanol: n-hexane, volume ratio 2:3) and 20 μL internal standard (1 mg L−1, dissolved in n-hexane) were added to the sample. After the mixed solution was vortexed for 10 s, steel balls were added and treated with a 45 Hz grinder for 4 min, and before being placed in an ice bath for ultrasonic treatment for 5 min. The temperature of the sample inlet, ion source and transmission line were 240 °C, 230 °C and 240 °C, respectively.
Small-molecular metabolites
A 100 μL sample was put in a microcentrifuge tube, and then an extraction solution, including an isotope-labelled internal standard mixture, was put into the sample. Finally, the supernatant was transferred to the vial for on-machine testing, and another equal volume of supernatant was taken from all samples and mixed into QC samples for on-board testing. A vanquish (Thermo Fisher Scientific) ultra-high performance liquid chromatograph was used for analysis. The target compounds were separated on a Waters ACQUITY UPLC BEH Amide (2.1 mm × 100 mm, 1.7 μm) liquid chromatography column (Ding et al., 2021).
Volatile flavour compounds
A 3 mL chicken broth sample was placed into a 20 mL headspace glass sampling vial and incubated at 80 °C for 20 min. The sample was separated by GC–IMS (FlavourSpec®, G.A.S., Dortmund, Germany) equipped with an FS-SE-54-CB-1 column (15 m × 0.53 mm) at 60 °C. Nitrogen was used as the carrier gas, and the sample injection volume was 500 μL. The flavour components were driven to the ionisation chamber and ionised in positive ion mode by a 3H ionisation source (3000 MBq activity), while the drift tube was operated at a constant voltage (5 kV) at 45 °C, and the nitrogen flow rate was 150 mL min−1 (Xun et al., 2020).
Polypeptide
A Q-Exactive HF mass spectrometer coupled to an EASY-Nano-LC 1200 HPLC system (Thermo Fisher Scientific, MA, USA) was used to identify polypeptides (Zhuang et al., 2016). 2 μL of the peptides were loaded onto the analytical column (Acclaim PepMap C18, 75 μm × 15 cm) and separated using solvent B with a 60 min linear gradient of 5%–30% at a speed of 300 nL min−1 at 40 °C (A: aqueous 0.1% formic acid, B: 100% acetonitrile/0.1% formic acid). For MS/MS, the ten most abundant multiple-charged ions were scanned for fragmentation on the high-energy collision dissociation (HCD) at a target value of 1 × 10⁵ charges or a maximum acquisition time of 100 ms. After the mass spectrometry scanning was completed, a general map of the mass spectrum signal was obtained. Mass spectral raw files were database searched using MaxQuant (version 1.6.10.43). The analysis results were compared in the Uniprot database, and finally, the detected polypeptides were qualitatively and quantitatively analysed.
Statistical analysis
By the design principle of random grouping, six parallel experiments were designed for each trial group, with data expressed as mean ± standard deviation. SPSS 21.0 software, one-way ANOVA and Duncan's multiple comparisons were used to analyse the data (Yu et al., 2020b, 2021a). MSD Chem station software was used to deal with free fatty acids. Volatile flavour compounds were measured using GC–IMS Library Search software, and heat maps and cluster analysis were drawn using MetaboAnalyst 5.0 (Xun et al., 2020; Ding et al., 2021).
Results and discussion
Analysis of sensory quality
Combined with the scoring results of six sensory indicators (colour, oil slick, aroma, taste, umami and overall acceptance), the chicken broth assisted stewing with 600 W ultrasound had the highest sensory quality among all treatment groups (Figure S1) (P < 0.05). Ultrasonic technology can promote the interaction among various components in meat, and the cavitation effect and mechanical force generated by high-intensity ultrasound can accelerate the Maillard reaction. Ultrasound-assisted frying increased the content of seven free amino acids in all the fried meatballs (Zhang et al., 2020a). Moreover, ultrasonic treatment within 400 W had an active role in the formation of nucleotides and could significantly enhance the total taste of fried meatballs (Zhang et al., 2020a). Chen et al. (2020c) also showed that ultrasonic pre-treatment was helpful to increase the content of 5′-nucleotides of umami substances. Ultrasound can promote phenolic modification and the Maillard reaction, hence, varying the colour of products and bioavailability (Chen et al., 2020b, 2020c).
Analysis of physicochemical indexes
With the increase in ultrasonic power, the pH value decreased first and then increased, and the pH value was the lowest in the 600 W ultrasonic treatment group (Figure S2). Compared with the 0 W control group, the pH value of the chicken soup braised after ultrasonic treatment first showed a trend of decrease, which was mainly caused by the decomposition and fracture of proteins under the action of ultrasonic cavitation and the reduction of basic groups in amino acid residues (Dong et al., 2019). Ultrasonic can also catalyse the Maillard reaction and promote the generation of organic acids such as formic acid in the chicken, which can also result in a lower pH value. After the initial structure of a protein is destroyed by strong cavitation from ultrasound, the most common non-covalent interactions in food matrices are disrupted, such as hydrophobic interactions, electrostatic forces and hydrogen bonds, resulting in hydrophobic groups in the protein structure being exposed, thereby, enhancing the hydrophobic forces among food components (Ma et al., 2020; Chen et al., 2022b). With the increase of the ultrasonic treatment power to 600 W, the pH value of chicken broth increased, and we speculated that it may be due to the mechanical effect of the ultrasonic wave that destroys the noncovalent bond force of the protein and loosens the protein structure, resulting in the breakage of chicken myofibrils and the release of more other substances into the chicken broth (Omura et al., 2020).
With the increase in ultrasonic power, the crude fat content of chicken broth first increased and then decreased. The crude fat content of chicken broth in the 720 W ultrasonic treatment group was the highest, nearly three times higher than that in the control group, and increased by 80.25%, 6.57% and 4.29% (P < 0.05) separately, compared with the 480, 600 and 840 W ultrasonic treatment groups. In this experiment, the crude protein content showed a trend of decreasing first and then increasing, and the highest value was 1.27 times that of the control group in the 600 W ultrasound treatment group, 41.67%, 6.25% and 17.24% higher than those in the 400, 720 and 840 W ultrasound treatment groups, respectively (P < 0.05). This may be because the chicken fat was broken down, further forming the flavour of the chicken soup (Bakre & Jaiyeoba, 2009). Ultrasound treatment can increase the distance among myofibrils, and the cavitation effect produced by high-intensity ultrasound causes changes in the conformation and physicochemical properties of protein molecules, promoting protein degradation into other substances such as polypeptides, oligopeptides and small molecule compounds, resulting in a decrease in content. Zou et al. (2022) have demonstrated the fact that ultrasound treatment promoted the release of salt-soluble proteins, improved the texture indicators of chicken (reduced hardness, increased elasticity), and encapsulated soluble proteins on the droplet surface. The cavitation effect of ultrasound can change the protein structure and denature the protein by decreasing or increasing the content of random curling, α-helix, β-folding and β-turning (Zhang et al., 2020b). The turbidity of chicken soup grew gradually with the increase in ultrasonic power, in the treatment group of 840 W reached the maximum value. The increase in turbidity of chicken broth may be due to the looseness of the internal structure of chicken meat caused by the increase in ultrasonic treatment power so that substances are constantly released into the chicken broth during the stewing process (Suresh et al., 2020).
Analysis of free fatty acid composition
A total of fifteen free fatty acids were found in the chicken broth, of which palmitic acid and stearic acid had fairly high concentrations (Table 1). This result is consistent with previous studies (Nkukwana et al., 2014; Yu et al., 2021a). The concentration of palmitic acid in the 600 W ultrasonic treatment group was the highest in contrast with the control group, reaching 20.69 μg mL−1, and its proportion was 27.18%. The concentration of stearic acid was 19.92 μg mL−1, accounting for 26.17% of the total fatty acids. Compared with the chicken broth of other treatment groups, the SFA concentration of the chicken broth of the 600 W ultrasonic treatment group was significantly higher than that of the control group (23.57%, P < 0.05). The concentration of MUFA in chicken broth in the control group was the highest, reaching 9.58 μg mL−1, which was 15.42% and 87.11% higher than that of the chicken broth in the 480 W and 600 W ultrasonic treatment groups, respectively. The concentration of PUFA was the highest in the chicken broth of the 600 W ultrasonic treatment group, reaching 26.07 μg mL−1, which was higher in contrast with the control group (40.70%, P < 0.05). Unsaturated fatty acids have the function of lowering serum total cholesterol and LDL cholesterol levels and raising serum HDL, while saturated fatty acids raise blood cholesterol levels, while polyunsaturated fatty acids lower blood cholesterol and have the effect of lowering LDL cholesterol (Shoreac et al., 2018; Al-Shaer et al., 2021; Asefy et al., 2021). The concentration of SFAS and PUFAS rose first and then decreased with the increase in ultrasonic power, while the concentration of monounsaturated fatty acids gradually decreased. The increase in free fatty acids content was caused by the decomposition of fat, and the decrease may be due to the decomposition of free fatty acids in chicken meat into other substances after ultrasonic treatment, resulting in the reduction of free fatty acids released into the chicken broth (Almela et al., 2010). It may be that the increase in ultrasonic power causes the decomposition of fatty acids into other substances, leading to a decrease in the content (Chen et al., 2020a). In contrast with the control group, pre-ultrasonication led to a gigantic growth in the concentration of saturated fatty acids in chicken broth samples, with an increasing range of 1.2%–23.6%. The ultrasonic cavitation effect causes the water molecules in the chicken to break down to form H+ and hydroxyl radicals, thus promoting chemical reactions, and the free radicals formed during this process may lead to an increase in free fatty acids (Omura et al., 2020).
Determination of free fatty acids in chicken broth of different power ultrasonic treatment groups (μg mL−1)
| Fatty acid | Control group | 480 W | 600 W | 720 W | 840 W |
|---|---|---|---|---|---|
| C12:0 | 0.20 ± 0.02ab | 0.21 ± 0.02ab | 0.22 ± 0.00a | 0.20 ± 0.02ab | 0.18 ± 0.02b |
| C13:0 | 0.46 ± 0.02c | 0.56 ± 0.00ab | 0.57 ± 0.04a | 0.55 ± 0.04ab | 0.49 ± 0.04bc |
| C14:0 | 0.60 ± 0.04a | 0.60 ± 0.06ab | 0.67 ± 0.04ab | 0.62 ± 0.02ab | 0.55 ± 0.02b |
| C14:1 | 0.31 ± 0.04a | 0.28 ± 0.02a | 0.30 ± 0.04a | 0.30 ± 0.04a | 0.30 ± 0.07a |
| C15:0 | 0.86 ± 0.25a | 0.88 ± 0.09a | 0.79 ± 0.21a | 0.86 ± 0.06a | 0.91 ± 0.04a |
| C16:0 | 16.82 ± 1.08b | 17.13 ± 0.69b | 20.69 ± 2.14a | 18.55 ± 0.57ab | 16.99 ± 0.77b |
| C16:1 | 0.65 ± 0.08a | 0.80 ± 0.17a | 0.79 ± 0.07a | 0.76 ± 0.27a | 0.55 ± 0.02a |
| C17:0 | 1.18 ± 0.01a | 1.19 ± 0.01ab | 1.20 ± 0.02ab | 1.19 ± 0.01ab | 1.18 ± 0.00b |
| C18:0 | 15.48 ± 1.31b | 15.81 ± 0.70b | 19.92 ± 1.18a | 16.58 ± 0.58b | 15.63 ± 0.63b |
| C18:1 | 5.71 ± 0.71a | 5.24 ± 0.82a | 6.19 ± 1.66a | 5.51 ± 0.37a | 3.24 ± 0.36b |
| C18:2 | 1.71 ± 0.37c | 3.09 ± 1.05ab | 4.20 ± 0.83a | 2.59 ± 0.23bc | 2.41 ± 0.11bc |
| C18:3 | 2.15 ± 0.03ab | 2.14 ± 0.00ab | 2.23 ± 0.06a | 2.20 ± 0.08ab | 2.11 ± 0.02b |
| C19:1 | 2.91 ± 0.32a | 1.98 ± 0.40b | 2.78 ± 0.12a | 2.53 ± 0.28a | 2.68 ± 0.10a |
| C20:0 | 0.77 ± 0.17a | 0.87 ± 0.02a | 0.87 ± 0.02a | 0.87 ± 0.02a | 0.86 ± 0.02a |
| C20:4 | 0.57 ± 0.07c | 1.60 ± 0.58a | 1.08 ± 0.09ab | 0.98 ± 0.31bc | 0.84 ± 0.03bc |
| ∑SFA | 36.36 ± 2.46b | 37.23 ± 0.88b | 44.93 ± 3.48a | 39.41 ± 0.98b | 36.78 ± 1.40b |
| ∑MUFA | 9.58 ± 0.55a | 8.30 ± 1.00b | 5.12 ± 0.07c | 4.75 ± 0.45c | 4.57 ± 0.16c |
| ∑PUFA | 18.53 ± 1.39c | 21.37 ± 1.68b | 26.07 ± 1.81a | 21.02 ± 1.01bc | 19.74 ± 0.68bc |
| ∑PUFA/∑SFA | 0.51 | 0.57 | 0.58 | 0.53 | 0.54 |
Analysis of small molecule compounds
By the full spectrum identification of chicken broth samples based on the Metlin database, 530 and 236 metabolites were demonstrated in ESI+ and ESI− detection patterns, basically containing amino acids and their derivatives, glycerophospholipids, peptides, organic acids, alkaloids, carbohydrates, nucleosides and other small molecule compounds (Figure S3a,b).
There were significant differences among the test groups in different modes (Figure S4a,b). However, this method cannot ignore the intra-group errors, which indicated that there was a trend of sample separation. As a result, the PLS–DA model was used to explain the samples from different treatment groups (Figure S4c–f). The R2 values of the positive and negative models were 0.990 and 0.989, respectively, and the Q2 values were 0.967 and 0.947, separately, figuring that five groups could be distinguished, which proved the repeatability and reliability of the experiment. In the ESI+ mode, the differential compounds among the groups were creatinine, taurine, nicotinamide, goose hemp, choline, etc., while in the ESI-mode, the differential compounds among the groups were inosine, taurine, hypoxanthine, guanine, L-lactic acid, succinic acid, etc. These compounds can be used as metabolic markers in the chicken broth of different power ultrasonic experiment groups, which may be obtained from the PLS–DA loading diagram (Figure S5a,b) and the VIP map of PLS–DA (Figure S5c,d). This outcome is not contradictory to previous research (Fedorov et al., 2021).
The Metabo Analyst 5.0 platform was used to analyse the changes in differential compounds in the chicken broth after different powers of ultrasonic treatment. The results showed that most of the differential metabolites were higher in the 600, 720 and 840 W ultrasonic treatment groups. The compounds showed significant differences among the ultrasonic treatment groups, in which the control group and the 480 W ultrasound treatment group were clustered into one layer, and the 720 W ultrasound group and the 840 W ultrasound group were clustered into one layer (Fig. 1a). This result showed that the concentration of some compounds in the chicken broth of each ultrasonic treatment group had a similar expression trend, which showed a resemblance to the results of PCA.
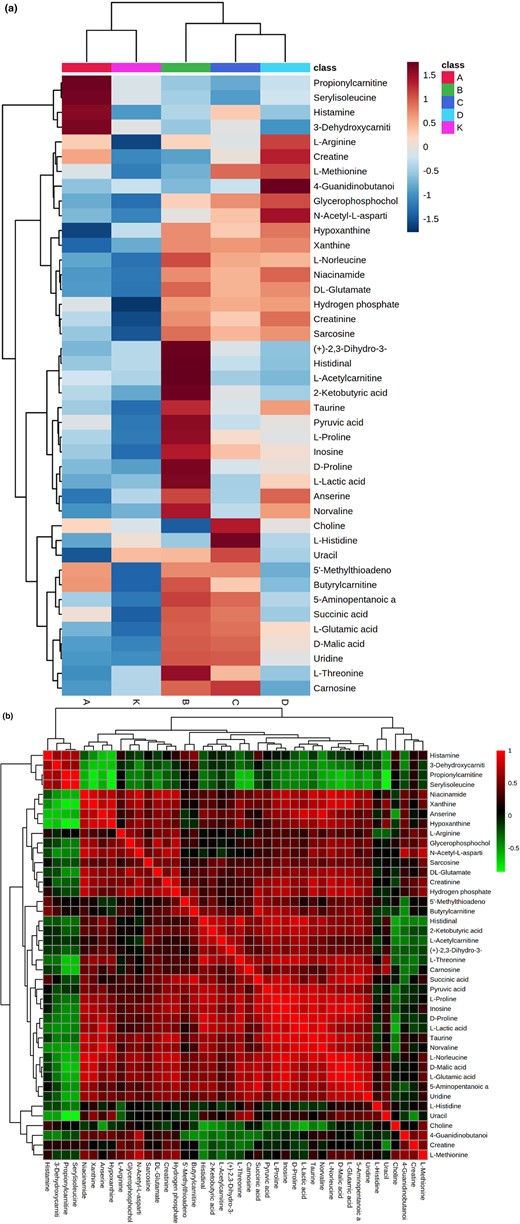
Heat map visualisation of differential metabolites of small molecule compounds in chicken broth samples treated by different power ultrasound (a), and correlation map between differential metabolites (b). Each square indicates the Pearson's correlation coefficient values (r). Positive (0 < r < 1) and negative (−1 < r < 0) correlations are indicated in red and green, respectively. A, 480 W ultrasonic treatment group; B, 600 W ultrasonic treatment group; C, 720 W ultrasonic treatment group; D, 840 W ultrasonic treatment group; K, control group.
The amino acids and their derivatives concentration were the highest of the five groups, and many amino acids have distinct tastes and can be converted into volatile flavour substances via the Maillard reaction (Fig. 1b) (Ortuño et al., 2021). L-glutamic acid was detected in each group of chicken broths, and glutamic acid has been confirmed to be an important source of umami in chicken broth. Some scholars have deduced that peptide components have vastly superior performance to the delicious flavour of chicken broth, which is mainly composed of sweet and umami amino acids, such as glutamine, alanine and serine (Kong et al., 2017). After pre-ultrasonication, the concentration of umami substances in chicken broth increased, which may be due to the more complete evacuation of chicken protein and peptide structure after ultrasonic bubble cavitation and mechanical force, exposing amino groups to the surface and decomposing polypeptides into small molecular peptides.
Analysis of volatile flavour compounds
The types of volatile flavour compounds produced by different powers of pre-ultrasonication chicken broth were alike (Fig. 2a). The characteristic peak location points of volatile compounds in chicken broth samples are shown in Fig. 2b. The blue area indicates that the substance contained in the sample is low, and the red area shows that the substance contained in the sample is high. The deeper the colour, the bigger the difference (Guo et al., 2018).
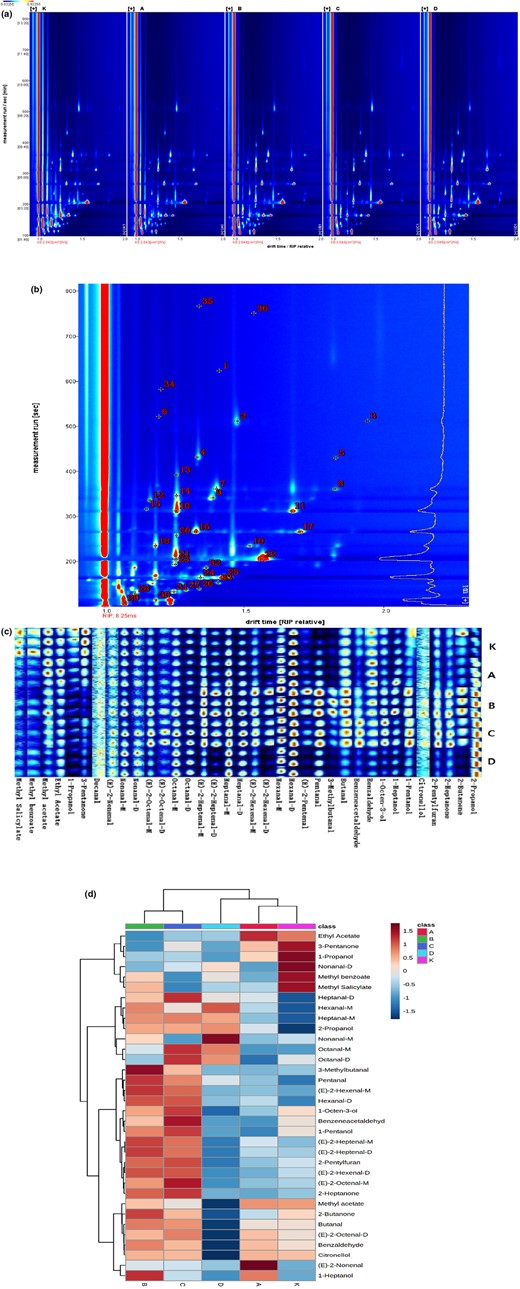
GC–IMS profiles of volatile compounds in chicken broth samples treated by different power ultrasound (a), characteristic peak location points of volatile compounds in chicken broth samples (b), fingerprint of volatile flavour compounds in chicken broth samples (c) and heat map of volatile flavour compounds in chicken broth samples under different ultrasonic power (d). A, 480 W ultrasonic treatment group; B, 600 W ultrasonic treatment group; C, 720 W ultrasonic treatment group; D, 840 W ultrasonic treatment group; K, control group.
Thirty-six volatile compounds were found in the study, containing twenty-two aldehydes, six alcohols, four esters, three ketones and one furan, which all influence the final flavour quality of chicken products. They have been confirmed as chicken aroma compounds (Shen et al., 2016). Aldehydes are usually from the oxidative decomposition of unsaturated fatty acids, which can give the meat a special fat flavour, and the threshold of these substances is lower than that of other flavour substances (Barola et al., 2020). In this study, hexanal, (E)-2-heptenal, octanal, nonanal and alkenal were the chief aldehyde volatile flavour substances in the five groups of chicken broth.
The Gallery Plot plug-in of LAV software was carried out to generate fingerprints, which can be beneficial to further compare the differences in volatile flavour compounds in chicken broth with different powers of pre-ultrasonication (Fig. 2c). The concentration of methyl salicylate, methyl benzoate, methyl acetate, ethyl acetate, 1-propanol, 3-pentanone, etc., in the chicken broth decreased after ultrasonic treatment, and most of them were esters in comparison with the control group. The peak intensity values of methyl salicylate, methyl benzoate and ethyl acetate in each ultrasonic treatment group were obviously below those in the contrast group (P < 0.05). The peak intensity values of methyl salicylate were not diverse in the middle of the four treatment groups, indicating that pre-ultrasonication influenced the concentration of methyl salicylate, but different ultrasonic power treatments had little effect on the concentration of this substance in chicken broth (Table S2).
The volatile flavour compounds in the 600 and 720 W ultrasonic groups belonged to the same group, indicating that the flavours of chicken broth in these two groups were similar (Fig. 2d). Among them, aldehydes were the vital flavour substances in chicken broth, including decanal, trans-2-nonenal, trans-2-pentenal, pentanal, 3-methylbutanal, butanal, benzaldehyde, etc. The concentration of benzaldehyde in the chicken broth of 480 W pre-ultrasonication group was higher, while the concentration of other flavour compounds in the chicken broth of 600 and 720 W pre-ultrasonication groups was higher, showing that the flavour of the chicken broth was greater when the ultrasonic power was 600 and 720 W. Ultrasound may improve the flavour compounds of chicken broth, which is similar to previous studies (Teng et al., 2019; Alves et al., 2020; Zhou et al., 2021).
Analysis of polypeptides
MS peptide sequence analysis was performed on the fractions with molecular masses less than 3 kD using statistical methods, and a total of 249 peptide sequences were obtained in the control group and the 600 W ultrasonic treatment group (Figure S6a,b). To more intuitively observe the changes of the polypeptides in the chicken broth before and after ultrasonic treatment, the polypeptide sequences were analysed using a volcano plot, and the results are shown in Fig. 3.
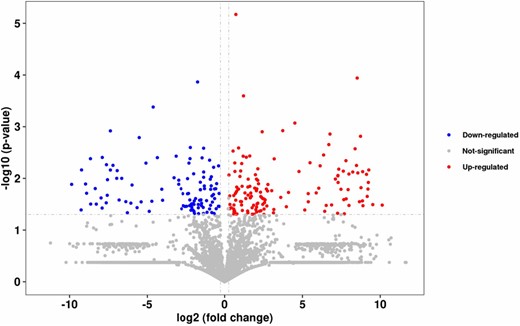
Volcano diagram of differentially expressed polypeptides in chicken broth.
The ratio of sweet and umami amino acids to the total amino acids of the respective polypeptides was calculated (Figure S7), and the proportion of sweet and umami amino acids was the highest in the range of 50%–59%, with 76 sequences. There were 156 peptides in which the proportion of sweet amino acid and umami amino acid was more than 50%, accounting for 63% of the total peptides, indicating that the composition of a high proportion of sweet and umami amino acids was one of the key factors for the umami taste of polypeptides. There were six peptides with sweet and umami amino acids in the range of 80%–89%, namely, ASMTDQQAEAR, DAIMDAIAGQAQAQG, AASEDGAAQPKAEEQQQSIGTR, DELEEEEAAETH, SQDAIMDAIAGQAQAQG and GEEQNKEALQDVEDENQ. Compared with the control group, the concentration of sweet and umami amino acids in chicken broth increased by up to 100% after the six peptides were treated with ultrasound, indicating that pre-ultrasonication was helpful to enhance the umami substances in chicken soup (Chen et al., 2022b).
Ultrasound accelerates the Maillard reaction, minimises the bitterness of the enzymatic hydrolysate, and weakens the content of bitter amino acids by 18.44% (Chen et al., 2020c). And Li et al. (2020) found that under ultrasonic pretreatment, the concentration of umami-flavoured amino acids produced by low-molecular weight polypeptides was the highest. Similar results were obtained in this experimental study, namely, that ultrasonic treatment can increase the proportion and concentration of sweet and umami amino acids, thereby, increasing the sweetness and umami of chicken broth.
Conclusion
The sensory evaluation score of the chicken broth in the 600 W ultrasonic treatment group was higher than that in other groups. Palmitic acid and stearic acid were the main free fatty acids in chicken broth, and 530 and 236 small molecule metabolites were identified from chicken broth. thirty-six volatile compounds were identified in chicken broth, mainly aldehydes. There were 156 peptides with a ratio of sweet amino acids and umami amino acids greater than 50%, accounting for 63% of the total peptides. Pre-ultrasonication can increase the concentration of sweet and umami peptides in chicken broth, demonstrating that pre-ultrasonication plays a role in the formation of umami substances in chicken broth. These results offer rational theoretical guidance for the deep processing of Chinese local chickens, and then the work can exploit the molecular mechanism of the formation of flavour compounds and umami substances in Chinese local chickens.
Acknowledgments
This work was supported by the National Natural Science Foundation of China Regional Science Found Project (31960511) and the Yunnan Young and Middle-aged Academic and Technical Leader Reserve Talent Project (202105 AC160068).
Author contributions
Rong Jia: Conceptualization (lead); data curation (equal); investigation (equal); methodology (equal); project administration (equal); resources (equal); software (equal); visualization (equal); writing – original draft (lead); writing – review and editing (lead). Xiaoyan Ying: Conceptualization (equal); data curation (lead); formal analysis (equal); methodology (equal); resources (lead); software (equal); validation (equal); visualization (equal). Guozhou Liao: Conceptualization (equal); data curation (equal); funding acquisition (equal); investigation (equal); methodology (equal); project administration (equal); resources (equal); software (equal); supervision (equal); validation (lead); writing – review and editing (equal). Zijiang Yang: Data curation (equal); investigation (equal); project administration (equal); software (equal). Dahai Gu: Funding acquisition (equal); project administration (equal); supervision (equal). Yuehong Pu: Funding acquisition (equal); project administration (equal); software (equal). Ge Changrong: Funding acquisition (equal); project administration (equal); software (equal). Ming Huang: Funding acquisition (equal); project administration (equal); supervision (equal). Guiying Wang: Funding acquisition (equal); methodology (equal); project administration (equal); supervision (equal).
Ethical guidelines statement
Ethics approval was not required for this researcher.
Peer review
The peer review history for this article is available at https://www.webofscience.com/api/gateway/wos/peer-review/10.1111/ijfs.16560.
Data availability statement
Data Availability StatementThe data that support the findings of this study are available from the corresponding author upon reasonable request.
References
In this article, the metabolic characteristics during the growth and development of Wuding chicken were discussed. It provides a certain basis for our research.
In this article, the metabolic characteristics and fatty acid composition during the processing of Wuding chicken were discussed. It provides a certain basis for our research.
In this article, the fatty acid composition of Wuding chicken was discussed. It provides a certain basis for our research.
This is the previous research of our research group, which has a certain correlation with the content of this research.
This is the previous research of our research group, which has a certain correlation with the content of this research.
Author notes
Rong Jia and Xiaoyan Yin contributed equally to this work and should be regarded as co-first authors.
