


Abstract
Plant-based probiotic beverages are gaining popularity among vegans, lactose intolerants, and those with milk-protein allergies. Sorghum bicolor is a cereal rich in phytochemicals that can promote probiotic growth when malted. The packaging type may impact the characteristics and probiotic survival in plant-based probiotic beverages. This study aimed to evaluate the impact of different packaging materials (polyethylene terephthalate (PET), high-density polyethylene (HDPE), and glass) on quality parameters, probiotic survival (Lacticaseibacillus casei), and sensory acceptance of strawberry-flavoured probiotic sorghum-based beverages. The packaging type did not affect the product's chemical composition, quality parameters, antioxidant activity, or probiotic survival. However, the products stored in PET and HDPE packaging showed a lower consistency index, higher dissolved oxygen concentration, improved probiotic survival to simulated gastrointestinal conditions, and better sensory acceptance. Malted S. bicolor can be used to produce probiotic beverages with adequate probiotic survival and physicochemical parameters and reasonable sensory acceptance during 28 days of refrigerated storage.
Introduction
Dairy consumption has decreased in recent years, while veganism has been on the rise (Lopes et al., 2020). According to The Vegan Society (2021), the number of vegans in Britain quadrupled between 2014 and 2019, and in 2021 a study conducted by The Grocer (2021) showed that 15% of British people had eliminated dairy products from their diet and another 42% have reduced their intake.
When discussing foods that benefit health, probiotic beverages stand out for their benefits, such as reducing lactose intolerance and preventing intestinal dysbiosis (Guedes et al., 2021). In addition, plant-based probiotic beverages have also shown improvements in consumers' lipid profiles, diabetes control, and immunomodulatory properties (Lopes et al., 2020; Pimentel et al., 2021) when a certain concentration of live cells reaches the gut (Yang et al., 2020; Rasika et al., 2021).
Probiotic health effects are strain-specific, and the administration of foods supplemented with Lacticaseibacillus casei has demonstrated anti-hypertensive effects (Sperry et al., 2018), microbiota modulation (Casarotti et al., 2020), postprandial glycaemia control (Grom et al., 2020), and antioxidant properties (Vasconcelos et al., 2019). However, this probiotic culture has been mainly used in dairy products, such as fermented and non-fermented whey beverages (Cordeiro et al., 2019; Grom et al., 2020), cheeses (Sperry et al., 2018; Vasconcelos et al., 2019), yoghurts (Velasco et al., 2019), and ice cream (Balthazar et al., 2018). In non-dairy products, it was mainly used in fruit juices (Miranda et al., 2019a, 2019b) and almond, rice berry, and sesame fermented beverages (Kemsawasd & Chaikham, 2020; Fernandes et al., 2021).
Sorghum (Sorghum bicolor) is an important food crop in several parts of the world, with the USA, Nigeria, and Ethiopia leading the production and Brazil occupying the seventh place (Food and Agriculture Organization of the United Nations, 2021). This gluten-free cereal is rich in phytochemicals beneficial to human health, such as tannins, flavonoids, phenolic acids, polycosanols, and phytosterols (Kil et al., 2009). At the same time, strawberry (Fragaria x ananassa) is one of the most important fruits worldwide, with a double production than the other fruit berries combined. Its use is based on flavour, volatile compound profiles, and nutritional properties, which consumers desire (Fierascu et al., 2020). Strawberry accounted for the largest market share of flavoured yogurts and fermented beverages (Grand View Research, 2020). In this way, we hypothesised that malted sorghum might be a suitable raw material for processing strawberry-flavoured probiotic fermented beverages, as sorghum is still underexplored (Ogunremi et al., 2015; Sukarminah et al., 2019).
Packaging is essential in maintaining food products' quality during storage, and beverages are commonly marketed in glass and plastic bottles (da Cruz et al., 2007; Kumar et al., 2017). Almost all probiotic strains are anaerobic or microaerophilic. Therefore, the dissolved oxygen level and packaging type may impact the probiotic survival in food products (da Cruz et al., 2007; Cruz et al., 2013; Tripathi & Giri, 2014). Previous studies have evaluated the impact of packaging type on probiotic survival in dairy products (Talwalkar et al., 2004; Cruz et al., 2013; Ranadheera et al., 2013; Kumar et al., 2017). In non-dairy products, this evaluation was performed in fruit juices (Pimentel et al., 2015), but only polyethylene terephthalate (PET) was evaluated.
Considering that plant-based beverages are usually commercialised in PET, high-density polyethylene (HDPE), and glass bottles, this study aimed to evaluate the influence of different packaging types (PET, HDPE, and glass) on the quality parameters, probiotic survival (L. casei), and sensory acceptance of strawberry-flavoured probiotic sorghum-based beverages.
Materials and methods
Materials
Sorghum bicolor grains were purchased from the Cocamar Agroindustrial Cooperative in Maringá (Paraná, Brazil). The pasteurised strawberry pulp was obtained from a local supermarket chain. The probiotic L. casei culture was LYOFAST BGP 93 (SACCO, Brazil), lot C304901A.
Sorghum malt-based probiotic beverage processing
Malting and mashing of sorghum grains were performed according to previous studies (Bianchi et al., 2015; Sawadogo-Lingani et al., 2021). The description of the methodology for malting and mashing can be found in the Appendix S1.
After mashing the wort, 6% sucrose was added, and the wort was boiled for another 10 min. The wort was cooled to 37 °C to add the probiotic culture, at a concentration of 0.01 g L−1, according to the manufacturer's recommendation.
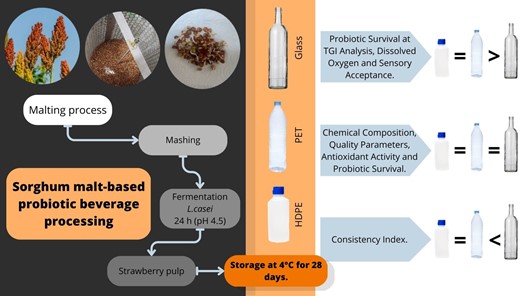
The fermentation occurred in a bacteriological oven at 37 °C until pH 4.5 (24 h). Next, 250 mL of pasteurised strawberry pulp was added per litre of fermented wort, and the fermented beverage was filled into 100 mL glass, PET, and HDPE bottles. All packages were refrigerated at 4 °C during the analysis period (28 days).
Chemical composition
The moisture, protein, lipids, ash, and carbohydrates analyses were performed according to the Association of Official Analytical Chemists Guidelines (AOAC, 2004).
Physicochemical parameters
The pH values were determined using a digital potentiometer (MS Technopon®, Piracicaba, Brazil). The colour parameters (L*, a*, and b*) were determined using a colorimeter (Konica Minolta®, model CR-410, Tokyo, Japan). The total soluble solids (TSS) content was determined using a digital refractometer (Instruterm®, São Paulo, Brazil), and the results were expressed as °Brix. The titratable acidity was determined from a titrimetric method, using 0.1 N sodium hydroxide and a 1% phenolphthalein ethanol solution as an indicator, and it was expressed as per cent lactic acid (Chavan et al., 2018). An oximeter was used for dissolved oxygen analysis, and measurements followed the methodology proposed by Cruz et al. (2010).
Rheological properties
The rheological properties (consistency index and flow behaviour) were evaluated using a viscometer (model DV2T, Brookfield, Middleboro, Massachusetts, USA) with an SC4-18 spindle at a constant temperature of 11 °C. Two rheological measurements were performed, the first at a rising shear rate (0-300 s−1) and the second at decreasing shear rate (300-0 s−1) (Miranda et al., 2019a). The data (first curve) were adjusted to the power-law model using non-linear regression analysis and the Rheocalc T1.2.19 software.
Antioxidant activity
The antioxidant activity was determined following the methodology of Alves et al. (2008). The results of DPPH (1,1-diphenyl-2-picrylhydrazyl) and ABTS (2,2′-azinobis-(3-ethylbenzothiazoline-6-sulfonate)) analysis were expressed in percentage.
Probiotic viability in the product and in simulated gastrointestinal conditions (TGI)
Probiotic viability and probiotic survival to simulated gastrointestinal conditions followed methodology according to Costa et al. (2019). A description of the methodology can be found in the Appendix S1.
Sensory analysis
This study was approved by the Standing Committee on Ethics in Human Research of the State University of Maringá (Number: 60690822.3.0000.010). Contaminant analysis was performed for all samples, following the RDC No. 12 of January 2, 2001, related to microbiological quality control analyses of juices, soft drinks, and other non-alcoholic beverages to ensure sanitary quality (BRASIL, 2001). The sensory analysis was performed at the Instituto Federal do Paraná (IFPR – PR). The consumer panel consisted of eighty untrained tasters of both genders and mainly young (age medium 18). The consumers received six samples (three samples from days 1 and 28, 30 mL each, 4 °C) in completely randomised blocks and in white containers randomly coded with three-digit numbers. The acceptance test (colour, aroma, flavour, and global acceptance attributes) was conducted using a 9-point hedonic scale (1 = dislike extremely and 9 = like extremely) (Pimentel et al., 2015).
Experimental design and statistical analysis
Chemical compositions were evaluated in triplicates on the 1st day of storage. The physicochemical parameters were evaluated in triplicates at 1, 14, and 28 days of refrigerated storage. In addition, the analyses of rheological parameters, antioxidant activity, and probiotic survival (product and TGI) were evaluated in triplicates at the 1 and 28-day storage periods. For probiotic survival (product and TGI), plates were obtained from 10−1–10−8 dilutions in triplicates, and the enumeration was performed on those with 20–200 colonies. Finally, the sensory analysis occurred during the 1 and 28-day refrigerated storage periods. The experiment followed an entirely randomised design, while the sensory analysis followed an entirely randomised block design, preserving the anonymity of the participants. The data were compiled in an Excel spreadsheet and submitted to analysis of variance (Anova) and Tukey's test (P = 0.05).
Results and discussion
Development of a sorghum malt-based probiotic beverage
The sorghum malting process requires a higher malting rate than other cereals because this grain's aleurone layer is thicker, hindering water absorption and directly affecting the quality of green sorghum malt (Hassani et al., 2015). Preliminary tests were conducted to determine the production parameters of sorghum malt. Using an automatic malt grader, a germination content of approximately 55.5% of green sorghum malt was achieved, which was used to produce sorghum wort after kilning.
Chemical composition
The probiotic beverages showed chemical composition in the following range (g per 100 mL): moisture (88.03–88.06), proteins (0.03), lipids (1.69–1.84), ash (0.06–0.09), and carbohydrates (10.01–10.16, Table 1). The chemical composition of the beverage was compatible with the sorghum chemical composition and the proportion of water used in the beverage formulation (Queiroz et al., 2015). The packaging type did not influence the chemical composition of the products (P > 0.05). Previous studies have already reported no significant impact of packages on the chemical composition of probiotic products (Ranadheera et al., 2013; Pimentel et al., 2015).
Chemical composition of the sorghum malt-based probiotic drink
| Parameter (g/100 mL) | Glass | PET | HDPE |
|---|---|---|---|
| Proteins | 0.03 ± 0.01a | 0.03 ± 0.00a | 0.03 ± 0.00a |
| Lipids | 1.73 ± 0.08a | 1.84 ± 0.10a | 1.69 ± 0.20a |
| Moisture | 88.05 ± 0.05a | 88.06 ± 0.06a | 88.03 ± 0.50a |
| Ash | 0.06 ± 0.03a | 0.06 ± 0.02a | 0.09 ± 0.01a |
| Carbohydrates | 10.14 ± 0.11a | 10.01 ± 0.10a | 10.16 ± 0.12a |
Means ± standard deviation with similar letters at the row indicate non-significant differences (P > 0.05).
Physicochemical properties
The sorghum beverage before fermentation had a pH close to 6.0. After fermentation, with consequent acidification of the medium by the probiotic culture and the addition of strawberry pulp, the pH values were around 3.71–3.75 (Table 2). Similar pH values have been reported for fermented beverages based on quinoa, Jo's tears, brown rice, milled, and sweet sorghum mash (Aka et al., 2020; Yang et al., 2020).
Physicochemical properties of the sorghum malt-based probiotic beverage in glass, PET and HDPE packaging during refrigerated storage
| Parameter | Times | Glass | PET | HDPE |
|---|---|---|---|---|
| D.O (mg/L) | 1st day | 1.30 ± 0.14Aa | 1.65 ± 0.07Aa | 1.75 ± 0.21Aa |
| 14th day | 2.10 ± 0.07Ba | 2.90 ± 0.17Bb | 3.00 ± 0.10Bb | |
| 28th day | 2.40 ± 0.06Ba | 3.00 ± 0.00Bb | 2.99 ± 0.00Bb | |
| pH | 1st day | 3.75 ± 0.00Ba | 3.75 ± 0.00Ba | 3.71 ± 0.00Ba |
| 14th day | 3.54 ± 0.00Aa | 3.52 ± 0.00Aa | 3.40 ± 0.00Aa | |
| 28th day | 3.51 ± 0.00Aa | 3.45 ± 0.00Aa | 3.50 ± 0.00Aa | |
| TSS (°Brix) | 1st day | 10.13 ± 0.10Aa | 10.13 ± 0.10Aa | 10.07 ± 0.10Aa |
| 14th day | 10.07 ± 0.10Aa | 9.50 ± 0.10Aa | 9.93 ± 0.10Aa | |
| 28th day | 10.17 ± 0.10Aa | 10.13 ± 0.10Aa | 10.17 ± 0.10Aa | |
| Acidity (% of lactic acid) | 1st day | 0.38 ± 0.00Aa | 0.38 ± 0.40Aa | 0.37 ± 0.00Aa |
| 14th day | 0.41 ± 0.00Aa | 0.42 ± 0.00Aa | 0.42 ± 0.00Aa | |
| 28th day | 0.40 ± 0.00Aa | 0.43 ± 0.00Aa | 0.42 ± 0.00Aa | |
| L* | 1st day | 34.89 ± 0.05Aa | 34.88 ± 0.28Aa | 35.10 ± 0.08Aa |
| 14th day | 35.63 ± 0.03Aa | 34.77 ± 0.03Aa | 33.94 ± 0.10Aa | |
| 28th day | 35.35 ± 0.02Aa | 35.63 ± 0.05Aa | 35.45 ± 0.03Aa | |
| a* | 1st day | 2.09 ± 0.03Aa | 2.50 ± 0.03Aa | 2.25 ± 0.06Aa |
| 14th day | 5.11 ± 0.04Ba | 4.87 ± 0.01Ba | 5.10 ± 0.01Ba | |
| 28th day | 5.09 ± 0.05Ba | 5.28 ± 0.03Ba | 5.05 ± 0.03Ba | |
| b* | 1st day | 3.04 ± 0.12Ba | 3.51 ± 0.04Ba | 3.32 ± 0.19Ba |
| 14th day | 1.12 ± 0.05Aa | 1.02 ± 0.01Aa | 1.35 ± 0.05Aa | |
| 28th day | 1.04 ± 0.03Aa | 1.12 ± 0.06Aa | 1.01 ± 0.04Aa |
Means ± standard deviation followed by different uppercase letters in a column indicate significant differences between storage times for the same parameter (P < 0.05). Means ± standard deviation followed by different lowercase letters in a row indicate significant differences between formulations for the same storage time (P < 0.05).
DO, dissolved oxygen index; TSS, total soluble solids.
The titratable acidity was 0.37%–0.42% lactic acid (Table 2). Lactic acid bacteria and probiotic cultures usually tolerate 0.3%–1.9% lactic acid (Rivera-Espinoza & Gallardo-Navarro, 2010; Aspri et al., 2020). In this way, the results suggest that the acidity in sorghum beverages probably would not impact probiotic viability. Similar titratable acidity values have been reported for fermented beverages based on sprouted cereals, legumes, soy milk, red quinoa, and sprouted wheat flour (Mridula & Sharma, 2015; Aparicio-García et al., 2021; Cerdá-Bernad et al., 2022).
Colour is one of the most important attributes due to its influence on consumers' buying decisions (Dridi et al., 2022; Kokwar et al., 2022). The sorghum malt-based probiotic beverage was slightly red (L* = 34–35, a* = 2.09–5.11, and b* = 1.01–3.51, Table 2), the typical colour of strawberry-flavoured products.
The packaging type did not influence the physicochemical properties of the products (pH and TSS values, titratable acidity, and colour parameters; P > 0.05). All beverages showed similar behaviour during storage, with decreases in pH and b* values and increases in a* values (P < 0.05). The post-acidification process can explain the pH decrease, as probiotic cells hydrolyse and use the sugars in the medium, forming organic acids and causing a decrease in pH (Andrade et al., 2019). Changes in pH values are commonly related to changes in colour, as acidity has an important impact on the pigments (Kokwar et al., 2022). The increase in the redness of beverages during storage may be attributed to structural changes in the anthocyanin pigment with reduced pH values (Baria et al., 2021). In more acid conditions, flavylium cation predominates in anthocyanin structures, contributing to the red colours (Tang et al., 2019). The maintenance of titratable acidity may be related to changes in the organic acid profile of the products, with decreases in some acids and increases in others (Costa et al., 2019).
A significant impact of packaging type was observed only for DO, with PET and HDPE products showing a higher DO at the end of storage time (P < 0.05). In this way, plastic packages allowed a higher permeability of oxygen. PET and HDPE are permeable to gases and allow oxygen diffusion into products during storage. In contrast, glass packages have low permeability (Dave & Shah, 1997; Cruz et al., 2013). The PET packaging has 0.23 g mm m−2.day water vapour permeability (at 23 °C and 95% relative humidity) and 1.8 cm3 mm m−2.day.atm oxygen permeability (at 23 °C and 75% relative humidity). At the same time, the HDPE packaging shows 0.02 g mm m−2.day water vapour permeability (at 23 °C and 95% relative humidity) and 42 cm3 mm m−2.day.atm oxygen permeability (at 23 °C and 75% relative humidity) (Hannay, 2002). Anaerobic probiotic cultures, such as Bifidobacterium strains, are very sensitive to oxygen, decreasing their counts. Lactobacillus and amended genera strains are less sensitive, but studies with specific probiotic cultures should be performed (Ranadheera et al., 2013). In this way, the higher DO in plastic packaging may result in decreased probiotic survival.
Antioxidant activity
The packaging type did not influence the antioxidant activity of the products (P > 0.05, Table 3). During storage, there was a significant increase in antioxidant activity (DPPH) in all beverages (P < 0.05). The lower pH values and higher probiotic culture counts during storage may have resulted in the release of bound phenolic compounds through enzymatic processes, increasing antioxidant activity (Assis et al., 2021). Probiotic culture may facilitate the dissociation and cleavage of the bonds between phenolic compounds, leading to the release of monomers with increased antioxidant activity. Furthermore, probiotic enzymes may hydrolyse β-glucosidic bonds, break down ester bonds, and distort the hydroxyl groups in phenolic structures liberating free phenolic compounds and other antioxidant-related compounds (Barros et al., 2020). These results suggest that probiotic counts may have increased during storage, resulting in probably higher biotransformation of phenolic compounds and increased antioxidant activity.
Antioxidant activity and rheological characteristics of the sorghum malt-based probiotic beverage in glass, PET and HDPE packaging during refrigerated storage
| Analysis | Times | Glass | PET | HDPE |
|---|---|---|---|---|
| DPPH (%) | 1st day | 16.05 ± 0.40Aa | 13.59 ± 1.30Aa | 11.79 ± 0.90Aa |
| 28th day | 28.28 ± 0.10Ba | 29.43 ± 0.70Ba | 27.75 ± 1.4Ba | |
| ABTs (%) | 1st day | 39.67 ± 3.20Aa | 37.04 ± 2.60Aa | 37.37 ± 2.50Aa |
| 28th day | 39.06 ± 0.60Aa | 37.46 ± 0.50Aa | 39.72 ± 1.2Aa | |
| K (mPa.s) | 1st day | 36.30 ± 0.71Ba | 31.15 ± 1.20Bb | 28.75 ± 1.48Bb |
| 28th day | 32.50 ± 1.41Aa | 26.00 ± 1.84Ab | 25.85 ± 0.78Ab | |
| F.I (n) | 1st day | 0.69 ± 0.00Aa | 0.72 ± 0.00Aa | 0.73 ± 0.01Aa |
| 28th day | 0.70 ± 0.01Aa | 0.73 ± 0.00Aa | 0.74 ± 0.02Aa | |
| CI (%) | 1st day | 95.55 | 94.85 | 94.7 |
| 28th day | 94.4 | 94.55 | 95.2 |
Means ± standard deviation followed by different uppercase letters in a column indicate significant differences between storage times for the same analysis (P < 0.05). Means ± standard deviation followed by different lowercase letters in a row indicate significant differences between formulations for the same storage time (P < 0.05).
CI, confidence index; F.I, Flow index; K, consistency index.
Rheological characteristics
The sorghum beverages showed a consistency index of 25.85–36.30 mPa.s and a flow behaviour index of 0.69–0.74, with good confidence indices (94.40%–95.55%, Table 3). Products with flow behaviour <1 are characterised as pseudoplastic. Therefore, the apparent viscosity decreases when the shear rate increases (Miranda et al., 2019a, 2019b).
The packaging type influenced the consistency index of the products, with PET and HDPE products showing lower values (P < 0.05, Table 3). During storage, the consistency index decreased in all beverages (P < 0.05). Cereals commonly have proteins of low molecular weight and water solubility. Some aggregation may occur during fermentation, but the gel is usually weak, decreasing consistency during storage (Bernat et al., 2014). Briefly, the initial thermal treatment may unfold protein with hydrophobic regions exposed generating a stable protein aggregate. The protein's net charge is neutralised with pH decreasing during fermentation, leading to subsequent gelation. The gel is weak, non-continuous, and may have structural changes during storage, decreasing consistency (Wang et al., 2023). A low consistency characterises plant-based beverages; therefore, PET and HDPE products might have increased sensory acceptance by consumers.
Probiotic viability in the products and TGI
The sorghum beverages showed probiotic counts of 7.66–8.29 log CFU mL−1 during the storage time (Table 4). It is recommended that probiotic beverages have at least 6 log CFU mL−1 in their final composition to confer health benefits for the consumer (Talwalkar & Kailasapathy, 2004a; Hill et al., 2014; Kumar et al., 2017; Pimentel et al., 2021). Therefore, all formulations could be considered probiotic products during their entire shelf life, and malted sorghum can be considered a suitable raw material for probiotic beverage processing.
Probiotic survival during TGI in the sorghum malt-based probiotic beverage in glass, PET and HDPE packaging during refrigerated storage (log CFU mL−1)
| Parameter | Times | Glass | PET | HDPE |
|---|---|---|---|---|
| T0 (Product) | 1st day | 7.66 ± 0.05Aa | 7.78 ± 0.04Aa | 7.71 ± 0.10Aa |
| 28th day | 8.21 ± 0.06Ba | 8.29 ± 0.10Ba | 8.18 ± 0.19Ba | |
| T1 (Gastric phase) | 1st day | 7.05 ± 0.05Ba | 7.61 ± 0.07Aa | 7.76 ± 0.10Aa |
| 28th day | <2 | 8.75 ± 0.16Ba | 8.56 ± 0.69Ba | |
| T2 (First enteric phase) | 1st day | 7.72 ± 0.11Ba | 8.68 ± 0.05Ba | 7.73 ± 0.07Ba |
| 28th day | <2 | 6.56 ± 0.07Aa | 7.10 ± 0.21Aa | |
| T3 (Second enteric phase) | 1st day | 7.74 ± 0.05Ba | 7.81 ± 0.06Ba | 7.68 ± 0.08Aa |
| 28th day | <2 | 6.42 ± 0.02Aa | 7.68 ± 0.05Aa |
Means ± standard deviation followed by different uppercase letters in a column indicate significant differences between storage times and TGI step (P < 0.05). Means ± standard deviation followed by different lowercase letters in a column indicate significant differences between formulations for the same storage time (P < 0.05).
The packaging type did not influence the probiotic survival in the products (P > 0.05). During storage, probiotic counts increased for all formulations (P < 0.05). These results may be associated with malted sorghum composition, probiotic oxygen tolerance, and low storage temperature. Sorghum malting germination is an essential step where the increase in the nutritional value of this grain occurs, such as the content of essential amino acids, fatty acids, and minerals, as well as the activation of enzymes that cause the breakdown of starch into fermentable sugars, which can be used as a substrate for the growth of probiotic cultures (Chavan et al., 2018; Aparicio-García et al., 2021). The probiotic growth during refrigerated storage can be explained by the supply of nutrients that the sorghum malt provided, mainly after the adaptation of the probiotic culture to the medium (Chavan et al., 2018; Aparicio-García et al., 2021). Oxygen permeation through packaging is problematic for strictly anaerobic bacteria (Ranadheera et al., 2013). Still, the packaging did not appear to significantly affect the viability of L. casei in sorghum-fermented beverages during storage. Furthermore, even though a packaging material may have high oxygen permeability, low storage temperature may minimise the biochemical reactions of probiotics and thereby neutralise the packaging effect (Ranadheera et al., 2013). Increased probiotic counts during storage have been reported for sprouted cereal and flour beverages (Chavan et al., 2018, Aparicio-García et al., 2021).
The sorghum beverages showed probiotic counts of 6.42–8.68 log CFU mL−1 during the TGI (Table 4), with higher survivals than previous studies with red quinoa probiotic drinks (Cerdá-Bernad et al., 2022) and peanut and soy-based probiotic drinks (Montanari et al., 2020). For the recently prepared products (day 1), all formulations showed suitable probiotic survival to TGI (>6 log CFU mL−1). On the other hand, in glass-stored formulations, probiotic counts decreased up to <2 log CFU mL−1 at the gastric step (P < 0.05). In PET and HDPE formulations, probiotic counts were kept >6 log CFU mL−1 during the entire TGI (P < 0.05). One of the first barriers that hinder the survival of the probiotic culture is the gastrointestinal conditions, and considering that it is a defence mechanism of the body against pathogenic microorganisms, the culture must have a certain resistance so it is possible to reach the colon in sufficient numbers for the proliferation of the probiotic in the host intestine (Hill et al., 2014; Rasika et al., 2021; Dridi et al., 2022). Probiotic cultures face severe acid stress during the first step of digestion (i.e., stomach), which limits the in situ activity (Gaucher et al., 2019). The low pH values of the stomach may decrease the bacterial intracellular pH due to the intracellular accumulation of protons (H+ ions) from the environment and affect the transmembrane pH. Then, undissociated organic acids (acetic and lactic acids) may diffuse across the cell membrane and dissociate to form H+, thus lowering cytoplasmic pH. These changes can alter the proton motive force, damaging the cell membrane, proteins, and DNA, and resulting in cell death (Amund, 2016).
Our results suggest that the higher DO in plastic packages may have promoted an adaptation of the probiotic cultures to oxidative stress during storage, resulting in a higher resistance to acid conditions (Kumar et al., 2017). The ability to adapt to the medium in response to stress has already been reported, ensuring bacterial survival. Shah (2000) reported adaptation to an acidic medium with strains of Lactobacillus acidophilus, while Talwalkar & Kailasapathy (2004b) stated that gradually increases in the level of dissolved oxygen in the medium developed resistance to this oxidative stress for strains of L. acidophilus and Bifidobacterium spp., and they remained viable even after 35 days of storage. When exposed to inhospitable environments, this adaptation mechanism in probiotic bacteria may be due to the activation of some silent genes that increase the antioxidant power of these cultures (Tripathi & Giri, 2014; Feng & Wang, 2020). Other adaptive mechanisms have been reported in the literature, such as the accumulation of energy storage compounds and compatible solutes, regulation of energy production pathways, modulation of the cell envelope, and overexpression of molecular chaperones and stress-responsive proteases. These adaptative mechanisms may improve the probiotic resistance to digestive stresses (Gaucher et al., 2019). The higher dissolved oxygen concentration in the plastic packaging may have induced one or more of these adaptative mechanisms. However, more studies are necessary to evaluate the mechanisms of action.
From the results obtained, it can be affirmed that malted sorghum is a good alternative for a probiotic beverage matrix, considering its ability to preserve probiotic viability during storage, ensuring the viability of the culture even after simulated digestion analysis. Regarding packaging, HDPE and PET are good materials for use as containers for probiotic beverages.
Sensory analysis
The counts of faecal coliforms and moulds were below the detection limit, showing the non-existence of contamination and confirming the good manufacturing practice of the beverage during all stages of the process. Therefore, the products were submitted for sensory analysis.
The sorghum beverages showed sensory acceptance scores in the 4–5 range, demonstrating that the consumers were indifferent to the products (neither liked nor disliked) (Table 5). The relatively low acceptance may be explained by the non-existence of sorghum beverages in the Brazilian market and the age of the participants, mainly young students. Similar acceptance scores for commercial soy, coconut, cashew, and almond yoghurts have already been reported (Grasso et al., 2020). Familiarity contributes to increasing consumer acceptance of innovative products (Soares et al., 2020).
Sensory acceptance of the sorghum malt-based probiotic beverage in glass, PET and HDPE packaging during refrigerated storage
| Attribute | Times | Glass | PET | HDPE |
|---|---|---|---|---|
| Colour | 1st day | 4.6 ± 2.07Aa | 4.4 ± 2.07Aa | 4.5 ± 2.07Aa |
| 28th day | 5.3 ± 1.99Bb | 5.4 ± 1.94Bb | 5.2 ± 2.15Bb | |
| Aroma | 1st day | 4.4 ± 2.09Aa | 4.3 ± 2.09Aa | 4.4 ± 2.09Aa |
| 28th day | 4.9 ± 2.26Bb | 5.1 ± 2.28Bb | 5.1 ± 2.17Bb | |
| Flavour | 1st day | 3.5 ± 2.18Aa | 3.9 ± 2.18Aa | 3.7 ± 2.18Aa |
| 28th day | 4.8 ± 2.46Bb | 5.3 ± 2.39Bb | 5.1 ± 2.50Bc | |
| Global acceptance | 1st day | 3.8 ± 2.05Aa | 4.0 ± 2.05Aa | 4.0 ± 2.05Aa |
| 28th day | 4.8 ± 2.33Bb | 5.3 ± 2.42Bc | 5.1 ± 2.36Bc |
Means ± standard deviation followed by different uppercase letters in a column indicate significant differences between storage times for the same formulation (P < 0.05). Means ± standard deviation followed by different lowercase letters in a row indicate significant differences between formulations (P < 0.05). For the attributes colour, aroma, flavour, and global acceptance a 9-point hedonic scale was applied with scores ranging from 1 (dislike extremely) to 9 (like extremely).
The packaging type did not influence the sensory acceptance (colour, aroma, flavour, and global acceptance) of the recently prepared products (day 1, P > 0.05). During storage, the sensory acceptance increased for all formulations (P < 0.05), and PET and HDPE formulations showed higher acceptance in flavour and global acceptance at the end of storage time (P < 0.05). Our results suggest that the increased acidity during storage may have contributed to the flavour characteristic of the products. Furthermore, probiotic cultures could have produced flavour compounds, mainly in plastic packages (Aspri et al., 2020). Many volatile compounds may be formed by probiotic culture during fermentation or storage, improving the flavour quality of the products, such as higher alcohols, acids, esters, and carbonyls (Ogunremi et al., 2015). Bezerril et al. (2022) reported that L. casei addition to goat milk yoghurt increased the organic acid content (propionic and lactic acids), and volatile profile (humulene, 2-undecanone, n-decanoic acid, nonanal, 2-heptanone, 1-nonanol, 2,3 – butanedione, and limonene), and improved sensory characteristics, with higher herbaceous aroma and flavour, dairy aroma, sweet aroma and taste, and typical aroma and flavour. Volatiles are the result of biochemical reactions that may occur during the storage of probiotic products; therefore, with longer storage, those reactions become more intense, and, consequently, the number of volatiles also increases (Bezerra et al., 2017).
Based on the results obtained, it can be affirmed that both PET and HDPE packages are viable to guarantee the sensory attributes of the probiotic beverage based on sorghum. This is a positive result for the food industry, considering that glass is a more expensive material, besides being dangerous and impractical, because of the risk of breakage (Pimentel et al., 2015).
Conclusion
A new non-dairy and gluten-free fermented beverage was developed from the fermentation of sorghum malt with the strain L. casei LYOFAST BGP 93. The packaging type did not influence the product's chemical composition, quality parameters (pH values, total soluble solids, titratable acidity, colour parameters), antioxidant activity (DPPH and ABTS), or probiotic survival. On the contrary, PET and HDPE packaging resulted in products with a lower consistency index and higher dissolved oxygen, improved probiotic survival to simulated gastrointestinal conditions, and better sensory acceptance (flavour and global). Our results indicate that malted S. bicolor could be used to process probiotic beverages resulting in products with adequate probiotic survival and physicochemical parameters and reasonable sensory acceptance during 28 days of refrigerated storage.
Acknowledgments
We thank the Federal University of Maringá (UEM) and the Federal Institute of Paraná for providing the experiments and data analysis facilities, and Coordenação de Aperfeiçoamento de Pessoal de Nível Superior (CAPES) and Conselho Nacional de Desenvolvimento Científico e Tecnológico (CNPq) (Process number 303893/2022-2).
Author contributions
Aline Gouveia Fiori: Conceptualization (equal); investigation (equal); methodology (equal); project administration (equal); supervision (equal); writing – original draft (equal). Antonio Roberto Giriboni Monteiro: Conceptualization (equal); data curation (equal); investigation (equal); methodology (equal); project administration (equal); supervision (equal); writing – original draft (equal). Tatiana Colombo Pimentel: Conceptualization (equal); data curation (equal); investigation (equal); methodology (equal); project administration (equal); supervision (equal); writing – original draft (equal). Carlos Eduardo Barão: Methodology (equal); visualization (equal). Vanessa Aparecida Marcolino: Methodology (equal); visualization (equal).
Ethical approval
This study was approved by the Standing Committee on Ethics in Human Research of the State University of Maringá (Number: 60690822.3.0000.010).
Peer review
The peer review history for this article is available at https://www.webofscience.com/api/gateway/wos/peer-review/10.1111/ijfs.16600.
Data availability statement
Data available on request from the authors.
References
Development of a gluten-free fermented beverage from sprouted oats. We cited this article because it is related to the development of a gluten-free fermented beverage from sprouted oats.
We cited this article because it is related to the development of a probiotic hazelnut fermented beverage using Lactobacillus rhamnosus.
We cited this article because it conducted the germination process of cereals and legumes for the development of a probiotic beverage.
We cited this article because it is related to the evaluation of the effect of different plastic packagings on the survival of probiotics in yogurt.
We cited this article because it is related to the development of a probiotic sorghum beverage.
