


Abstract
Recently published International Dysphagia Diet Standardisation Initiative (IDDSI) framework provides a new global guideline on texture modification and standardisation for dysphagia patients. The IDDSI flow test determines the usage of the 10-mL syringe with a fixed length from the zero to the 10-mL line engraved on the barrel. The objective of this work was to investigate the influences of the other syringe geometries on the IDDSI test. Three syringes of different geometries were used for the test. Results from the IDDSI test (i.e. the amount of residue in the syringe after the gravitational flow for 10 s) depended on the syringe geometries. The actual amount of residue in the syringe can be predicted by calculation using the Hagen–Poiseuille equation. Most importantly, results from the simulation of the residue with changing the syringe geometries demonstrated that the nozzle inner diameter is the most important factor on the IDDSI flow test.
Introduction
Dysphagia is a swallowing disorder, which is highly prevalent among elderly people. In recent years, dysphagia has become a serious social problem with rapid increase in elderly populations, especially in developed countries (Su et al., 2018). It is reported that dysphagia affects up to half of acute stroke patients and carries a threefold to sevenfold increased risk of aspiration pneumonia (Singh & Hamdy, 2006).
For dysphagia patients, food texture is important for the safety of eating and swallowing (Nishinari, 2009), and dysphagia is commonly managed using texture-controlled diets by thickening or gelling in most cases (Logemann, 1998; Clavé et al., 2006; Quinchia et al., 2011; Funami, 2016). In recent years, a number of countries have developed national standards or frameworks to grade or categorise the texture of dysphagia diets (National Dysphagia Diet Task Force, 2002; Dietitians Association of Australia, & Speech Pathology Association of Australia Limited, 2007; Irish Association of Speech-Language Therapists & Irish Nutrition & Dietetic Institute, 2009; United Kingdom National Patient Safety Agency, 2011; Yokote et al., 2017). Various standards defined by a number of countries may lead to confusion, which may be a barrier to smooth communication or to gaining common understanding between patients and doctors/dieticians, among hospitals/care homes, etc.
In 2016, the International Dysphagia Diet Standardisation Initiative (IDDSI) established a new set of standardised terminology and definitions to describe texture-modified foods and thickened fluids used for dysphagia individuals of all ages, of all cultures and in all care settings (Lam & Cichero, 2016; Cichero et al., 2017). The IDDSI framework consists of a continuum of 8 levels (0–7), identified by numbers, text labels and colour codes. Levels 0–4 represent fluid foods and levels 3–7 represent solid or semi-solid foods, and levels 3 and 4 apply to both. For fluid foods, the IDDSI flow test, in which a 10-mL syringe is used, was advocated. In this test, the syringe is filled with 10 mL fluid, and the fluid is allowed to flow freely by gravity for 10 s. The IDDSI level of the fluid is then determined based on the remaining volume of the sample after 10 s flow. It is clear that the IDDSI flow test is a simple and practical method for categorising the texture of thickened fluids and can be used universally (Yokote et al., 2017; Su et al., 2018; Steele et al., 2018). It is of course important to ensure the objectivity of the test protocol even though the simplicity and the practicality are highlighted. In the test protocol, the IDDSI requires the length of the syringe at 61.5 mm from the zero line to the 10-mL line (IDDSI; official website https://iddsi.org/framework/), but other geometric parameters are not specified. In previous studies, the IDDSI flow test was simulated using thickened fluids of different viscosities by designing a computational model of the fluid flow in a 10-mL syringe (Hanson et al., 2019). However, there seem to be little studies which have investigated the influence of syringe geometries on the IDDSI flow test.
The main objective of this work was to investigate the relationship between the syringe geometry and the result from the IDDSI flow test using fluid samples to understand the possibilities and limitations of IDDSI. In this study, glucose syrup was used as the component for Newtonian fluid samples, whereas model and commercial dysphagia thickeners were used for the preparation of non-Newtonian fluid samples.
Experimental design and procedures
Materials
Newtonian fluid samples
The mixed solutions of glucose syrup (Kougo Starch Co., Ltd., Chiba, Japan) and deionised water were used to the test as Newtonian fluid samples. The mixing ratio (w/w) ranged from 50:50 to 90:10 in 10 steps. The viscosity range of these samples was from 10 to 1200 mPas at 50 s−1. Deionised water was added to glucose syrup in glass beakers of 500 mL and stirred at 600 r.p.m for 10 min at 20°C. These samples were termed as the series No. 1 as shown in Table 1.
Shear viscosity and results from the IDDSI flow test for Newtonian flow samples
| Sample No. | Mixture ratio (w/w) | Shear viscosity @50 s−1 | Results from the IDDSI test [data on the residue in mL and the classification identified as Level (Lv.)] | ||||||
|---|---|---|---|---|---|---|---|---|---|
| Glucose syrup | Deionised water | (mPa·s) | Syringe A | Syringe B | Syringe C | ||||
| 1-1 | 50 | 50 | 10 ± 0.4 | 0.00a ± 0.00 | (Lv.0) | 0.00a ± 0.00 | (Lv.0) | 0.00a ± 0.00 | (Lv.0) |
| 1-2 | 60 | 40 | 22 ± 1.8 | 0.00a ± 0.00 | (Lv.0) | 0.80c ± 0.00 | (Lv.0/1) | 0.33b ± 0.06 | (Lv.0/1) |
| 1-3 | 70 | 30 | 57 ± 1.5 | 1.30a ± 0.10 | (Lv.1) | 3.00c ± 0.00 | (Lv.1) | 2.80b ± 0.00 | (Lv.1) |
| 1-4 | 75 | 25 | 100 ± 0.3 | 2.73a ± 0.06 | (Lv.1) | 4.40c ± 0.00 | (Lv.2) | 4.23b ± 0.06 | (Lv.2) |
| 1-5 | 80 | 20 | 177 ± 3.1 | 4.80a ± 0.00 | (Lv.2) | 6.27c ± 0.06 | (Lv.2) | 6.03b ± 0.06 | (Lv.2) |
| 1-6 | 81 | 19 | 217 ± 2.0 | 5.90a ± 0.10 | (Lv.2) | 7.17c ± 0.06 | (Lv.2) | 6.83b ± 0.06 | (Lv.2) |
| 1-7 | 82 | 18 | 260 ± 10.6 | 6.40a ± 0.10 | (Lv.2) | 7.60c ± 0.00 | (Lv.2) | 7.23b ± 0.06 | (Lv.2) |
| 1-8 | 83 | 17 | 315 ± 10.5 | 7.03a ± 0.06 | (Lv.2) | 8.03b ± 0.06 | (Lv.3) | 7.97b ± 0.06 | (Lv.2) |
| 1-9 | 85 | 15 | 414 ± 24.6 | 7.40a ± 0.10 | (Lv.2) | 8.33b ± 0.12 | (Lv.3) | 8.20b ± 0.10 | (Lv.3) |
| 1-10 | 90 | 10 | 1154 ± 50.0 | 8.97a ± 0.06 | (Lv.3) | 9.23b ± 0.06 | (Lv.3) | 9.23b ± 0.06 | (Lv.3) |
Data are presented as means ± SD of triplicate. Data with different letters (a ~ c) within one row are significantly different between syringes (P < 0.05).
Non-Newtonian fluid samples
As a non-Newtonian fluid sample, a model dysphagia thickener was prepared as follows. Potato-based pregelatinised starch (Matsunorin M; Matsutani Chemical Co., Ltd., Hyogo, Japan) and maltodextrin with DE 8 (Pinedex #1; Matsutani Chemical Industry Co., Ltd., Hyogo, Japan) were used to prepare the model dysphagia thickener. Two hundred grams of the pregelatinised starch was mixed with the same amount of the maltodextrin in each powder form, and the mixture was granulated by using a fluidised bed granulator (FD-MP-01; Powrex Co., Ltd., Hyogo, Japan) on a laboratory scale. The process parameters included inlet temperature of air; 75 °C, feeding rate of air; 0.5–1.0 m3 min−1 and spray air flow rate; 35 NL min−1 using 140 g deionised water as a binder.
Toromerin (Nutri Co., Ltd., Mie, Japan) as a commercial starch-based dysphagia thickener was also used to the test for another non-Newtonian fluid sample. According to the label, components of the product were maltodextrin and modified starch with a nutrition fact per 100 g of 93.6 g sugar, 0.2 g protein, 0.09 g sodium chloride equivalent and 4.5 mg potassium. The amount of each thickener in Table 3 was added to 150 g deionised water in glass beakers of 300 mL, stirred manually for 30 s at a rate of 4 rotations per second and left standing for 5 min. Then, the solutions were stirred again for 30 s at the same rotation speed and left standing for 30 min to gain the homogeneity. All sample preparations were conducted at 20 °C. In this article, the samples from the model thickener and the thickener product were termed as the series No. 2 and No. 3, respectively.
Rheological measurements
Steady-flow shear viscosity was measured using an ARES-LS1 controlled-shear-rate rheometer (TA Instruments, New Castle, DE, USA) equipped with a cone-and-plate geometry (diameter = 50 mm, angle = 0.0395 rad, and truncation gap = 0.056 mm). Shear viscosity was measured at shear rate from 1.7 to 50 s−1 at 0.83 s−2.
Viscosity coefficient, viscosity index and yield stress of fluid samples from either the model thickener and the thickener product were determined using an MCR302 controlled-stress rheometer (Anton Paar GmbH, Graz, Austria) equipped with a cone-and-plate geometry (diameter = 50 mm, angle = 0.0175 rad, and gap = 0.100 mm). Shear rates were measured in the shear stress range of 1–100 Pa. Viscosity coefficient, viscosity index and yield stress were determined by fitting the flow curve of shear stress σ as a function of the shear rate to the Herschel and Bulkley model (Herschel & Bulkley, 1926) as represented by eqn 1:
in which σy is the yield stress, μ is viscosity coefficient, and n is viscosity index. The case 0 < n < 1 corresponds to shear-thinning fluids, whereas n = 1 corresponds to the Newtonian fluid. All rheological measurements were performed three times at 20 °C.
IDDSI flow test
The IDDSI flow test was carried out according to the protocol shown in the IDDSI official website (IDDSI; https://iddsi.org/framework/), and the test samples were classified into Level 0–4 based on the fluidity as below;
Level 0: No residue in the syringe (all liquid flowing out)
Level 1: Residue between 1 and 4 mL remained in the syringe
Level 2: Residue between 4 and 8 mL remained in the syringe
Level 3: Residue between 8 and 10 mL remained in the syringe
Level 4: Ten ml residue remained in the syringe (no fluid flow)
Three syringes of different geometries were used for the test, including syringe A (slip tip; 10 mL; Becton, Dickinson and Company, Franklin Lakes, NJ, USA), syringe B (lock tip; 10 mL; Becton, Dickinson and Company) and syringe C (slip tip; 10 ml; Terumo Co., Ltd., Tokyo, Japan), all of which are commercially available. The geometries for each syringe were characterised (Table 2). Both the syringes A and B measured 61.5 mm from the zero line to the 10-ml line in accordance with the IDDSI requirement, and particularly, the syringe A corresponds to a recommended one. In contrast, the syringe C measured 51.8 mm from the zero line to the 10-ml line with 12 ml capacity, corresponding to ‘wider barrel’ syringe as IDDSI indicated. The tapering angle of all three syringes used was 29.9°. As we were not able to obtain the syringes with different taper angles, tapering angle was out of the target for discussion in the present study. The syringe barrel was filled with the fluid samples using another syringe to the 10 mL indication level with closing the tip of the syringe with a finger to prevent the leakage of the fluid samples. The syringe was placed perpendicular to the floor, and the finger closure was released. The fluid was allowed to flow for 10 s, and the syringe tip was closed with a finger again after 10 s. The amount of fluid sample remained in the syringe was measured. Data represent the mean ± standard deviation, SD of three independent measurements.
Dimensions of syringes used
| Manufacturer | Nozzle type | Barrel inner diameter (mm) | Barrel cross-section area (mm2) | Length from the zero line to the 10 mL line (mm) | Nozzle inner diameter (mm) | Nozzle length (mm) | Length from the end of nozzle to the 10 mL line (mm) | Angle of the taper of the barrel bottom (°) | |
|---|---|---|---|---|---|---|---|---|---|
| Syringe A† | BD (USA) | Luer-slip‡ | 14.2 | 159.3 | 61.5 | 2.54 | 9.07 | 74.5 | 29.9 |
| Syringe B | BD (USA) | Luer-lock§ | 14.3 | 160.5 | 61.5 | 2.34 | 9.82 | 73.8 | 29.9 |
| Syringe C | Terumo (Japan) | Luer-slip‡ | 15.9 | 197.9 | 51.8 | 2.48 | 9.42 | 65.0 | 29.9 |
†Syringe A (BD syringe) is used for the IDDSI flow test as a standard syringe.
‡The Luer-slip type syringe has no screw thread and the tip is fit with the needle by pressing together.
§The Luer-lock type syringe has a tip with screw thread to lock the needle.
Statistics
Data were examined by one-way analysis of variance, followed by the Bonferroni test with the significance defined at P < 0.05 to confirm the difference in the mean value between samples using a software; SPSS statistics ver. 19.0 (IBM Japan Ltd., Tokyo, Japan).
Results and discussion
Newtonian fluid samples
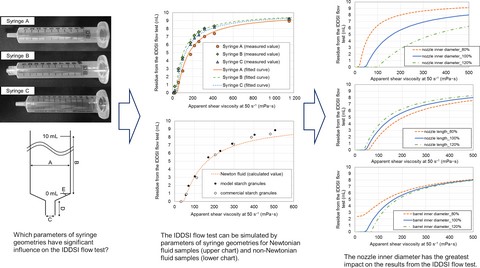
Results from shear viscosity measurements showed no shear-rate dependence of viscosity for all the samples from No. 1-1 to No. 1-10, and viscosities were almost constant over the shear-rate range tested (i.e. 1.7–50 s−1), presenting the Newtonian flow behaviour (data not shown). When the shear viscosity was measured at 50 s−1, it ranged between approx. 10 and 1200 mPas, and the higher the mixing ratio of the syrup, the higher the viscosity was (Table 1). The residue of the fluid samples after 10 s flow increased with viscosity for each syringe used (Table 1). The residue in the syringe A was generally smaller than that in the syringe B or C when compared within the same fluid sample. Based on the residue data, the IDDSI levels were identified. Four out of ten Newtonian fluid samples were classified differently by syringe A and B, and three Newtonian fluid samples were classified differently by syringe A and C (Table 1).
Non-Newtonian fluid samples
The flow behaviour of the fluid samples from the model thickener (i.e. series No. 2) and the thickener product (i.e. series No. 3) showed shear-thinning property and can be fitted to the power law equation with high coefficient of determination (R2 > 0.94). Apparent shear viscosity at 50 s−1 increased with additional level of thickener, covering the range between approx. 30 and 500 mPas for both the series No. 2 and 3 (Table 3). Viscosity coefficient μ increased with addition level of thickener for both the series No. 2 and 3. Viscosity index n for the series No. 2 samples generally increased with additional level of the model thickener, while the viscosity index for the series No. 3 samples decreased with additional level of the thickener product. In general, the viscosity index for both series samples was over approx. 0.6. On the other hand, Seo & Yoo (2013) demonstrated that the viscosity index for the fluid samples with gum-based (xanthan gum and xanthan–guar gum mixture) dysphagia thickeners was in the range of 0.14–0.19, indicating that starch-based thickeners used in the present study had lower shear-thinning property than gum-based thickeners.
In each syringe used, the residue increased with apparent shear viscosity (at 50 s−1) for the fluid samples from the series No. 2 and 3 (Table 3). For both the model thickener and the thickener product, the residue in the syringe A was generally smaller than that for the syringe B or C when compared the same fluid sample (P < 0.05). For the fluid samples with relatively low shear viscosity (i.e. below 100 mPas) like in the case of No. 2-1, 2-2, 3-1 and 3-2, the residue in the syringe C was smaller than that for the syringe B (P < 0.05). Based on the residue data, the IDDSI levels were identified. For the series No. 2 samples, two out of eight samples were classified differently by syringe A and B, or C (Table 3). Moreover, for the series No. 3 samples, five out of seven samples were classified differently by syringe A and B, or C (Table 3). These results indicate that difference of the syringe used can affect the result of the IDDSI flow test.
Viscosity parameters and results from the IDDSI flow test for non-Newtonian fluid samples
| Sample No. | Addition amount of each thickening agent (g)/150 g deionised water | Shear viscosity η @50 s−1 (mPa·s) | Viscosity coefficient μ | Viscosity index n | Coefficient of determination R2 | Yield stress σy (Pa) | Results from the IDDSI test (data on the residue in mL and the classification identified) | |||||
|---|---|---|---|---|---|---|---|---|---|---|---|---|
| Syringe A | Syringe B | Syringe C | ||||||||||
| 2-1 | 2.25 | 56 ± 1.1 | 0.26a ± 0.02 | 0.65a ± 0.02 | 0.983 | 0 | 0.83f ± 0.06 | (Lv.0/1) | 2.17h ± 0.15 | (Lv.1) | 1.50g ± 0.10 | (Lv.1) |
| 2-2 | 2.55 | 69 ± 4.3 | 0.32ab ± 0.05 | 0.65a ± 0.02 | 0.983 | 0 | 1.97f ± 0.12 | (Lv.1) | 3.30h ± 0.10 | (Lv.1) | 2.80g ± 0.10 | (Lv.1) |
| 2-3 | 3.30 | 101 ± 6.7 | 0.47abc ± 0.08 | 0.65a ± 0.03 | 0.979 | 0 | 3.13f ± 0.06 | (Lv.1) | 4.60g ± 0.10 | (Lv.2) | 4.40g ± 0.10 | (Lv.2) |
| 2-4 | 4.80 | 169 ± 5.5 | 0.71bcd ± 0.10 | 0.67a ± 0.03 | 0.973 | 0 | 5.50f ± 0.10 | (Lv.2) | 6.10g ± 0.10 | (Lv.2) | 6.00g ± 0.10 | (Lv.2) |
| 2-5 | 5.55 | 230 ± 3.5 | 0.91bc ± 0.09 | 0.66a ± 0.00 | 0.964 | 0 | 6.30f ± 0.10 | (Lv.2) | 7.10g ± 0.10 | (Lv.2) | 7.00g ± 0.10 | (Lv.2) |
| 2-6 | 7.65 | 290 ± 15.4 | 0.93d ± 0.12 | 0.72ab ± 0.02 | 0.968 | 0 | 7.20f ± 0.10 | (Lv.2) | 7.90g ± 0.10 | (Lv.2) | 7.80g ± 0.10 | (Lv.2) |
| 2-7 | 8.75 | 403 ± 2.8 | 1.02d ± 0.09 | 0.75ab ± 0.01 | 0.970 | 0.09 | 8.30f ± 0.10 | (Lv.3) | 8.80g ± 0.10 | (Lv.3) | 8.80g ± 0.10 | (Lv.3) |
| 2-8 | 9.00 | 506 ± 21.1 | 1.50e ± 0.34 | 0.79b ± 0.09 | 0.948 | 0.27 | 8.87f ± 0.06 | (Lv.3) | 9.03f ± 0.06 | (Lv.3) | 9.00f ± 0.10 | (Lv.3) |
| 3-1 | 3.00 | 31 ± 2.6 | 0.06a ± 0.01 | 0.84a ± 0.01 | 0.986 | 0 | 0.00f ± 0.00 | (Lv.0) | 0.73h ± 0.12 | (Lv.0/1) | 0.33g ± 0.12 | (Lv.0/1) |
| 3-2 | 3.50 | 58 ± 4.1 | 0.13a ± 0.00 | 0.81a ± 0.01 | 0.980 | 0 | 0.93f ± 0.12 | (Lv.0/1) | 2.20h ± 0.00 | (Lv.1) | 2.00g ± 0.00 | (Lv.1) |
| 3-3 | 4.00 | 110 ± 0.4 | 0.29ab ± 0.03 | 0.77ab ± 0.02 | 0.989 | 0 | 2.97f ± 0.06 | (Lv.1) | 4.03g ± 0.06 | (Lv.2) | 4.07g ± 0.12 | (Lv.2) |
| 3-4 | 4.50 | 204 ± 1.9 | 0.77bc ± 0.16 | 0.71b ± 0.05 | 0.990 | 0 | 5.80f ± 0.10 | (Lv.2) | 6.70g ± 0.10 | (Lv.2) | 6.70g ± 0.10 | (Lv.2) |
| 3-5 | 5.00 | 297 ± 6.0 | 1.35c ± 0.13 | 0.69bc ± 0.04 | 0.993 | 0 | 7.13f ± 0.06 | (Lv.2) | 8.03g ± 0.06 | (Lv.3) | 8.10g ± 0.10 | (Lv.3) |
| 3-6 | 5.30 | 387 ± 32.3 | 2.07d ± 0.48 | 0.61cd ± 0.04 | 0.995 | 0.04 | 8.00f ± 0.00 | (Lv.2/3) | 8.63g ± 0.06 | (Lv.3) | 8.70g ± 0.00 | (Lv.3) |
| 3-7 | 5.50 | 482 ± 17.1 | 2.74d ± 0.31 | 0.59d ± 0.02 | 0.995 | 0.32 | 8.40f ± 0.00 | (Lv.3) | 8.83g ± 0.06 | (Lv.3) | 8.93g ± 0.06 | (Lv.3) |
μ and n are described by the Herschel and Bulkley model σ = σy + μn, where σ and represent shear stress and shear rate, respectively. Data are presented as means ± SD of triplicate. Data with different letters (a ~ e) within one column are significantly different for each series of sample No. 2 and 3 (P < 0.05). Data with different letters (f ~ h) within one row are significantly different between syringes (P < 0.05).
Effects of the syringe geometries
Let us consider the effect of syringe geometries on the result of the IDDSI flow test for Newtonian fluid samples. Given that a syringe with a barrel (cross-section area A1 [m2]) and nozzle (inner diameter d [m], length L [m]) is filled with Newtonian fluid from the end of the nozzle to a height h [m], the Hagen–Poiseuille equation provides the volumetric flow rate Q [m3 s−1]:
in which η and ΔP represent shear viscosity and the pressure difference between the two ends, respectively.
Since ΔP is equal to ρ·g·h, where ρ [kg m−3] and g [m s−2] represent the fluid density and the gravitational acceleration, respectively, the eqn 3 can be rewritten as:
From the eqn 3, the volumetric flow rate in time t can be described as:
in which Q(t) means the volumetric flow rate in time t, and h(t) means the height from the end of the nozzle to the surface of the fluid sample in time t.
The amount of water discharged has to be equal to the decrease of water volume stored, that is as follows:
Combining eqns 4 and 5 gives the following:
and integrating in the time interval (0−t), which corresponds to the height interval (h(0)−h(t)), will give the following:
As a consequence (Fiorillo, 2011), the residue (i.e. remaining amount) R [mL] at t = 10 [s] on the IDDSI flow test is as follows:
The density of Newtonian fluid samples was calculated by the density of water (1.00 g cm−3) and the density of glucose syrup (1.37 g cm−3). The density of all non-Newtonian fluid samples was almost 1.0 g cm−3 according to the actual measurement; therefore, 1.0 g cm−3 was used for calculations as the density of non-Newtonian fluid samples.
For the Newtonian fluid samples, the residue calculated using eqn 10 overlapped well with the actual measurements (Fig. 1). This indicates that the IDDSI flow test can be simulated by parameters of the syringe geometries (nozzle inner diameter d, nozzle length L, height from the end of the nozzle to the fluid surface at the initial h0 and barrel cross-sectional area A1) when fluid samples follow the Newtonian flow behaviour. As there was little difference between calculation and the actual measurement, energy loss (e.g. friction loss and shape loss) was not taken into consideration in the present study.
The relationship between the residue from the IDDSI test (measured and calculated value) and the shear viscosity at 50 s−1 for Newtonian fluid samples. The density of Newtonian fluid samples was calculated by the density of water and the density of glucose syrup.
The Reynolds number (Re) for the sample No. 1-1, which showed the lowest viscosity (i.e. 10 mPas), is approx. 325 at the maximum (as the initial velocity) from the following equation;
in which v is the liner flow rate [m s−1] (v = (2gh(0))0.5), d is the nozzle inner diameter [m] and V is the coefficient of kinematic viscosity [m2 s−1]. Based on this result, it is reasonable to assume that all samples used in the present study behave as laminar flow, excluding the effect of turbulent flow which may occur in thin samples.
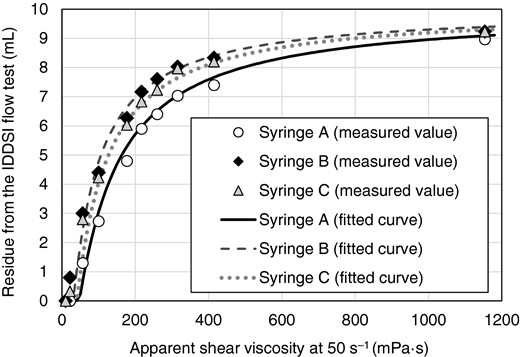
Simulation of the residue on the eqn 10 with changing the geometries of the syringe A (±20% from the actual one) for the Newtonian fluid samples is shown (Figure 2). Solid lines in the (a) ~ (c) of Figure 2 show the result of the IDDSI flow test when syringe A was used (calculated value). Figure (a) ~ (c) show the simulation of the residue with changing the nozzle inner diameter, nozzle length and barrel inner diameter, respectively. Dashed line shows the calculated value when each geometry is assumed to be 80% of the actual one. Chain line shows the calculated value when each geometry is assumed to be 120% of the actual one. It is clear from the simulation that the syringe geometries affect the results from the IDDSI flow test. Among the geometries, the nozzle inner diameter d has the greatest impact throughout the whole viscosity range tested; the smaller the nozzle inner diameter d is, the larger the residue, whereas the nozzle length L has the least impact. The influence of the barrel inner diameter is intermediate, and the deviation is apparent in the viscosity range below 100 mPas at 50 s−1 (Fig. 2).
Simulation of the residue from the IDDSI flow test with changing the geometries. Solid lines in the (a) ~ (c) show the result of the IDDSI flow test when syringe A was used (calculated value). Figure (a) ~ (c) show the simulation of the residue with changing the nozzle inner diameter, nozzle length and barrel inner diameter, respectively. Dashed line shows the calculated value when each geometry is assumed to be 80% of the actual one. Chain line shows the calculated value when each geometry is assumed to be 120% of the actual one. The density of non-Newtonian fluid samples was used as 1.0 g cm−3.
The residues in the standard syringe and the syringe of which geometries are different from those of the standard syringe can be calculated from three geometries (i.e. the nozzle inner diameter, the barrel inner diameter and the nozzle length). By adjusting the difference between those residues at each η, any syringe can be used for the IDDSI test so long as three geometries of the syringe used are measured.
What happens in the case of non-Newtonian fluid samples? In applying the same plot to the data for the series No. 2 and 3, actual measurements of the residue are well overlapped with calculation by eqn 10 when apparent shear viscosity is below 300 mPas, while deviation is found at higher viscosity (Fig. 3). It should be noted that the eqn 10, which is for the Newtonian fluid samples, cannot be applied directly to the non-Newtonian fluid samples like as the starch-based thickener. However, in terms of the viscosity index n, the fluid samples from starch-based thickeners are closer to the Newtonian fluid samples compared to the gum-based thickener, and this can explain good match between actual measurement and the calculation as in the case of the Newtonian fluid samples. For the fluid samples over approx. 400 mPas at 50 s−1 (i.e. sample No. 2-7, 2-8, 3-6 and 3-7), the measurements of residue are higher than the calculation. Those fluid samples have a yield stress (Table 3), which can affect the initial velocity. These results indicate that for the fluid samples from the starch-based thickeners, the amount of residue in the syringe can be predicted by calculation when apparent shear viscosity of the fluid samples is under 300 mPas at 50 s−1. Some effects of the syringe geometries on the test result can be expected also for non-Newtonian fluid samples similar to the case of the Newtonian fluid samples as shown in Fig. 2. From the result of the simulation, for both Newtonian and non-Newtonian fluid samples, it is clear that the nozzle inner diameter d has the greatest impact, whereas the nozzle length L has the least impact on the result of the IDDSI flow test. This result indicates that the nozzle inner diameters should be specified to ensure the accuracy of the test data on the IDDSI flow test.
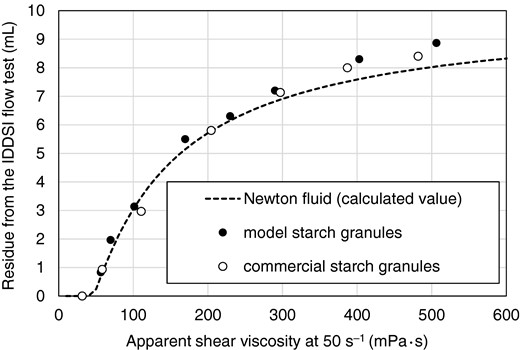
The relationship between the residue from the IDDSI flow test and shear viscosity at 50 s−1 for non-Newtonian fluid samples from model and commercial dysphagia thickeners when syringe A was used; the fitted curve of Newtonian fluid model is overdrawn.
It should be noted that the samples applicable to this procedure are limited the Newtonian fluids or the ‘pseudo’ Newtonian fluids like low η starch samples presented in this study. However, the results of this study may be helpful in comparing the data among different facilities, contributing to better communication and thus the quality of life for the patients. As well known, the IDDSI test is a practical method for measuring the fluidity of samples in a wide range of thickness. It contributes greatly to on-site measurement of the thickness for dysphagia foods and beverages without the necessity of using expensive apparatuses (Yokote et al., 2017; Su et al., 2018; Steele et al., 2018; Hanson et al., 2019), and in this context, the protocol for the measurement should be simplified. The present study will provide readers with awareness (a kind of caution) for better operation of the test and interpretation of the data with maintaining the advantages of the test. Considering other factors than the syringe geometry, including the slipperiness of the inner syringe wall surface (Haase et al., 2017), further studies will be required for better understanding of the flow behaviour in the syringe.
Conclusion
This work was designed to investigate the relationship between the syringe geometry and the result from the IDDSI flow test using fluid samples. Three conclusions obtained from the results of this work are mentioned below. First, geometry difference of the syringes used can affect the results of the IDDSI classification. Then, for the fluid samples from the starch-based thickeners, the actual amount of residue in the syringe can be predicted by calculation when apparent shear viscosity of the fluid samples is under 300 mPas at 50 s−1. Finally, the nozzle inner diameter is the most important factor in the syringe geometries on the IDDSI flow test. It was recommended that the nozzle inner diameter should be added as the syringe condition for higher accuracy of the data. We can enjoy the advantages of the IDDSI tests but also should pay attention to these findings for the best use of it.
Conflict of interest
The authors declare that they have no conflict of interest.
Ethics statement
Ethics approval was not required for this research.
Data availability statement
Research data are not shared.
References
IDDSI Framework Testing Methods. Retrieved from https://iddsi.org/framework/. Accessed 08/16/2019.
Author notes
The peer review history for this article is available at https://publons.com/publon/10.1111/ijfs.14559
