


Abstract
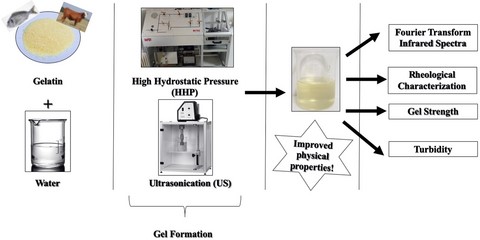
In this study, it was aimed to improve the physical properties of fish gelatin by using high hydrostatic pressure (HHP) and ultrasonication (US). Gelatin solutions were exposed to different pressures and ultrasonication separately and gelled afterwards. The physicochemical measurements based on gel strength, turbidity and rheology experiments showed that HHP treatment on fish and bovine gelatin stabilized the gelatin network by organising the structure and reducing the free volume. Both processing methods (HHP and US) increased the gel strength significantly (P < 0.05) compared with non-treated samples. Fourier-transform infrared spectroscopy (FTIR) results indicated that conformations of amino acids changed after the treatments. Furthermore, US treatment was shown to destroy the gelatin network, change the gelation mechanism and decreased the degree of aggregation. Both treatments improved the gel characteristics as gel strength, gelling and melting temperatures of the fish gelatin. At the end, the best combination for fish gelatin among HHP and US treatments was found as 400 MPa–10 °C–15 min pressurisation.
Introduction
Gelatin is the most commonly used ingredient in the food industry as a thickener, stabilizer, emulsifier and gelling agent (Cai et al., 2017). It is a natural macromolecule which is produced from animal’s skin, bone or white connective tissue collagen by heating and partial hydrolysis followed by denaturation (Das et al., 2017). Commercial gelatin is mostly extracted from the porcine skin or bovine bone. Since porcine and bovine gelatins are less preferred due to religious preferences by a majority of the population in the world, using fish skin or bone materials to obtain gelatin has an increasing trend in recent years (Yang & Wang, 2009; Sow & Yang, 2015).
There are some differences between fish and other gelatin sources such as lower gel strength, lower gelling temperature (TG) and melting temperature (TM) (Kaewruang et al., 2014). Fish gelatin has a lower percentage of proline and hydroxyproline imino acids which is known to be the main factor for lower gelling and melting temperatures and lower gel strength as compared to the bovine and porcine gelatin (Haug et al., 2004). Modification of the gel characteristics of the fish gelatin is possible by the addition of polysaccharides (Sow et al., 2017) or by the addition of salts (Giménez et al., 2005).
High hydrostatic pressure (HHP) is a novel processing method which is based on the transmission of pressure to sample in a liquid tank for a certain time and temperature. HHP can cause structural modification, aggregation, fragmentation or gelatin of proteins (Meng et al., 2017). HHP can modify protein structures by disrupting the hydrophobic and electrostatic interactions. The change in protein conformation could affect denaturation, aggregation and gelation, resulted in the modification of textural properties. Improvement of gelatin characteristics by HHP is mainly based on enhancing protein-protein interactions. HHP treated gelatin was shown to have greater aggregation, denaturation which could improve characteristics (Ma et al., 2013).
Ultrasonication (US) is another method to induce crosslinking on proteins and enhance protein-protein interactions (Jiang et al., 2018). It could improve the functional properties of proteins (i.e. emulsifying, solubility and rheological) by disintegrating the wall matrix and changing the conformation of the protein structure (Ali et al., 2018). In contrary, US has some disadvantages as undesired degradation and changes in physical properties when the samples are over-processed (Misra et al., 2017).
In this study, it was aimed to increase the gelation ability of fish gelatin by HHP and US. Different pressures and ultrasonication times were applied on the gelatins separately and gel strength, turbidity, rheological characterisation and fourier-transform infrared spectroscopy experiments were conducted to understand the effect of the processing methods.
Materials and methods
Raw materials
Bovine gelatin (~240 bloom) was provided by Kervan Gıda Sanayi (Istanbul, Turkey). Fish gelatin (~240 bloom) was obtained from SG chemicals PTE LTD by Elvan Gıda Sanayi (Istanbul, Turkey). Bovine derived gelatin was used as the reference material in the study.
Gel preparation
All gelatin solutions were prepared using the same procedure. Gelatin powder and distilled water were mixed (6.67 % w/v) (Norziah et al., 2009) at 30 °C until they were completely dissolved. That concentration was selected based on bloom testing standards. Completely dissolved samples without any treatment were indicated as a control (F-ctrl and B-ctrl).
High hydrostatic pressure (HHP) treatment
HHP treatments were performed with a 760.0118 type pressure equipment supplied by SITEC-Sieber Engineering, Zurich, Switzerland. The vessel had a volume of 100 mL with ID 24 mm and length 153 mm. A built-in heating–cooling system (Huber Circulation Thermostat, Offenburg, Germany) was used to maintain and control the required temperature, which is measured by a thermocouple type K in the vessel. The vessel was filled with a pressure-transmitting medium consisting of distilled water. Pressurisation rate was 340 MPa min−1 for 400 MPa. Pressure release times were less than 20 s for each. Pressurisation time reported in this study did not include the pressure increase and release times. Completely dissolved solutions were poured into 25 mL sterile polyethylene cryotubes (LP Italiana SPA) and pressurised at 400 MPa for 15 min at 10 °C and 30 °C to see the synergistic effect of pressure time and temperature. Samples were coded as F-P-400-30, B-P-400-30 and F-P-400-10, B-P-400-10, respectively. F and B denote fish and bovine gelatins, respectively, and P denotes HHP processing. All pressurised samples were cooled in the refrigerator at 4 °C for 16–18 h before analysis. Control group samples were not pressurised.
Ultrasonication treatment
US treatment on the gelatin solutions was performed using Heilscher UP400S (Dr. Heilscher GmbH, Germany) operating at 24 kHz, 400 W. The titanium alloy sonotrode (H3, Dr. Heilscher GmbH, Germany) with a diameter of 3 mm was used for the treatments. In order to keep the temperature of the solutions constant, an ice bath was used and the temperature was kept at approximately 30 °C. Completely dissolved gelatin solutions (kept at 25 mL) were treated with ultrasonication at a constant frequency (24 kHz) with different amplitudes 60%, 100% and at different times (5, 10 min). Probe was inserted into the solutions from the centre in such a way that the height was 1/3 of the sample height from the bottom. This was done to ensure that all samples were exposed to the same power. Samples were named as F-US-60-5, B-US-60-5, F-US-60-10, B-US-60-10, F-US-100-5, B-US-100-5, F-US-100-10 and B-US-100-10, respectively. Table 1 shows the combinations used in the study.
Experimental design of the study
| Samples | Processing techniques | Code of samples |
|---|---|---|
| High hydrostatic pressure (P) | ||
| Fish Gelatin (F) (6.67% w/v) | 400 MPa −10 °C - 15 min | F - P - 400 - 10/ B- P - 400 - 10 |
| Bovine Gelatin (B) (6.67% w/v) | 400 MPa −30 °C - 15 min | F - P - 400 - 30/ B- P - 400 - 30 |
| Ultrasonication (US) | ||
| 60% amplitude - 5 min | F - US - 60 - 5/ B - US - 60 - 5 | |
| 60% amplitude - 10 min | F - US - 60 - 10/ B - US - 60 - 10 | |
| 100% amplitude - 5 min | F - US - 100 - 5/ B - US - 100 - 5 | |
| 100% amplitude - 10 min | F - US - 100 - 10/ B - US - 100 - 10 | |
Gel strength
Gel strength of the gelatin gels prepared at a fixed volume of 25 mL was determined after 16–18 h maturation time using a texture analyser (Brookfield, CT310K, USA). The cylindrical probe with 12.7 mm diameter and 34 mm length was used with 4 mm penetration depth and at a speed of 0.5 mm s−1 into the samples as required by the bloom testing standards (Sow & Yang, 2015). The gel strength of the samples was determined from the maximum force required, which was recorded as a unit of g, at the penetration depth of 4 mm.
Turbidity
Turbidity of the gelatin samples was determined by using a spectrophotometer (Shimadzu UV-1700, Japan). Turbidity values of the samples were calculated by Eqn 1, at the wavelength of 600 nm (Sow et al., 2017). The samples were incubated for 1 h at 10 °C before measurements.
τ = Turbidity.
Io = initial radiation intensity.
I = final radiation intensity.
L = the path of the light (1 mm).
Fourier-transform infrared spectroscopy (FTIR) analysis
Fourier-transform infrared (FTIR) spectroscopy analyses were performed by using dry samples. Dry gel samples were obtained after freeze-drying (Zhejiang Value Mechanical & Electrical Products Co. Ltd., Wenling City, China) for 2 days. After lyophilisation, IR Affinity-1 Spectrometer with attenuated total reflectance (ATR) attachment (Shimadzu Corporation, Kyoto, Japan) was used at frequency range of 400-4000 cm−1 with 4 cm−1 resolutions and 32 number of scans.
Rheological characterisation
In order to measure the rheological properties, a Kinexus dynamic rheometer (Malvern, Worcestershire, UK) was used. Testing was performed using the geometry of cone and plate with 40 mm diameter and 4° conical surface and plate angle. Frequency sweep and temperature sweep experiments were conducted as the oscillatory tests to investigate viscoelastic behaviour. The cooling and heating range of the measurement was 10-40 °C for heating and 40–10 °C for cooling at a rate of 1 °C min−1 (Norziah et al., 2009). The frequency of the temperature sweep test was determined as 1 Hz from the linear viscoelastic region which was found by frequency sweep testing. Results were recorded as elastic modulus (G′) and viscous modulus (G″) as a function of gelling (TG) and melting (TM) temperature.
Statistical analysis
Sigma Plot software package (SigmaPlot ver.12, Chicago, IL, USA) was used to analyse the results. To examine the effect of temperature and processing time, two-way ANOVA was used (P ≤ 0.05). Tukey’s multiple comparison test was used to evaluate the significant differences among the different levels of the same factors (α ≤ 0.05).
Results and discussion
Gel strength
Effects of the non-thermal treatments on gel strength were shown in Fig. 1. Results showed that the highest gel strength result was found for the gels of 400 MPa-30 °C for bovine gelatin (1083.3 g) and 400 MPa-10 °C for fish gelatin (634.025 g). For HHP treatment, gel strength values were significantly different with respect to pressure and temperature and significantly different with respect to US time (P ≤ 0.05). Gel strength of US samples with treatment time of 10 min was both greater than 5 min for 60 % and 100 % amplitudes.
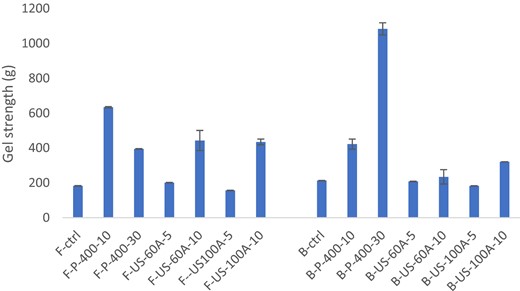
Gel strength result of fish and bovine gelatin as affected by HHP and US.
Gel strength is one of the most important parameters used to evaluate the gelling properties of gelatin (Bhat & Karim, 2009). Traditional gelation procedure using heating depends on the gelatin particle solubilisation due to random coiling of gelatin chains after melting of the triple helix structures. Intermolecular forces between water and free hydroxyl groups of amino acid molecules, concentration and molecular weight distribution are the major factors that affect the gel strength (Arnesen & Gildberg, 2002; Muyonga et al., 2004). Fish gelatin has lower proline and hydroxyproline content compared with mammalian gelatin (Haug et al., 2004). Both proline and hydroxyproline contributed to the hydrogen bonding of water molecules with gelatin more and this results in lower stability and gel strength when their occurrence decreases as in the case of fish gelatin (Ali et al., 2018). Fig. 1 shows that HHP treatment has a promoting effect on the gel strength of the gelatin. An increase in gel strength could be related to enhanced crosslinking (Bhat & Karim, 2009). HHP treatment caused a decrease in the free volume in the network of the samples. Reduction of the free volume by pressurisation resulted an increase in intermolecular interactions and strengthened the hydrogen bonding between water and free hydroxyl groups of amino acid chains (Moreno et al., 2016).
In the case of US, processing time as 5 min did not have a significant effect (P ≥ 0.05) on gel strength unlike 10 min (P ≤ 0.05). For US treatment, as processing time increased at a constant amplitude, higher gel strength was achieved. Effect of increased a processing time was shown to cause higher gel strength with constant amplitude from the increasing water solubility of the exo-polysaccharides and hydrocolloids (Lii et al., 1999; Wang et al., 2010). Gel strength differences depend also on the chain length of the gelatins. When gelatins have longer chain length, alignment and self-aggregation become easier (Ali et al., 2018). Contrary to the HHP treatment, US has destroying effect on the gelatin network and results in shorter chain lengths (Ali et al., 2018). Since the chain length was destroyed with US, lower gel strength values than the HHP treated samples were recorded.
Turbidity
Turbidity of the fish gelatin and its changes with respect to non-thermal treatments in different processing combinations are shown in Table 2. As in the case of gel strength, there are relatively high values of turbidity when gelatin was treated. The highest turbidity value after HHP treatment was obtained at 400 MPa −10 °C −15 min (2.12 cm−1). The effect of HHP on turbidity with respect to pressure and temperature combinations were all found statistically significantly (P ≤ 0.05). The turbidity of the HHP treated gelatin samples was quite high compared with control (untreated) samples. This meant that there was more interaction between amino acid molecules and it resulted in pressure-induced protein aggregation. Since intermolecular interactions were induced after reducing the free volume by pressurising, it increased hydrogen bonding and protein aggregation accordingly (Moreno et al., 2016). For ultrasonication, it was found that US treatment was statistically significant for all amplitude and time combinations (P ≤ 0.05). Also, statistical results showed that the effect of amplitude level depended on treatment time (P ≤ 0.05). Although ultrasonication was known to have a significant effect on cavitation of the molecules and collapse of gas bubbles (O’Sullivan et al., 2016), it was found that the US also had an effect on unfolding on polymer chains and resulted an increase in hydrophilic groups and water interaction (Farahnaky et al., 2017). Moreover, sonication of 5 min. caused minimal higher dissolution of dry gelatin in the water. As a result, higher interaction between water molecules and hydrophilic groups of gelatin molecules was obtained and it resulted in higher turbidity values as shown in Table 2. However, it was found that US treatment time had a reducing effect on the turbidity of the gelatin. It was decreased for both 60 and 100 amplitude US treatments. Increase in sonication time with constant amplitude resulted in smaller protein size of the gelatin (O’Sullivan et al., 2016). Decreasing the protein size resulted in the disruption of hydrophobic and electrostatic interactions which caused lowering of the degree of aggregation. In brief, ultrasonication treatment not only had the ability to breakdown intermolecular forces between gelatin and water and also had the ability to destroy gelatin network and decrease the degree of aggregation (Farahnaky et al., 2017). Moreover, when gel strength and turbidity results were compared there were reverse effects of time through sonication treatment. This effect can explained by the increasing the probability of obtaining junction zones and network formation with increasing sonication time which had resulted in higher gel strength (Farahnaky et al., 2017).
Turbidity results of the fish gelatin as affected by different processing combinations of HHP and US
| Sample | Turbidity |
|---|---|
| F-ctrl | 1.181 ± 0.107g |
| F-P-400-10 | 1.560 ± 0.211f |
| F-P-400-30 | 2.122 ± 0.062e |
| F-US-60A-5 | 7.264 ± 0.284a |
| F-US-60A-10 | 3.481 ± 0.049d |
| F-US-100A-5 | 5.425 ± 0.158b |
| F-US-100A-10 | 3.842 ± 0.086c |
| Sample | Turbidity |
|---|---|
| F-ctrl | 1.181 ± 0.107g |
| F-P-400-10 | 1.560 ± 0.211f |
| F-P-400-30 | 2.122 ± 0.062e |
| F-US-60A-5 | 7.264 ± 0.284a |
| F-US-60A-10 | 3.481 ± 0.049d |
| F-US-100A-5 | 5.425 ± 0.158b |
| F-US-100A-10 | 3.842 ± 0.086c |
Values represented with different superscript letters are statistically different at P < 0.05.
Fourier-transform infrared spectroscopy (FTIR)
In order to find the effects of HHP and US on the gelation properties of the gelatin, FTIR spectra were used and results are shown in Fig. 2. Amide A, amide B, amide I, amide II and amide III were the major regions that were represented in Fig. 2. All the details extracted from the FTIR spectra (position and area) are shown in Tables S1–S4.

(a) FTIR spectrum of fish gelatin as affected by HHP. (b) FTIR spectrum of fish gelatin as affected by US. (c) FTIR spectrum of bovine gelatin as affected by HHP. (d) FTIR spectrum of bovine gelatin as affected by US.
In general, peak shapes and amide region patterns were similar for both fish and bovine gelatins with some minor changes. As shown in Fig. 2, wave numbers (cm−1) of control fish gelatin samples for amide A and B were at 3294.42 and 2935.66 while they were 3284.77 and 2924.09 for the control bovine gelatin. After HHP treatment, amide A region shifted for 400 MPa–30 °C treated bovine gelatin sample from 3284. 77 cm−1 to 3298.28 cm−1 which also had the highest gel strength. This 15 cm−1 shifting in amide A region indicated that intermolecular forces between bovine gelatin and water increased (Sow et al., 2017). Likewise, in Amide A region, the effect of HHP on FTIR spectra was observed by shifting from 2924.09 to 2931.8 and 2953.02 cm−1 in amide B region after treatment. amide B band corresponds to the CH2 stretch bands and shifting to higher values might be due to the dimeric molecular association of carboxylic groups after pressurisation (Sow & Yang, 2015). In the spectrum of the fish gelatin, the peak position of the samples was not different but their intensity was different. The intensity of the 400 MPa-10 °C pressurised sample had the highest value among the HHP treated samples. This amide A band intensity increase showed that HHP could enhance the hydrogen bonding between gelatin and water molecules (Moreno et al., 2015).
Furthermore, other common bands such as amide I, II and III were also identified. Peak positions and area values showed the data from these regions for bovine and fish gelatin. Band between 1900 and 900 cm−1 were assigned to them (Al-Saidi et al., 2012). When peak position and area results were compared, it was shown that pressurising did not affect the band position but it increased the intensity which indicated increase in stability. Change in amide II peaks was generally considered more sensitive to hydration rather than secondary structure changes (Nurul & Sarbon, 2015). Since amide I band gives information about secondary structure (Sow et al., 2017) and amide III band about triple helix structure (Al-Saidi et al., 2012), the area under the band peaks could be used to estimate the structure of the gelatin and observe the loss of secondary structure and the random coil formation. Moreover, HHP treatment results in higher stability due to the reduction of free volume and an increase in hydrogen bonding (Hosseini-Nia & Ismail, 2002). When the areas were compared, it was seen that the secondary structure of the gelatin increased with pressurising at 10 °C for fish gelatin and 30 °C for bovine gelatin. This showed that HHP treatment helped to stabilize the gelatin and organise the structure by reduction of the free volume (Moreno et al., 2015). Different than HHP, US had a reducing effect on the intensity of amide I bands for fish gelatin. US treatment is known to have a destructive effect on the protein backbone (Jiang et al., 2018), and it could disrupt the secondary structure of the gelatin. Also according to Sow et al., (2017), peaks at 1633 cm−1 show the characteristic coil structure present in the gelatin. When the US treated fish gelatin samples were compared with control and HHP treated ones, it was clearly observed that the intensity of the coil structures decreased.
Rheological characterisation
The gelling and melting temperatures of the samples were determined by small-strain oscillatory measurements. While gelling temperatures were determined in the cooling period, melting temperatures were determined in the heating period at the crossover point of G′ and G″. G′ and G″ of the fish gelatin samples during heating and cooling as a function of TM and TG were shown in Fig. 3. Results showed G′ of the samples were greater than G″ values during cooling and heating period. Additionally, control fish gelatin had the lowest G′ and G″ value during both heating and cooling periods among all samples. The higher G′ values than G″ during gelation showed that the gelation process was formed by the hydrogen and covalent bonding between water and phosphate compounds or –NH2 groups on the side chains of amino acid groups (Huang et al., 2018).
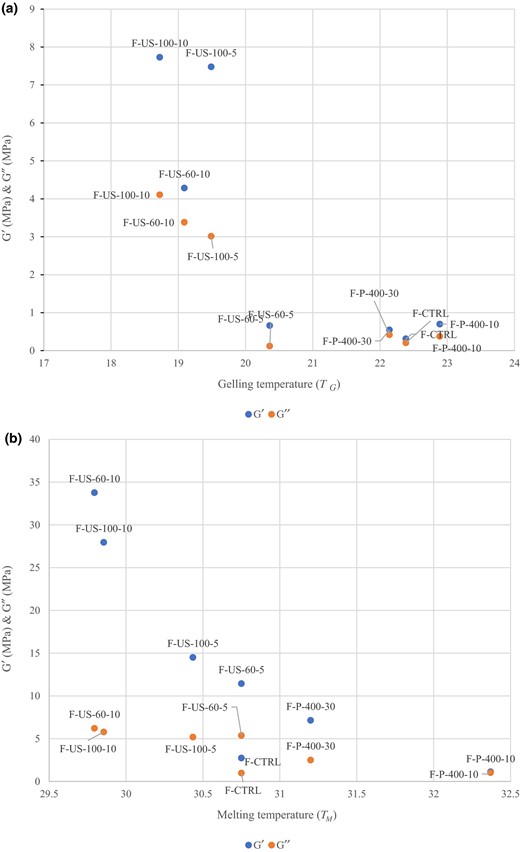
(a) Rheology results (G′, G″) of fish gelatin as affected by different processing combinations of HHP and US as a function of Tg. (b) Rheology results (G′, G″) of fish gelatin as affected by different processing combinations of HHP and US as a function of T.
Both G′ and G″ of the fish gelatin increased after HHP and US treatments. Although both HHP and US treatments increased G′ and G″ values, US treatment had a greater effect on the G′ and G″. This increasing trend after US treatment might be due to a different conformation of the coil structures and breaking of H-bonds (Sow & Yang, 2015) after destroying the gelatin network (Farahnaky et al., 2017). In addition to the US treatment, HHP treatment increased the G′ and G″ in both cooling and heating periods of fish gelatin. Increase in both G′ and G″ values of the fish gelatin might be due to the higher degree of unfolding after pressurisation which enabled the gelation process (Meng et al., 2017). This increasing trend among treated samples indicated gel setting and also resulted in increase in the strength of the gels. Both increase in gel strength and modulus values after treatments were linked to the higher degree of hydrogen, covalent (non disulphide) and protein-protein bonds (Moreno et al., 2015).
In the case of gelling and melting temperatures of the fish and bovine gelatin, it was observed that pressurisation increased both TM and TG. As in the gel strength results, fish gelatin and bovine gelatin showed a different behaviour after pressurisation. While the highest TM and TG values for fish gelatin were obtained at 400 MPa–10 °C, bovine gelatin had the highest value at 400 MPa–30 °C. In general, an increase in TM and TG of the gelatin gels showed the stabilization effect of the pressure treatment (Montero et al., 2002). Slightly higher TM and TG values of both fish and bovine gelatin samples which were an indicator of higher stability could be explained by specific hydration regions in the crosslinking junctions (Walkenström & Hermansson, 1997). Additionally, while the gelation mechanism of control samples was based on stabilization by hydrophobic interactions, hydrogen bonding had less effect on the stabilization of the pressurised samples (Montero et al., 2002). In conclusion, different gelation mechanisms, change in crosslinking junctions and amino acid content differences between fish and bovine gelatin results in different effects on G′, G″, TM and TG.
Conclusion
Investigating the gelation of fish gelatin by HHP and US has not been studied extensively. In this study, it was shown that both processing methods increased the gel strength and thus the stability of the gelatin. Greater stability of the gelatins was also confirmed by turbidity experiments. On the other hand, both HHP and US treatments had effects on protein conformations which were examined through amide A, B, I, II and III bands of the FTIR spectra. Rheology measurements were also conducted to confirm the increase in stability after processing. In brief, HHP and US had an effect on the stability of gelatin and improved gelation properties of fish gelatin.
Acknowledgments
This study was funded by Middle East Technical University Research Fund Project [grant number BAP-314-2018-2741]. Also, COST Action CA 15209 European Network on Relaxometry is acknowledged as some of the findings are discussed in the action’s network meetings and suggestions were taken into consideration in the final text. A part of the funding also came from Dr. Oztop’s award of Science Academy’s Young Scientist Awards Program (BAGEP).
Conflict of interest
All authors of this study declare no conflict of interest.
Ethical guidelines
Ethics approval was not required for this research.
Data availability statement
No data are available. Data could be provided upon request.
References
Author notes
The peer review history for this article is available at https://publons.com/publon/10.1111/ijfs.14487
