


Abstract
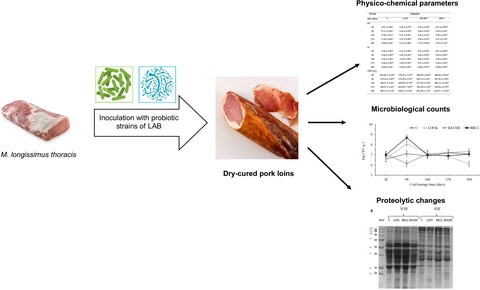
Selected physico-chemical and proteolysis-related parameters were evaluated in dry-cured loins inoculated with probiotic (Lactobacillus rhamnosus LOCK900, Bifidobacterium animalis subsp. lactis BB12) and potentially probiotic (Lactobacillus acidophilus Bauer Ł0938) lactic acid bacteria (LAB) strains and compared with a control sample at five different storage times (28, 90, 180, 270 and 360 days). Physico-chemical parameters of dry-cured loins were significantly (P < 0.01) affected by treatment, storage time and the interaction between them. The count of lactic acid bacteria (LAB) in dry-cured loins was in accordance with their pH. Higher intensity of proteolysis, as assessed by non-protein nitrogen content (NPN) and proteolysis index (PI), occurred in inoculated samples. Based on the SDS-PAGE analysis, the modifications produced during storage on the sarcoplasmic proteins were more pronounced than those exerted on the myofibrillar protein fraction. However, inoculation effect was absent from SDS-PAGE protein patterns.
Introduction
Lactic acid bacteria (LAB), coagulase-negative staphylococci, yeasts or moulds are commonly used as starter cultures to ensure safety and stability and provide desirable sensory characteristics to the product (Kołożyn-Krajewska & Dolatowski, 2012; Ojha et al., 2015). Selected strains of LAB belonging to the genus Lactabacillus and Bifidobacterium are also thought to have health-promoting abilities and may be used as probiotic starter cultures with a positive impact on consumer health (Cavalheiro et al., 2015). Some authors have reported the suitability of using probiotic strains of bacteria in dry-cured meat products formulations (Wójciak et al., 2012; Rubio et al., 2013, 2014; Neffe-Skocińska et al., 2017) underlining their favourable effect on sensory characteristics and hygienic quality of the products. The proteolytic system of natural contaminating bacteria or applied starter cultures, which is the case in dry-fermented meats, also contribute to the generation of small peptides and free amino acids (Mora et al., 2013). Previous studies have also described LAB proteolytic system as suitable to produce bioactive peptides from food proteins (Pessione & Cirrincione, 2016). The proteolytic system of LAB comprises a cell wall-bound proteinase, peptide transporters that take up the peptides into the cell, and various intracellular peptidases, including endopeptidases, aminopeptidases, dipeptidases and tripeptidases (Liu et al., 2010). The enzymatic activity of LAB has been proved to mainly influence the latest steps of proteolysis (Flores & Toldra, 2011).
Processing of dry-cured meat products involves numerous biochemical reactions that condition the sensory and textural properties of the end product as well as its nutritional value. These characteristics are formed during a long production process, which could last up to 24 months or even more. Apart from lipolysis, glycolysis and the transformation of nucleotides, proteolysis is the main biochemical phenomena that occur during the dry-curing process (Flores et al., 1997). The origin of proteolysis is attributed to the activity of endopeptidases, mainly cathepsins (B, D, H and L) and to a lesser extent calpains. The final products of the proteolytical chain (small peptides and free-amino acids) resulting from the action of exopeptidases (Toldrá & Flores, 1998), play a beneficial role in the taste formation of dry-cured products (Kęska & Stadnik, 2017). However, the excessive protein hydrolysis seems to be related, inter alia, to the onset of an unpleasant taste, as the bitterness showing the greatest increase in more proteolysed dry-cured meat products is highly related to amino acids (Sforza et al., 2006).
The effects of probiotic starter cultures on proteolytic phenomena have been studied in short-term aged (up to 28 days) dry-cured loins. The inoculation with Lactobacillus rhamnosus (formerly Lactobacillus casei ŁOCK 0900) LOCK900 did not significantly affected the ageing performance of examined loins (Stadnik & Dolatowski, 2013), thus confirming the role of microbial peptidases during the later stages of ageing (Flores & Toldra, 2011). This effect has been proved for potentially probiotic bacteria strain of Lactobacillus acidophilus Bauer and probiotic bacteria Bifidobacterium animalis subsp. lactis BB12, which impacted the change in quantitative and qualitative level of amino acids in dry-cured loins after 9 months of storage (Okoń et al., 2017a).
However, the effect of the LAB on the proteolytic changes during cold storage of dry-cured loins has not been completely clarified. This contribution is affected by many other parameters associated with the development of proteolysis such as water activity, pH and oxidation–reduction potential. A better understanding of proteolytic activities would provide a theoretical foundation to control proteolysis and thus help to produce a more consistent and stable product by improving quality, reducing variability and enhancing organoleptic characteristics of dry-cured meat products.
The aim of this study was to investigate the effect of applying three different LAB strains with probiotic and potentially probiotic characteristics, on certain physico-chemical and proteolytic parameters over 360 days of cold storage of dry-cured pork loins.
Material and methods
Dry-cured loins preparation
Twelve trimmed loins (M. longissimus thoracis) with an average weight of 2.00 ± 0.50 kg were excised at 24 h post-mortem from Polish Large White purebred fatteners with a body weight of approximately 125 kg at slaughter. Meat samples were obtained from a local slaughter house (Lublin, Poland). At 48 h post-mortem, all loins underwent curing using a surface massage with a mixture of 20 g of sea salt, 9.7 g of curing salt (99.5–99.6% sodium chloride and 0.4–0.5% sodium nitrite) and 0.3 g of sodium nitrate per kg of loin. After 24-h curing at 4 °C, the loins were randomly divided into four experimental groups with three loins each. One of the groups was regarded as a control sample (C). The other three experimental groups were inoculated with L. rhamnosus (formerly L. casei ŁOCK 0900) LOCK900 (LOCK), L. acidophilus Bauer Ł0938 (BAUER), and B. animalis subsp. lactis BB-12 (BB12), respectively, to achieve an initial level of 106–107 CFU g−1 of meat. Two of the strains: L. rhamnosus LOCK900 (Patent claim No. P-382760) from the Technical University of Łódź (Poland) and B. animalis subsp. lactis BB12 from the Christian Hansen collection (strain deposit number: DSM15954) fulfilled the required criteria for probiotic strains. The potentially probiotic strain L. acidophilus Bauer Ł0938 was obtained from the Technical University of Łódź (Poland). The inocula were prepared at the Chair of Food Hygiene and Quality Management (WULSSGGW, Warsaw, Poland) according to the procedure previously described by Wójciak et al. (2012). Subsequently, the loins were hung at 16 ± 1 °C in a laboratory ageing chamber with a relative humidity between 75% and 80% for 14 days. Thereafter, the whole pieces of loin were vacuum-packed in PA/PE bags of 80 μm thickness (Wispak, Lublin, Poland) and cold stored at 4 ± 1 °C for 12 months. The PA/PE permeability at 23 °C and 75% RH was 50 cm3 m−2 24 h−1 for oxygen and 150 cm3 m−2 24 h−1 for carbon dioxide; moisture vapour permeability was 2.6 g m−2 24 h−1 at 23 °C and 85% RH.
Three independent experimental trials were conducted. After 28, 90, 180, 270, and 360 days of cold storage, samples were taken for analyses.
Physico-chemical parameters
The pH value of the loins was measured using a digital pH meter (CPC-501; Elmetron, Zabrze, Poland) equipped with a combined pH glass electrode (ERH-111; Hydromet, Gliwice, Poland) in a suspension (minced loin/distilled water 1:10) homogenised for 1 min using a disperser (T25 Basic ULTRA-TURRAX; IKA, Staufen, Germany). The pH-meter was standardised with buffer solutions at pH 4.0, 7.0, and 9.0, prior to pH determination. The water activity (aw) measurements were carried out using a LabMaster-aw instrument (Novasina AG, Lachen, Switzerland) with a temperature-controlled measuring chamber. Novasina SAL-T humidity standards based on saturated salt solutions were used for calibration. The oxidation–reduction potential (ORP) was assessed as described by Nam & Ahn (2003). Samples (10 g) were homogenised with 30 mL of deionised water for 1 min using a disperser (T25 Basic ULTRA-TURRAX; IKA). ORP measurements of the homogenates were taken using digital pH-meter (CPC-501; Elmetron) set to the millivolt scale and equipped with platinum redox electrode (ERPt-13; Hydromet). All measurements were performed in triplicate and expressed as a mean ± standard deviation (SD).
Microbiological analysis
The total viable counts (TVC) were quantified by means of the colony-count technique (PN-EN ISO 4833-1:2013-12). The number of lactic acid bacteria (LAB) was determined according to PN-ISO 15214:2002. The counts were expressed as the log of colony-forming units (CFU) per gram of sample. Samples for the microbiological analyses have been taken as a cross section from the middle of the loins being tested. Microbiological analyses were carried out at the Eurocontrol Laboratory (Dęblin, Poland).
Proteolysis-related parameters
Total nitrogen (TN) content was determined by the Kjeldahl method using a Foss Kjeltec™ 8100 distillation unit (FOSS Analytical AB, Höganäs, Sweden). Non-protein nitrogen (NPN) was measured according to the method of Careri et al. (1993). The minced sample of loin (20 g) was homogenised with distilled water (180 mL), using a disperser (T25 Basic ULTRA-TURRAX; IKA). The homogenate was centrifuged at 8500 g for 15 min at 5 °C, and 50 mL of the obtained supernatant was added to 50 mL of trichloroacetic acid (5%) and allowed to react overnight at 4 ± 1 °C. The mixture was centrifuged at the previously mentioned conditions and filtered through Whatman No. 4 filter paper (Sigma-Aldrich, St. Louis, MO, USA). NPN was determined by analysing the filtrate for nitrogen according to the method previously mentioned for TN. The proteolysis index (PI) was calculated as the percentage ratio of NPN to TN (Careri et al., 1993).
Extraction of muscle proteins
Sarcoplasmic (water–soluble fraction, WSF) and myofibrillar (salt-soluble fraction, SSF) proteins were extracted as described by Molina & Toldrá (1992), with the modifications proposed by Fadda et al. (1999). Protein concentration of both fractions was determined by the Biuret method (Gornall et al., 1949) using Liquick Cor-TOTAL PROTEIN 60 kit (Cormay Group) and bovine serum albumin (BSA) as the standard.
Proteolysis degree of muscle protein fractions
The proteolysis degree of the muscle protein fractions (WSF, SSF) are monitored by measuring the content of primary amino groups (–NH2) according to the trinitrobenzene sulfonic acid (TNBS) method (Adler-Nissen, 1979). The content of primary amino groups was expressed as μM l-leucine amino equivalent per g of meat sample corresponding to the calibration curve. The calibration curve was prepared using the same protocol as described above, adding 250 μL of the leucine solution (1 mm stock solution) instead of the sample. The determinations were repeated three times. Based on eight measurement points, the relationship between the absorbance and the concentration of the reference substance was determined.
Sodium dodecyl sulphate polyacrylamide gel electrophoresis (SDS-PAGE)
The protein fractions (WSF and SSF) extracted from dry-cured loins were separated by sodium dodecyl sulphate polyacrylamide gel electrophoresis (SDS-PAGE) according to the method of Laemmli (1970) using acrylamide concentrations of 5% for stacking gel and 12% for resolving gel. The sarcoplasmic and myofibrillar extracts were mixed in a ratio of 1:1 (v/v) with Laemmli sample buffer (Bio Rad Laboratories, Hercules, CA, USA) containing 65.8 mm Tris–HCl, pH 6.8, 26.3% (w/v) glycerol, 2.1% SDS and 0.01% bromophenol blue, heated at 100 °C in a water bath (PolyScience, Niles, IL, USA) for 5 min prior to the electrophoresis. The wells of the electrophoresis gel were loaded with 20 μL of the protein extract. Standard proteins (Bio Rad Laboratories) were run simultaneously for molecular mass identification. Electrophoresis was conducted at a constant current of 50 V for stacking gel and 100 V for separating gel by using Mini-PROTEAN® Tetra Cell (Bio-Rad Laboratories). For staining the gels, 0.05% Coomassie Brilliant Blue R-250 dissolved in 15% (v/v) methanol and 5% (v/v) acetic acid was used. The gels were destained in a solution of 60% (v/v) distilled water, 30% (v/v) methanol and 10% (v/v) acetic acid. Next, the gels were placed in the BIO-RAD Gel Doc™ EZ Imager and documented.
Statistical analysis
Three independent experimental trials (replications) were conducted, with twelve loins utilised in each trial. All measurements were performed in quadruplicate, and the data were expressed as mean ± SD. To assess the significance of the experimental factors on the studied characteristics, a two-way analysis of variance (Anova) using the MIXED procedure in the SPSS software package version 22.0 for Windows (SPSS, Inc., Chicago, IL, USA) was carried out. However, treatment (C, LOCK, BAUER, BB12), storage time (28, 90, 180, 270, or 360 days) and their interactions were considered as fixed effects, and replication and its interactions were included in the model as random effects. When a significant F-value was found, Tukey's post hoc test was used to determine the source of significance, which was set at two confidence levels (P < 0.05 and P < 0.01).
Results and discussion
The significance levels of the factors included in the experiment, as obtained by the Anova are presented in Table 1. Fixed effects, that is, treatment, storage time and the interaction between them showed a significant effect on physico-chemical and proteolysis-related parameters of dry-cured loins. Replication (random effect) and the correspondent interactions between replication and the other factors showed no significant effects on the characteristics tested. Therefore, results and discussion has been focused on fixed effects.
Significance levels showed by the experimental factors and their interactions for the characteristics of dry-cured loins during cold storage
| Factor | Physico-chemical parameters | Proteolysis-related parameters | Proteolysis degree (–NH2) | |||||
|---|---|---|---|---|---|---|---|---|
| pH | aw | ORP | TN | NPN | PI | WSF | SSF | |
| Treatment (T) | ** | ** | * | ** | ** | ** | ** | ** |
| Storage time (S) | ** | ** | ** | ** | ** | ** | ** | ** |
| T × S | ** | ** | ** | ** | ** | ** | ** | ** |
–NH2, the content of primary amino groups; NPN, non-protein nitrogen; ORP, oxidation–reduction potential; PI, proteolysis index; SSF, salt-soluble fraction; TN, total nitrogen; WSF, water-soluble fraction.
*P < 0.05.
**P < 0.01.
Physico-chemical parameters
The means and standard deviations of pH, aw and ORP values during storage from day 28 to day 360 are shown in Table 2. During the whole storage period, the pH values were within the optimum range for growth of L. acidophilus and Bifidobacterium (De Vuyst, 2000). Treatment method and storage time affected the pH values of loins (P < 0.01). Loins inoculated with LAB strains exhibited, in all the sampling times, significantly lower pH (P < 0.05) than the control sample (C), which underwent spontaneous fermentation. These results correspond with the findings of other authors who confirmed the effectiveness of the inoculation with LAB for acidification of dry-cured meat products (Stadnik et al., 2014; Okoń et al., 2017a; Wójciak et al., 2017). In three sampling times (90, 270, 360 days of storage) significantly (P < 0.05) lower pH values were observed for loins with Bifidobacterium (BB12) compared to both samples with Lactobacillus. The lowest pH values were registered after 180 days of storage, followed by a systematic increase of this parameter up to 360 days of storage. The observed trend was in agreement with those reported by other authors (Grazia et al., 1986; Salgado et al., 2005) who attributed the increase in pH values to the decrease in lactic acid concentration rather than to the formation of low molecular weight nitrogen compounds, which corresponds to the results of TN and NPN obtained in this study.
Physico-chemical parameters of dry-cured loins with probiotic strains of LAB during cold storage (mean ± SD)
| Storage time (days) | Treatment | |||
|---|---|---|---|---|
| C | LOCK | BAUER | BB12 | |
| pH | ||||
| 28 | 5.67 ± 0.06cA | 5.52 ± 0.07bB | 5.57 ± 0.05bB | 5.57 ± 0.05abB |
| 90 | 5.70 ± 0.04bcA | 5.59 ± 0.02bB | 5.58 ± 0.02bB | 5.49 ± 0.02bC |
| 180 | 5.58 ± 0.01dA | 5.37 ± 0.04cC | 5.43 ± 0.03cB | 5.46 ± 0.03bB |
| 270 | 5.76 ± 0.05bA | 5.57 ± 0.06bB | 5.59 ± 0.02bB | 5.47 ± 0.10bC |
| 360 | 5.85 ± 0.04aA | 5.73 ± 0.06aB | 5.72 ± 0.08aB | 5.62 ± 0.10aC |
| aw | ||||
| 28 | 0.92 ± 0.00aA | 0.91 ± 0.00bB | 0.91 ± 0.00cB | 0.91 ± 0.00bcB |
| 90 | 0.92 ± 0.00aB | 0.93 ± 0.00aA | 0.93 ± 0.00aA | 0.93 ± 0.00aA |
| 180 | 0.92 ± 0.00aA | 0.91 ± 0.00bB | 0.92 ± 0.00bA | 0.92 ± 0.00bA |
| 270 | 0.90 ± 0.00bB | 0.90 ± 0.00cB | 0.91 ± 0.00cA | 0.90 ± 0.00cB |
| 360 | 0.89 ± 0.00cA | 0.89 ± 0.00dA | 0.89 ± 0.00dA | 0.89 ± 0.00dA |
| ORP (mV) | ||||
| 28 | 293.38 ± 10.20cA | 279.42 ± 7.47dB | 269.65 ± 2.62dB | 269.92 ± 9.04dB |
| 90 | 318.43 ± 2.84bA | 315.25 ± 4.04cA | 294.14 ± 2.24cC | 307.62 ± 4.29bB |
| 180 | 300.31 ± 4.94cA | 269.94 ± 5.78dD | 277.30 ± 5.23dC | 290.12 ± 4.38cB |
| 270 | 350.07 ± 4.94aA | 342.60 ± 7.96bAB | 336.58 ± 5.34bB | 339.83 ± 6.79aB |
| 360 | 360.51 ± 5.19aA | 356.81 ± 3.39aA | 363.94 ± 3.79aA | 343.97 ± 13.40aB |
C = control sample; LOCK = sample inoculated with Lactobacillus rhamnosus LOCK900; BAUER = sample inoculated with Lactobacillus acidophilus Bauer Ł0938; BB12 = sample inoculated with Bifidobacterium animalis subsp. lactis BB-12; ORP = oxidation-reduction potential.
(a–e) within the same treatment (column), means followed by the common letter do not differ significantly (P < 0.05).
(A–D) within the same storage time (row), means followed by the common letter do not differ significantly (P < 0.05).
Water activity of dry-cured pork loins was significantly (P < 0.01) affected by treatment and storage period (Table 1). As shown in the Table 2, aw values decreased (P < 0.05) gradually along the storage time, corresponding to the course described by other authors with respect to evolution of this parameter in vacuum packed dry-cured products (Trząskowska et al., 2014; Neffe-Skocińska et al., 2017; Okoń et al., 2017a). This decrease was most pronounced for sample LOCK, with a mean water activity loss of 0.03 (Table 2). The observed aw values indicate statistically significant differences (P < 0.01; Table 1) between samples but the influence of treatment on the behaviour of this parameter was ambiguous during the whole storage period. Generally, samples with Lactobacillus and Bifidobacterium strains showed lower aw values compared to these which undergone spontaneous fermentation (C), however, no statistically significant differences were demonstrated between C, BAUER, and BB12 treatments at 180 and 360 days. Water availability is one of the most important factors affecting activity of muscle enzymes involved in proteolysis of dry-cured meat products (Roseiro et al., 2008; Kołożyn-Krajewska & Dolatowski, 2012). The generation of low molecular weight nitrogen compounds in the course of protein degradation has a depressing effect on water activity of dry-cured meat products (Marra et al., 1999). The lowest final pH of the inoculated samples may have also favoured water loss by reduction of the water holding capacity.
The oxidation–reduction potential (ORP; Table 1) was significantly affected by treatment (P < 0.05) and storage period (P < 0.01). ORP of the loins showed a steady increase with the storage time, finding significant differences (P < 0.05) for all samples between day 180 and 270 when the increase was most pronounced. However, at 180 days of storage, the ORP of the samples showed a decrease as compared with the earlier sampling time (Table 2). Results of the ORP of the control sample (C) reached at day 28, 180 were significantly higher (P < 0.05) than those of all inoculated samples. These results coincide with the findings of other authors (Okoń et al., 2017a) who showed higher ORP values for spontaneously fermented samples compared to dry-cured loins inoculated with starter cultures. The most significant effect of Lactobacillus and Bifidobacterium was observed at the initial storage period (28 days), where ORP was approximately 14–24 mV lower for samples with probiotic strain with respect to the control (293.38 mV).
Microbiological analysis
The overall microbiological quality of dry-cured loins with probiotic strains of LAB during cold storage, as indicated by total viable count (TVC) is presented in Fig. 1a. The initial TVC ranges from 6.59 to 7.12 log CFU g−1 for the LOCK and the BB12 sample, respectively, on day 28. It increased to a maximum level in these samples, as well as in the control loin, on the day 90 of cold storage, a slight decrease was observed. BAUER had the highest and LOCK the lowest TVC of 7.52 and 5.52 log CFU g−1 at day 360, respectively. The changes in TVC were similar to those reported in other studies on dry-cured meat products (Aro Aro et al., 2010; Bedia et al., 2011). The TVC of more than 6 log CFU g−1 is usually associated with the presence of dominant micro-organisms in the product. In meats inoculated with bacterial starter cultures, the starter bacteria are therefore the predominant organisms and other bacteria are present usually only in small numbers due to the acidity produced during the fermentation, as it has been shown in this study (HPA, 2009).
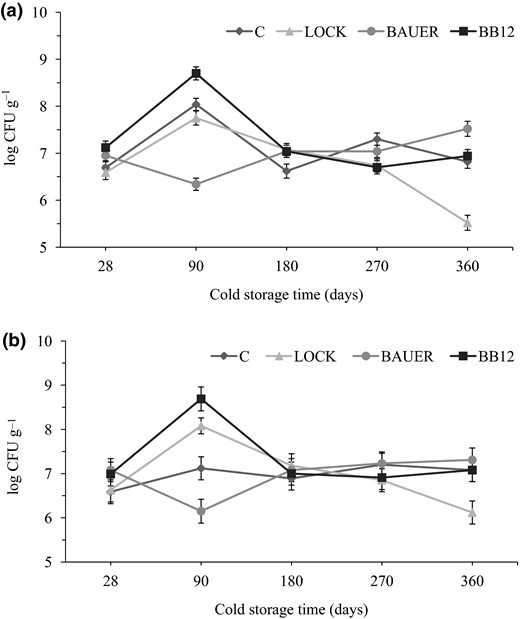
Microbiological counts (log CFU g−1) of dry-cured loins with probiotic strains of LAB during cold storage period. (a) Total viable counts; (b) lactic acid bacteria. C = control sample; LOCK = sample inoculated with Lactobacillus rhamnosus LOCK900; BAUER = sample inoculated with Lactobacillus acidophilus Bauer Ł0938; BB12 = sample inoculated with Bifidobacterium animalis subsp. lactis BB-12.
The initial number of LAB was similar for the control and inoculated samples (Fig. 1b). After 90 days of cold storage, their population in LOCK and BB12 was higher by approximately one logarithmic level compared to the control. At this sampling time, loins with L. acidophilus Bauer Ł0938 addition were characterised by worse survivability of LAB (6.15 log CFU g−1) than other inoculated loins. During the subsequent storage period, the counts for the inoculated samples remained constantly at high levels above 6 log CFU g−1, showing a slight decrease at the end of the storage period for LOCK samples. The counts of the LAB in dry-cured loins were consistent with their pH (Table 2). Similar LAB counts to those of this study have been reported in loins containing potentially probiotic strain L. acidophilus Bauer (Jaworska et al., 2011). LAB counts for the control sample rose from 6.59 ± 0.27 on day 28 to 7.08 ± 0.26 on day 360 It is not surprising as lactobacilli are common in the natural microbiota of fermented meats (Kumar et al., 2017).
Proteolysis-related parameters
Table 3 shows the proteolysis-related values of loins from day 90 to day 360 of storage, during which time TN content decreased while NPN content increased. However, the evolutional behaviour of nitrogen fractions differs between treatments (P < 0.01). The concentration of TN in the control sample increased (P < 0.05) showing a maximum after 180 days of storage (5.77 g per 100 g), and then decreased, reaching similar values to those after 90 days of storage. In inoculated samples, the total nitrogen showed a steady increase, reaching the maximum at 270 days of storage (Table 3). At 360 days of storage, the concentration of TN in the inoculated samples showed a decrease, reaching similar values to those in the control sample, except the BAUER sample, which significantly showed the lowest (P < 0.05) TN content.
Proteolysis-related parameters of dry-cured loins with probiotic strains of LAB during cold storage (mean ± SD)
| Storage time (days) | Treatment | |||
|---|---|---|---|---|
| C | LOCK | BAUER | BB12 | |
| TN (g per 100 g) | ||||
| 90 | 5.40 ± 0.14bA | 5.26 ± 0.18aA | 4.89 ± 0.10cC | 5.10 ± 0.17bB |
| 180 | 5.77 ± 0.01aA | 5.41 ± 0.07aB | 5.20 ± 0.07bC | 5.21 ± 0.10bC |
| 270 | 5.28 ± 0.20bB | 5.40 ± 0.18aB | 6.00 ± 0.27aA | 5.50 ± 0.10aB |
| 360 | 5.06 ± 0.04cA | 4.92 ± 0.23bAB | 4.80 ± 0.09cB | 4.95 ± 0.08cAB |
| NPN (g per 100 g) | ||||
| 90 | 1.12 ± 0.04aA | 0.95 ± 0.09cB | 0.99 ± 0.07bB | 0.98 ± 0.02cB |
| 180 | 1.03 ± 0.08bB | 1.12 ± 0.09bB | 1.24 ± 0.08aA | 1.08 ± 0.05bB |
| 270 | 1.17 ± 0.03aB | 1.30 ± 0.06aA | 1.30 ± 0.06aA | 1.21 ± 0.04aB |
| 360 | 1.06 ± 0.03bC | 1.23 ± 0.04bB | 1.31 ± 0.05aA | 1.15 ± 0.06aBC |
| PI | ||||
| 90 | 20.58 ± 0.76bA | 18.12 ± 1.19cB | 20.13 ± 1.63cA | 19.06 ± 0.98cB |
| 180 | 17.09 ± 1.40cC | 20.76 ± 1.57bB | 23.91 ± 1.38aA | 20.69 ± 1.26bcB |
| 270 | 22.28 ± 0.93aB | 24.05 ± 1.51aA | 21.57 ± 0.63cB | 21.99 ± 0.94abB |
| 360 | 21.03 ± 0.61abC | 22.86 ± 1.88abBC | 23.23 ± 1.35bB | 27.33 ± 1.08aA |
C = control sample; LOCK = sample inoculated with Lactobacillus rhamnosus LOCK900; BAUER = sample inoculated with Lactobacillus acidophilus Bauer Ł0938; BB12 = sample inoculated with Bifidobacterium animalis subsp. lactis BB-12.
NPN, non-protein nitrogen; PI, proteolysis index; TN, total nitrogen.
(a–c) within the same treatment (column), means followed by the common letter do not differ significantly (P < 0.05).
(A–C) within the same storage time (row), means followed by the common letter do not differ significantly (P < 0.05).
The changes in the average values of the non-protein nitrogen content (expressed as mg of nitrogen per 100 g of sample) of the loin pieces for each length of storage time are shown in Table 3. The NPN concentration reflects the degree of proteolysis during manufacturing of dry-cured meat products (Virgili et al., 2007; Dalmış & Soyer, 2008; Lorenzo et al., 2008; Candogan et al., 2009). Free amino acids and low molecular weight peptides are the main components of the non-protein nitrogen fraction in dry-cured meats and contribute, directly or indirectly, to the generation of volatile and non-volatile flavour compounds (López et al., 2015). Storage time and starter addition significantly affected NPN content (P < 0.01). The concentration of NPN in the control sample decreased significantly (P < 0.05) after 180 days of storage after which it remains unchangeable until the end of the storage process. The concentration of NPN in inoculated samples increased progressively during the storage process showing a maximum for samples LOCK and BB12 after 270 days of storage and for BAUER sample, at the next sampling time. These results suggest that proteolysis continued in this sample after day 180 up to day 270 could therefore play an important role in the sensorial changes of loins. Flores et al. (1997) related an increase in the NPN fraction during fermentation of sausages inoculated with starter culture mix to a corresponding decrease in sausage pH value. Higher concentration of low-weight nitrogenous molecules found in inoculated loins (Table 3) associated with the lower pH of those samples (Table 2), suggests enhancement of meat protein degradation by acidification, which increases the activity of muscle proteases. When the effects of three strains used in this study were compared, NPN concentrations after 360 days of storage were the highest to the lowest in the following order: L. acidophilus Bauer Ł0938 > L. rhamnosus LOCK900 > B. animalis subsp. lactis BB-12. The final results (360 days) for NPN obtained for BB12 sample were similar to those in the control sample (P > 0.05).
The intensity of proteolysis in loins as assessed by the proteolysis index (PI) defined as the percentage of non-protein nitrogen accounting for total nitrogen, is shown in Table 3. Treatment and storage time significantly affected PI of dry-cured loins (P < 0.01). The PI gradually increased during storage reaching a maximum for samples C and LOCK after 270 days of storage and for BAUER and BB12, at the next sampling time. A similar trend was reported for Jinhua ham (Zhao et al., 2008) and dry sausage (Bedia et al., 2011) when the PI increased during processing. At the end of storage, the intensity of proteolysis, as assessed by the proteolysis index was found to be less (P < 0.05) in the LOCK and BAUER samples than in BB12 sample. These differences may be due to the loss of protease activity provided by probiotic strains by the stronger acidification of LOCK and BAUER samples (Bedia et al., 2011). Irrespective of the culture added, the loins showed similar degree of proteolysis to those reported in other dry-cured meat products made from whole pieces (Schivazappa et al., 2002; Ruiz-Ramírez et al., 2006).
Proteolysis degree of muscle protein fractions
Generation of free amino acids and small peptides with the contribution of aminopeptidases is the last step in the proteolytic transformation of muscle proteins. Determination of the content of primary amino groups of peptides or amino acids by the reaction with TNBS reagent has been used previously to evaluate proteolysis degree (Gao et al., 2015; Rysman et al., 2016).
The Anova showed a significant effect of treatment (P < 0.01) and time (P < 0.01) and an interaction between them (P < 0.01) on the proteolysis degree of WSF and SSF. Changes in proteolysis degree of WSF are summarised in Table 4. The degree of proteolysis of all samples steadily increased (P < 0.05) with time during the whole storage period of 360 days, indicating proteolytic changes in dry-cured pork loins. At the end of the storage process, proteolysis degree of the control was the most among the samples, which was followed by the BAUER and LOCK sample, and that of the sample containing B. animalis subsp. lactis BB12 was the least. There was no significant difference (P > 0.05) in the content of primary amino groups in WSF between the control and the inoculated samples on day 28, suggesting that there was no additional proteolysis in inoculated loins compared with the control during the initial step of storage. These results can be explained by the fact that the first step in protein hydrolysis during ageing is the sum degradation of muscle proteins to polypeptides and is due to the activity of muscle proteases and only assisted by the LAB`s contribution through acidification of the environment. Further hydrolysis of sarcoplasmic proteins and generation of peptides and free amino acids is attributed to enzymes of microbial origin, as well as to the remaining activity of the endogenous meat enzymes (Candogan et al., 2009). Similar conclusions have also been made by Wang et al. (2017) during the assessment of the degree of fish sarcoplasmic proteins by Lactobacillus plantarum 120. Starting from the second experimental period (90 days), the content of primary amino groups increased, and the increase was greater in samples with probiotic strains of LAB than in the sample undergoing spontaneous fermentation (P < 0.01). There were no statistically significant differences (P > 0.05) in the proteolysis degree of WSF between LOCK and C sample on 180 and 270 days of analysis. Also, Stadnik & Dolatowski (2013) reported that dry-cured pork loins inoculation with an L. casei ŁOCK 0900 probiotic strain does not significantly affect the degree of proteolysis in the examined meat products.
Proteolysis degree (μm leucine amino equivalent per g) of WSF (mean ± SD)
| Storage time (days) | Treatment | |||
|---|---|---|---|---|
| C | LOCK | BAUER | BB12 | |
| 28 | 104.07 ± 4.67dA | 111.47 ± 1.56dA | 102.57 ± 12.35cA | 110.61 ± 15.62eA |
| 90 | 111.59 ± 3.52dC | 132.21 ± 8.49dB | 128.24 ± 6.16cB | 148.17 ± 10.05dA |
| 180 | 218.95 ± 5.50cB | 235.90 ± 35.03cB | 267.63 ± 24.26bA | 247.10 ± 13.46cAB |
| 270 | 251.85 ± 13.20bB | 251.70 ± 11.84bB | 301.93 ± 10.71bA | 285.07 ± 3.60bA |
| 360 | 393.33 ± 18.77aA | 375.05 ± 47.72aB | 379.82 ± 41.47aB | 327.63 ± 30.69aC |
C = control sample; LOCK = sample inoculated with Lactobacillus rhamnosus LOCK900; BAUER = sample inoculated with Lactobacillus acidophilus Bauer Ł0938; BB12 = sample inoculated with Bifidobacterium animalis subsp. lactis BB-12; WSF = water-soluble fraction.
(a–e) within the same treatment (column), means followed by the common letter do not differ significantly (P < 0.05).
(A–C) within the same storage time (row), means followed by the common letter do not differ significantly (P < 0.05).
Regarding the SSF, the content of protein degradation products was significantly lower, on average 2.5-fold at the beginning of the process (28 days) up to 360 days, where 4.6-fold lower primary amino groups content was noted as compared to WSF (Table 5). Generally, there was an upward trend in the content of this parameter related to proteolysis over time, which is consistent with the tendency observed for the WSF fraction. Effect of treatment was not unambiguous throughout the cold storage period. In the initial stage (28 days), the largest difference was observed between BB-12 and the untreated sample (P < 0.05). In the later stages of storage, the highest values of the primary amino groups, the content was observed for the sample inoculated with L. acidophilus Bauer Ł0938 strain (P < 0.05), emphasising their involvement in SSF protein degradation. Previous findings of Okoń et al. (2017b) also revealed a significant contribution of L. acidophilus Bauer and B. animalis subsp. lactis BB12 to the generation of products of protein proteolysis during storage of dry-cured pork loins.
Proteolysis degree (μm leucine amino equivalent per g) of SSF (mean ± SD)
| Storage time (days) | Treatment | |||
|---|---|---|---|---|
| C | LOCK | BAUER | BB12 | |
| 28 | 43.56 ± 0.45cA | 39.02 ± 0.29cAB | 45.23 ± 0.10cA | 34.63 ± 0.25dB |
| 90 | 41.10 ± 8.58cAB | 33.67 ± 4.42cC | 40.22 ± 4.72cAB | 44.86 ± 6.64cA |
| 180 | 61.07 ± 4.92bB | 62.33 ± 4.55abB | 85.54 ± 2.56abA | 59.48 ± 9.07bB |
| 270 | 57.31 ± 5.24bB | 57.31 ± 5.31bB | 81.94 ± 2.88bA | 55.70 ± 2.39bB |
| 360 | 84.66 ± 5.36aAB | 67.18 ± 4.41aC | 90.38 ± 7.64aA | 79.63 ± 4.84aB |
C = control sample; LOCK = sample inoculated with Lactobacillus rhamnosus LOCK900; BAUER = sample inoculated with Lactobacillus acidophilus Bauer Ł0938; BB12 = sample inoculated with Bifidobacterium animalis subsp. lactis BB-12; SSF = salt-soluble fraction.
(a–d) within the same treatment (column), means followed by the common letter do not differ significantly (P < 0.05).
(A–C) within the same storage time (row), means followed by the common letter do not differ significantly (P < 0.05).
Proteolysis degree of muscle protein fractions
Myofibrillar and sarcoplasmic protein degradation was assessed by SDS-PAGE. Figure 2 shows the electrophoretograms for the WSF and SSF extracted from loins after 28, 180 and 360 days of storage. Throughout the storage period, notable changes in sarcoplasmic and myofibrillar protein patterns of loins were evident, with resultant identical patterns at the end of the storage.
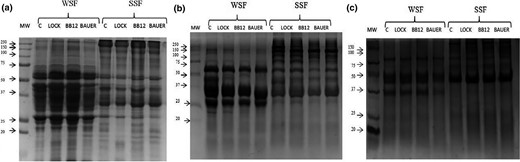
SDS-PAGE electrophoresis results. MW = molecular weight standard (kDa); C = control sample; LOCK = sample inoculated with Lactobacillus rhamnosus LOCK900; BAUER = sample inoculated with Lactobacillus acidophilus Bauer Ł0938; BB12 = sample inoculated with Bifidobacterium animalis subsp. lactis BB-12; WSF = water-soluble fraction; SSF = salt-soluble fraction; a, b, c = fractions extracted from dry-cured pork loin after 28, 180 and 360 days of storage respectively.
Hydrolysis of the sarcoplasmic proteins seemed to occur gradually during storage, with the major changes observed within 50–25 kDa, which confirms the observations of other authors with regard to dry-cured meat products (Candogan et al., 2009; Gallego et al., 2016). Some of the new assemblies appearing in the gel, mainly at the end of storage, may be due to the presence of fragments of sarcoplasmic proteins, but also from soluble proteolysis products of myofibrillar proteins that have been extracted and analysed together with the sarcoplasmic fraction (Larrea et al., 2006).
Changes in the myofibrillar protein profile were also observed over the storage period (Fig. 2). Degradation of the myofibrillar proteins, major fraction of the muscle proteins, is largely responsible for the texture of muscle tissue, which is a decisive factor in storage of dry-cured products. The SSF fraction was characterised by a large amount of proteins 250–100 kDa, especially after 28 and 180 days of storage, (Fig. 2a, b), which in the next sampling time (360 days) underwent strong proteolysis, forming large components of about 50 kDa (Fig. 2c). After 28 days of storage samples of SSF (lanes 5–8; Fig. 2a) showed a band, presumed to be either nebulin or titin, on the top of the gel. This band disappeared in the next sampling times. The intensity of heavy chain myosin band (around 200–220 kDa) and the α-actinin band (around 94 kDa) markedly decreased over storage.
A smear of low molecular weight bands (<20 kDa) was found at different stages of storage (especially after 360 days). These protein bands displayed a continuously increasing background in the electrophoretic images in the course of progressive dry-cured loins ageing and they have been linked to intense degradation of the myofibrillar proteins and generation of low molecular weight peptides and free amino acids (Larrea et al., 2006).
The effect of LAB on proteolytic changes based on electrophoresis has not been resolved. In the present experiment, the results were unclear because the assignment of change in position and intensity was done according to the theoretical location based on their molecular weight, and in many cases, the amount of protein degradation products increased during processing due to overlap in the gel, affecting efficiency and reliability of proteins identification (Gallego et al., 2016). Nevertheless, during storage, the modifications produced on the sarcoplasmic proteins were more pronounced than those exerted on the myofibrillar protein fraction, as was previously reported (Fadda et al., 1999; Spaziani et al., 2009).
Conclusion
The results demonstrated that the physico-chemical and proteolysis-related parameters of dry-cured loins underwent various modifications during 360 days of storage due to the combined action of meat endogenous proteases and proteases from L. rhamnosus LOCK900, B. animalis subsp. lactis BB12 and L. acidophilus Bauer Ł0938. The contribution of physico-chemical parameters such as water activity, pH and oxidation–reduction potential to the development of proteolysis has been confirmed. Higher intensity of proteolysis, as assessed by NPN and PI in inoculated samples could be attributed to the decrease in pH value of loins. Higher concentration of low-weight nitrogenous molecules found in inoculated loins associated with the lower pH of that samples, suggests the enhancement of meat protein degradation by acidification, which increases the activity of muscle proteases. According to SDS-PAGE results, both proteolytic systems (endogenous and microbial) induced changes in the analysed dry-cured loins. The modifications produced during storage on the sarcoplasmic proteins were more pronounced than those exerted on the myofibrillar protein fraction.
