


Abstract
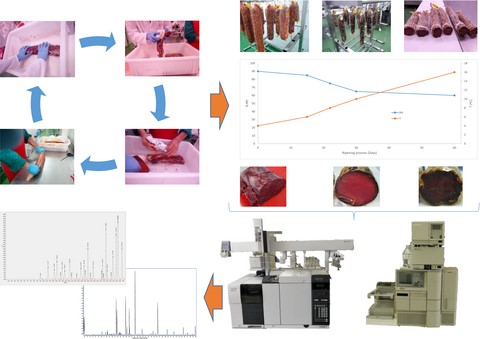
The changes on chemical composition, physico-chemical parameters, free fatty acids and free amino acids content of dry-cured deer loin were investigated at day 0, 30 and 60 of dry-cured process. On the whole, except for pH values (≈5.6) and composition (fat: 4.6–5.2%; protein: ≈73%; ash: ≈17.5%) that did not show differences between the processing days, the other physico-chemical parameters were affected by curing process. Colour parameters and moisture (from 69 to 38.4%) decreased while the hardness increase from 12.35 to 342 N and lipid oxidation (from 0.2 to 0.52 mg MDA/kg) increased as dry-cured stage progresses. In similar way, free fatty acid (2250 mg per 100 g of fat at 0 day and 5940 mg per 100 g of fat at 60 days) and free amino acid content (914 mg per 100 g DM at 0 day and 1253 mg per 100 g DM at 60 days) increased progressively as the curing process progressed. The behaviour of this product during processing is similar to that described for the same product made with other animal species. Therefore, deer meat is an excellent candidate for the production of dry-cured loin, which would allow introducing a new product on the market.
Introduction
Nowadays, a wide variety of meat products are produced around the world (Gomez et al., 2015; Domínguez et al., 2019). As occurs with other dry-cured meat products, dry-cured loin is one of the most valuable cured meat product which present a characteristic flavour (Ramírez & Cava, 2007). The different compounds derived from the reactions during manufacture process and from the spices contribute to the formation of the “typical” aroma (Domínguez et al., 2019).
There are many studies related with the changes produced during dry-cured loin manufactured in pork loins (Pateiro et al., 2015; Tejada et al., 2016; Zhou et al., 2017), although one was made with foal loin (Lorenzo & Carballo, 2015). However, there are no studies conducted with deer meat. Taking into account that genetic factors influence enzymatic activities and that the meat composition influence the biochemical changes produced during the different stages of dry-cured meat process (Bermúdez et al., 2018), the results obtained in this research will provide us with information about the possibility of using deer meat for the preparation of dry-cured loin. In this context, venison meat is characterised by low fat and cholesterol contents and high levels of protein, essential amino acids, essential and long-chain polyunsaturated fatty acids and iron (Lorenzo et al., 2019; Maggiolino et al., 2019; Serrano et al., 2019).
Therefore, the objective of the present study was to assess the changes on chemical and physico-chemical parameters, lipolysis and proteolysis activity during the manufacture of deer dry cured loin.
Materials and methods
Animal sampling
For the present study, we used forty loins from male wild red deer (60.2 ± 6.8 kg of skinned carcass weight) of Iberian genetic line (Cervus elaphus) hunted in Spain in two different months. Carcass were managed as reported by Maggiolino et al. (2019), and from each carcass, the left longissimus thoracis et lumborum (LTL) muscle was dissected, vacuum packed and transported in refrigerated conditions for dry-cured loin manufacture.
Manufacture of dry-cured loin
Loins with an average weigh of 1.91 ± 0.47 kg were rubbing with 3 g kg−1 of nitrifying salts (containing 5% of sodium nitrate and 5% of sodium nitrite) and an excess of salt. They were left to rest for 24 h to allow the salt to penetrate. After this time, the loins were brushed to remove excess of salt and seasoned by rubbing with the spices (paprika 15 g kg−1; oregano 0.5 g kg−1; fresh garlic 2 g kg−1; virgin olive oil 25 g kg−1). Loins were kept at 2 °C for 2.5 days to allow the seasoning mixture penetrate. After seasoned stage a piece of approximately 100 g was cut of each loin and treated as the initial point of dry-cured process (0 day). Then, loins were stuffed into 75 mm collagen casings and transferred to a dry-cured room where they stayed 30 days with different temperature and relative humidity conditions (from 0 to 14 days: 4–6 °C and 85–90% RH; from 15 to 21 days: 6–8 °C and 80–85% RH; from 22 to 30 days: 8–10 °C and 70–75% RH). At day 30, a piece of 100 g of each loin was taken to analyse, representing the intermediate point (30 days) of the dry-cured process. The rest of loins were maintained for another 30 days at 14–16 °C and 60–65% RH until the final point of dry-cured process (60 days). After colour, pH and texture analysis, each sample collected was minced to produce a homogeneous mixture, vacuum packed and storage under refrigerate conditions (no more than 2 days) before analysis. The manufacture process was replicated in two different months (September and October of 2017).
Physico-chemical, lipid oxidation and composition analysis
The pH, colour, texture profile analysis and TBARS were determined following the procedures described by Pateiro et al. (2015), moisture, protein and ash were quantified according to the ISO recommended standards (ISO 1442, 1997; ISO 936, 1998; ISO 937, 1978, respectively) and total fat was extracted according to the AOCS Official Procedure Am 5-04 (AOCS, 2005).
Free fatty acids analysis
Total intramuscular fat was extracted from 10 g of sample (Bligh & Dyer, 1959) and free fatty acids were separated from 20 mg of fat using Strata NH2 mini-columns (1 mL; 100 mg tubes; Phenomenex, Madrid, Spain) (Kaluzny et al., 1985). The free fatty acids were transesterified and analysed following the procedure described by Domínguez et al. (2015).
Free amino acids analysis
Free amino acids were extracted from 5 g of sample using HCl solution, as described by Pérez-Palacios et al. (2010). The extracted amino acids were derivatised and analysed following the conditions proposed by Domínguez et al. (2015).
Statistical Analysis
A total of 120 samples were used in the present study [twenty loins (replicates) × three processing days (‘0, 30 and 60’) × two manufacture process (September and October)]. Normal distribution and variance homogeneity were previously tested (Shapiro–Wilk). Data from chemical composition, physico-chemical parameters, free fatty acids and free amino acids were examined using an analysis of variance (Anova) with the mixed-model. Chemical composition, physico-chemical parameters, free fatty acids and free amino acids were included in the model as dependent variables, while processing day was included as fixed effect and the two different manufacture process as random effect. Duncan's test was performed to compare the mean values for the different processing days and difference were considered at α = 0.05 level. Values are given as mean ± SD. All statistical analysis were achieved using IBM SPSS statistics for Windows (version 21.0; IBM Corp., New York, NY, USA).
Results and discussions
Changes on compositional and physico-chemical parameters
The evolution of chemical composition and physico-chemical parameters is shown in Table 1. The pH values (≈5.8) found in deer loin were similar to those reported by other authors in dry-cured loins, who described values between 5.56 and 5.90 (Lorenzo & Carballo, 2015; Pateiro et al., 2015; Abellán et al., 2018). In our research, the values of pH did not vary during the manufacture process. This aspect is in accordance with the results found by Abellán et al. (2018) who also found that in dry-cured loins made with refrigerated pieces (as in the present research) the pH values remained constant during the dry-cured process. In contrast, other authors found in loin (Lorenzo & Carballo, 2015; Pateiro et al., 2015), ham (Bermúdez et al., 2014) or cecina (Lorenzo, 2014) that the pH values increases as the dry-cured time progresses. The increase on pH values in these studies could be related with the liberation of alkaline compounds, mainly from proteolytic reactions (Virgili et al., 2007).
Evolution of physico-chemical and composition parameters during the manufacturing process of dry-cured deer loin
| Processing day | Sig. | |||
|---|---|---|---|---|
| Day 0 | Day 30 | Day 60 | ||
| pH | 5.57 ± 0.09 | 5.60 ± 0.06 | 5.57 ± 0.13 | ns |
| Colour | ||||
| L* | 28.43 ± 2.11c | 27.13 ± 1.47b | 23.50 ± 1.23a | *** |
| a* | 12.83 ± 2.01b | 12.18 ± 1.82b | 5.02 ± 1.42a | *** |
| b* | 8.51 ± 2.52c | 5.57 ± 1.34b | 2.89 ± 0.88a | *** |
| Composition (g per 100 g) | ||||
| Moisture | 68.98 ± 1.59c | 58.79 ± 2.63b | 38.84 ± 2.87a | *** |
| Fat (dry matter) | 5.20 ± 0.40 | 4.78 ± 0.73 | 4.60 ± 0.99 | ns |
| Protein (dry matter) | 72.91 ± 1.04 | 72.97 ± 2.37 | 73.13 ± 2.95 | ns |
| Ash (dry matter) | 17.55 ± 1.06 | 17.48 ± 0.46 | 17.69 ± 0.99 | ns |
| TBARs (mg MDA kg−1) | 0.20 ± 0.05a | 0.30 ± 0.10b | 0.52 ± 0.17c | *** |
| Texture (TPA) | ||||
| Hardness (N) | 12.35 ± 4.64a | 79.21 ± 17.75b | 342.19 ± 56.86c | *** |
| Chewiness (N mm) | 2.25 ± 1.09a | 18.58 ± 6.88b | 62.68 ± 13.56c | *** |
a–cMean values in the same row (corresponding to the same parameter) not followed by a common number differ significantly at α = 0.05 level (Duncan test). Sig.: significance: ***α = 0.001 level, ns (not significant).
Regarding colour parameters, all values suffered a significant decrease during the manufacturing process (Figure S1). The most intense decrease of colour parameters was seen in the last stage (last 30 days of the process), as occurs in other studies (Lorenzo, 2014; Pateiro et al., 2015). There are obvious colour changes among the three processing points. L* values decreased from 28.43 at 0 day to 23.50 at 60 days. This reduction was related to formation of dark colour in the dry-cured loins due to browning reactions (Pateiro et al., 2015). Many authors found a positive correlation between moisture content and L* values, which explains in part the decrease of L* values as the moisture content of the loins decreases (Lorenzo & Carballo, 2015; Pateiro et al., 2015). In the same line, other authors concluded that moisture loss raised some pigments, as myoglobin, which causes a reduction of L* values (Sanabria et al., 2004). In similar way, the reduction on a* (from 12.83 to 5.02) and b* values (from 8.51 to 2.89) are related with the changes occurring in myoglobin state (Lorenzo & Carballo, 2015), as well as the diminution of moisture and the increases of salt contents (Lorenzo, 2014).
On the other hand, except for moisture amount, the ripening process did not affect compositional parameters. Moisture content, as expected, suffered a decrease during the manufacture. This content decreased progressively as result of the conditions (temperature and relative humidity) during the drying process. The initial moisture values (68.98 g per 100 g) were slightly lower than the raw deer loin (75.8 ± 0.48 g per 100 g; data not shown), while this value agree with those described by other authors after post-seasoning stage of cured loin (Lorenzo & Carballo, 2015; Pateiro et al., 2015). This fact is due to the ‘day 0’ in the present research was considered after salting and seasoning stages, which favour moisture losses. The moisture content in the final product was 38.84 g per 100 g, similar to those described by other authors in dry-cured loins (Lorenzo & Carballo, 2015; Pateiro et al., 2015; Gómez et al., 2018). The other composition parameters were expressed as g per 100 g of dry matter. Fat content did not show significant differences (between 4.6 and 5.2 g per 100 g DM), which agree with the results reported by other authors in pork dry-cured loin, who did not find significant differences in fat content during all manufacturing process (Pateiro et al., 2015). In the same way, protein (between 72.91 and 73.13 g per 100 g DM) and ashes (between 17.48 and 17.69 g per 100 g DM) content remained constant throughout dry-curing process. The protein and ashes content in the final product were similar to those described by other authors in dry-cured loin (Lorenzo & Carballo, 2015; Pateiro et al., 2015) and cecina (Lorenzo, 2014). As occurring in our research, other authors affirm that these values did not show significant difference during manufacturing process (Lorenzo & Carballo, 2015; Pateiro et al., 2015). In contrast, others show a significant decrease in protein and a progressive increase in ash content (Lorenzo, 2014). The significant decrease in protein and a progressive increase in ash appears to be due to the increase in NaCl content during the salting and post-salting stages. In fact, Lorenzo (2014) did not find differences in the protein and ashes content between post-salting and dry-ripening stages. As commented above, in the present research, the ‘initial point’ was after salting and seasoning stages. Therefore, the content of NaCl was the same between the three processing days, which explain that in our study we did not find differences in fat, protein or ash content.
The degree of oxidation in the deer dry-cured loin was measured by TBARs. A progressive and continuous increase was observed in the TBARs value, from 0.20 mg MDA kg−1 at 0 day, to 0.30 mg MDA kg−1 at 30 days and 0.52 mg MDA kg−1 at 60 days. This progressive increase was also observed on different dry cured products such loin (Pateiro et al., 2015) or cecina (Lorenzo, 2014). The oxidation level in the final product was slightly higher than those described in other study of cured loin, who reported values of 0.34 mg MDA kg−1 at 60 days of dry-cured process (Pateiro et al., 2015), while other authors found higher TBARs value after 60 days of ripening process in dry-cured loin (1.13 mg MDA kg−1; Lorenzo & Carballo, 2015) and cecina (2.42 mg MDA kg−1; Lorenzo, 2014) than those found in the present study. The TBARs increase is due to the fact that the fatty acids released during lipolysis processes are exposed to oxygen of the environment, so they are susceptible to being oxidised. Additionally, the pro-oxidant action of salt and metallic ions present as impurities act as catalysts of oxidation, and therefore favour oxidation processes (Bermúdez et al., 2014; Lorenzo, 2014). Despite the lipid oxidation increase in the present study, the TBARs value obtained in the final product (0.52 mg MDA kg−1) was lower than the limit with is accepted as deterioration level (2–2.5 mg MDA kg−1) (Campo et al., 2006; Zhang et al., 2019).
On the other hand, the Texture Profile Analysis (TPA) showed significant differences among the processing days. As expected, all textural traits increased as increase the dry-cured process. Hardness increased from 12.35 N at the initial point, to 79.21 N at 30 days and 342.19 N at 60 days. In similar way, chewiness also increased from initial values of 2.25 N·mm to 18.58 and 62.68 N·mm at 30 and 60 days, respectively. The increase in TPA parameters have been attributed to water loss and the state of the proteins (Lorenzo, 2014). Obviously, the moisture loss from 68.98 g per 100 g in the initial point to 38.84 g per 100 g in the final point resulted in an increase in hardness and in the other textural parameters.
Changes on free fatty acids
The evolution of free fatty acids (FFA) content during the curing process of deer loin is shown in Table 2. The concentrations of FFA increased significantly during the ripening of dry-cured loin, from 2250 to 5940 mg per 100 g of fat in the final product, which agree with the results obtained in other studies who also found a progressive increase of FFA during dry-cured loin manufacturing process (Lorenzo & Carballo, 2015; Pateiro et al., 2015; Tejada et al., 2016). The more pronounced increased of FFA content occurred, as in other researches (Lorenzo, 2014; Pateiro et al., 2015), in the last stage of dry-cured process (between 30 and 60 days). In the present study, the FFA profile were the same during all process. The main FFA in both, initial and final processing points, were C16:0, C18:1n-9 and C18:2n-6, which indicated that these fatty acids were the main FFA released (Lorenzo, 2014). The same profile was previously reported in dry-cured loins (Lorenzo & Carballo, 2015; Pateiro et al., 2015; Gómez et al., 2018). The final amount of each individual free fatty acid should be the result of the balance between its release from glycerides and phospholipids and its oxidative degradation (Lorenzo & Carballo, 2015). In the final product, the major fatty acids were MUFA (2298 mg per 100 g of fat) followed by SFA and PUFA with similar amounts (≈1820 mg per 100 g of fat), which is consistent with the results of Tejada et al. (2016). With this in mind, it is easy concluded that the liberation of FFA originates mainly from the triglycerides that are richer in MUFA. These findings are in agreement with those found by Ramírez & Cava (2007) and Pateiro et al. (2015) who observed that MUFA were the predominant fatty acids at the end of the maturation of dry-cured loins. It is well known that the release of fatty acids depends, to a large extent, on the muscle enzymatic systems (Motilva et al., 1992), so that the release is directly related to the action of these lipolytic enzymes. Also an important release of the fatty acids C20:4n-6 and C18:3n-3 was observed. In the case of C20:4n-6, its content increased during all manufacturing process, while the content of C18:3n-3 increased during the first 30 days, remaining constant during the final stage. This fact could be due to the high susceptibility of this fatty acid to oxidation. It seems, therefore, that there is a balance between the release and oxidation of C18:3n-3.
Evolution of free fatty acids content (mg per 100 g of fat) during the manufacturing process of dry-cured deer loin
| Processing day | Sig. | |||
|---|---|---|---|---|
| Day 0 | Day 30 | Day 60 | ||
| C10:0 | 7.52 ± 1.42b | 5.18 ± 2.56a | 7.98 ± 3.16b | *** |
| C12:0 | 7.25 ± 2.44 | 6.14 ± 1.80 | 7.32 ± 3.35 | ns |
| C14:0 | 29.25 ± 9.28a | 41.38 ± 18.54b | 61.96 ± 21.73c | *** |
| C14:1n-5 | 5.82 ± 2.47a | 11.76 ± 7.37b | 15.02 ± 5.24c | *** |
| C15:0 | 10.58 ± 3.08a | 12.68 ± 3.63a | 21.32 ± 8.99b | *** |
| C16:0 | 471.16 ± 89.76a | 624.58 ± 116.58b | 1092.12 ± 221.65c | *** |
| C16:1n-7 | 40.89 ± 11.68a | 76.28 ± 25.25b | 156.55 ± 65.46c | *** |
| C17:0 | 11.55 ± 2.97a | 16.08 ± 3.96b | 23.68 ± 7.37c | *** |
| C17:1n-7 | 7.74 ± 2.91a | 8.02 ± 2.10a | 11.21 ± 3.46b | *** |
| C18:0 | 354.13 ± 69.18a | 356.69 ± 68.46a | 592.91 ± 108.65b | *** |
| 11t-C18:1 | 13.37 ± 4.76a | 16.10 ± 5.85a | 32.38 ± 13.05b | *** |
| C18:1n-9 | 431.03 ± 131.84a | 786.31 ± 178.83b | 1929.53 ± 421.67c | *** |
| C18:1n-7 | 47.56 ± 16.85a | 81.09 ± 18.70b | 141.23 ± 42.22c | *** |
| 9t,12t-C18:2 | 2.20 ± 0.98a | 3.43 ± 1.38b | 2.58 ± 0.94a | *** |
| C18:2n-6 | 458.03 ± 83.09a | 745.02 ± 174.22b | 1100.62 ± 179.90c | *** |
| C20:0 | 8.27 ± 3.14a | 9.11 ± 2.60a | 15.90 ± ± 5.18b | *** |
| C18:3n-6 | 8.60 ± 2.57a | 9.83 ± 2.92a | 12.08 ± 4.49b | *** |
| C20:1n-9 | 4.14 ± 1.79a | 6.28 ± 1.70b | 10.33 ± 2.77c | *** |
| C18:3n-3 | 58.54 ± 11.47a | 100.37 ± 35.40b | 116.20 ± 41.51b | *** |
| 9c,11t-C18:2 (CLA) | 8.44 ± 2.62 | 8.81 ± 3.32 | 8.66 ± 2.46 | ns |
| C20:2n-6 | 2.15 ± 0.88a | 2.80 ± 0.76b | 4.69 ± 1.49c | *** |
| C22:0 | 3.40 ± 1.22a | 6.47 ± 1.98b | 10.35 ± 3.20c | *** |
| C20:3n-6 | 24.43 ± 11.19a | 40.01 ± 16.25b | 39.12 ± 16.14b | *** |
| C22:1n-9 | 1.57 ± 0.69 | 1.38 ± 0.48 | 1.71 ± 0.69 | ns |
| C20:3n-3 | 2.12 ± 0.95 | 2.25 ± 0.67 | 2.66 ± 1.30 | ns |
| C20:4n-6 | 113.46 ± 36.77a | 195.81 ± 72.40b | 336.78 ± 86.36c | *** |
| C22:2n-6 | 3.77 ± 1.33a | 8.10 ± 3.47b | 6.77 ± 2.74b | *** |
| C24:0 | 1.83 ± 0.38a | 1.75 ± 0.89a | 2.79 ± 0.78b | *** |
| C20:5n-3 | 22.51 ± 6.49a | 47.59 ± 17.33b | 60.17 ± 21.22c | *** |
| C22:5n-3 | 49.09 ± 6.73a | 86.09 ± 30.21b | 84.96 ± 22.93b | *** |
| C22:6n-3 | 11.59 ± 3.89a | 20.40 ± 6.56b | 30.64 ± 8.91c | *** |
| SFA | 964.58 ± 94.52a | 1080.06 ± 199.39b | 1836.35 ± 315.51c | *** |
| MUFA | 537.96 ± 75.60a | 987.22 ± 198.41b | 2297.97 ± 424.84c | *** |
| PUFA | 747.45 ± 86.45a | 1270.51 ± 292.27b | 1805.93 ± 299.87c | *** |
| n-3 | 145.14 ± 21.51a | 256.70 ± 77.53b | 294.64 ± 75.20c | *** |
| n-6 | 592.63 ± 80.43a | 1005.00 ± 238.31b | 1502.63 ± 264.37c | *** |
| TOTAL FFA | 2249.99 ± 180.13a | 3337.79 ± 541.52b | 5940.25 ± 689.57c | *** |
a–cMean values in the same row (corresponding to the same parameter) not followed by a common number differ significantly at α = 0.05 level (Duncan test). Sig.: significance: ***α = 0.001 level, ns (not significant).
Changes on free amino acids
The evolution of free amino acids content during the curing process of deer loin is shown in Table 3. It is well known that the content of free amino acids (FAA) demonstrates the degree of proteolysis reached during the maturation of cured meat products. In the present research, the content of FAA increased significantly during processing and reached values of 1254 mg per 100 g of DM in the final product, compared with the fresh piece (914 mg per 100 g of DM). This increase as progress dry-cured process agree with those reported by other authors in cured loins (Zhou et al., 2017; Abellán et al., 2018; Salazar et al., 2019). In the initial point of our product, the majority of FAA were arginine, histidine, threonine and alanine, which agree with the results obtained in pork dry-cured loin (Salazar et al., 2019). In the final product, the main FAA were leucine, followed by alanine and phenylalanine. This profile was also found in the final cured loins by Armenteros et al. (2009). In other studies, authors found a positive correlation between processing time and FAA content, and that all amino acids increased significantly during processing (Salazar et al., 2019). However, in our case, a different trends were observed in the individual amino acids. The contents of aspartic acid, histidine, taurine, arginine, and threonine content decreased as increase the processing, alanine and proline did not show differences, while the other amino acids increased as increase the dry-cured process. As occurs in the lipolytic phenomenon, proteolysis are regulated by muscle enzymatic system. The proteolytic enzyme system in the muscle is complex, and is comprised of endo and exopeptidases. In the first stages, endopeptidases as cathepsins and calpains are involved in the initial breakdown of sarcoplasmic and myofibrillar proteins (Zhou et al., 2017). These enzymes induce proteolytic activity by producing large polypeptides, which are degraded to small peptides by the action of exopeptidases (dipeptidyl and tripeptidyl peptidases). Finally, the terminal amino acids at the end of peptide chain are released by the action of aminopeptidases (Abellán et al., 2018; Salazar et al., 2019). In addition, not all enzymes have the same enzymatic activity during processing. It is known that cathepsins B and L maintain stable activities throughout the process and they are reported as the main endopeptidases responsible for muscle proteolysis. In contrast, calpains only show activity in the first stages of the drying process, not showing activity after 2.5 months of ripening processing (Sárraga et al., 1993). In the present research, the short dry-curing process (2 months) causes the proteolytic processes to be due to a combination of the enzymatic activity of both types of enzymes.
Evolution of free amino acids content (mg per 100 g of dry matter) during the manufacturing process of dry-cured deer loin
| Processing day | Sig. | |||
|---|---|---|---|---|
| Day 0 | Day 30 | Day 60 | ||
| Aspartic acid | 2.61 ± 0.67b | 2.50 ± 0.89b | 1.87 ± 0.69a | ** |
| Serine | 27.33 ± 6.20a | 40.55 ± 6.35b | 48.19 ± 7.24c | *** |
| Glutamic acid | 26.83 ± 6.73a | 39.34 ± 3.91b | 44.68 ± 5.51c | *** |
| Glycine | 17.68 ± 5.37a | 25.40 ± 5.21b | 30.81 ± 7.04c | *** |
| Histidine | 138.05 ± 44.05c | 86.63 ± 25.89b | 51.14 ± 20.79a | *** |
| Taurine | 67.41 ± 8.84c | 46.89 ± 10.53b | 31.78 ± 9.17a | *** |
| Arginine | 166.26 ± 33.37c | 142.41 ± 30.76b | 95.19 ± 12.31a | *** |
| Threonine | 142.65 ± 26.29b | 140.92 ± 21.97b | 94.35 ± 18.73a | *** |
| Alanine | 118.94 ± 24.79 | 122.27 ± 13.54 | 120.83 ± 22.22 | ns |
| Proline | 29.78 ± 8.79 | 28.37 ± 7.40 | 28.30 ± 6.71 | ns |
| Cysteine | 19.85 ± 8.13a | 25.97 ± 14.79b | 31.98 ± 4.63c | *** |
| Tyrosine | 26.97 ± 7.09a | 58.35 ± 15.58b | 75.76 ± 17.11c | *** |
| Valine | 21.16 ± 4.34a | 52.34 ± 13.51b | 79.01 ± 18.60c | *** |
| Methionine | 15.90 ± 3.75a | 45.14 ± 12.40b | 53.39 ± 14.47c | *** |
| Lysine | 16.64 ± 5.48a | 44.03 ± 11.50b | 49.20 ± 9.08c | *** |
| Isoleucine | 18.56 ± 4.06a | 52.85 ± 14.10b | 78.87 ± 22.24c | *** |
| Leucine | 35.61 ± 9.06a | 111.08 ± 30.80b | 183.59 ± 47.30c | *** |
| Phenylalanine | 21.89 ± 6.02a | 65.85 ± 16.69b | 110.53 ± 27.91c | *** |
| TOTAL FAA | 914.13 ± 126.28a | 1160.97 ± 118.54b | 1253.66 ± 142.95c | *** |
a–cMean values in the same row (corresponding to the same parameter) not followed by a common number differ significantly at α = 0.05 level (Duncan test). Sig.: significance: **α = 0.01 level, ***α = 0.001 level, ns (not significant).
The free amino acids released from proteolytic activities are of great importance not only for their attribution to specific taste but also for their involvement in degradation reactions that generate volatile compounds which contribute to the flavour of the final product (Armenteros et al., 2009). Therefore, the increase in total FAA content in the final product could contribute to the sensory quality of dry-cured deer loin.
Conclusions
The results obtained in the present study allow to give value to the deer meat, introducing a new meat product in the market. The colour, texture and lipid oxidation were significantly affected by ripening process. In contrast, the values of fat, protein and ashes were constant during all process. All textural traits increased and colour parameters decreased during manufacturing process. This fact is related to the loss of moisture during the process. The TBARs value and lipolysis and proteolysis phenomenon increased progressively as dry-curing stage progresses. However, further studies should be performed evaluating the sensory characteristics and acceptability of dry-cured deer loin.
Acknowledgements
The authors are grateful to the Ministerio de Economía y Competitividad (Retos-Colaboración program) (Project INCYDEN, grant number RTC-2016-5327-2) for financial support for the study. Special thanks to Cárnicas Dibe S.L. for the samples supplied for this research.
Conflict of interest
The authors declare that there are no conflicts of interest.
