


Abstract
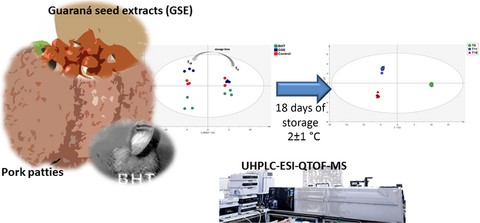
The changes of metabolites in pork patties with different antioxidants added (control without antioxidants, 200 mg kg−1 butylated hydroxytoluene (BHT) and 250 mg kg−1 guarana seed extracts (GSEs)) under modified atmosphere (80% O2 and 20% CO2) for 18 days of refrigerated storage were evaluated. Untargeted metabolomic approach based on UHPLC-ESI-QTOF-MS analysis was applied. GSE phytochemical profile revealed a wide variety of compounds (caffeine, glycerol 1-propanoate, amino acids, alkaloids and glycerophospholipids), together with antioxidants (tyrosols, procyanidins and flavonoids). Important differences in BHT and GSE patties metabolomic profiles were found during storage. Most of the differences could be attributed to glycerophospholipids and fatty acyls, along with specific compounds derived from lipid oxidation (i.e. 2-hexenal, 4-hydroxy-2-hexenal and 2,4-heptadienal) and protein degradation (spermine). Therefore, the approach used highlighted a modulation of lipid oxidative processes, together with strict correlation between metabolic profiles and factors associated with meat quality, highlighting GSE effect on active compounds delaying oxidative phenomena.
Introduction
Oxidation can be considered as one of the major causes of quality deterioration in meat products, determining several undesired phenomena, such as discoloration, off-flavours and neo-synthesis of toxic compounds together with a reduction of the shelf life (Falowo et al., 2014; Lorenzo et al., 2014). Unsaturated lipids are chemically unstable and easily prone to oxidation, especially during post-mortem handling and storage (Falowo et al., 2014). In particular, oxidation of unsaturated lipids is a three-step radical chain reaction, which consists of initiation, propagation and termination with the production of free radicals. Initiation reaction produces the fatty acid (alkyl) radical (R•) which in turn reacts with oxygen to form peroxyl radicals (ROO•) in the propagation reaction. The peroxyl radicals react with unsaturated fatty acids and form hydroperoxides (ROOH), which later decompose to produce the volatile aromatic compounds that give meat its perceived off-flavours and rancid odour (Fernandes et al., 2017). The interaction of alkyl and peroxyl radicals leads to the formation of non-radical products such as aldehydes, alkanes and conjugated dienes (Wsowicz et al., 2004). Regarding protein oxidation, the reaction can occur when the ROO• (formed during lipid oxidation) absorbs hydrogen atoms from protein molecules through reactions chains (Falowo et al., 2014).
Therefore, considering the strict link between proteins and lipids during meat oxidation, in the last years, several research efforts have been focused on the preservation of the deterioration phenomena by applying proteomic-based studies together with the analysis of oxidative indicators for lipids (TBARS) and proteins (carbonyl groups). Moreover, several studies tried to preserve the oxidative events in meat products by using natural antioxidants from plants sources (i.e. herbs, spices, vegetables and fruits), by exploiting their wide phytochemical composition (Lorenzo et al., 2018). In this regard, technological strategies are based on the application of antioxidants directly into the meat or by coating packaging materials with plant extracts to improve the oxidative stability of the final products (Domínguez et al., 2018). Synthetic antioxidants, such as butylated hydroxyanisole (BHA), butylated hydroxytoluene (BHT) and tertiary butyl hydroquinone (TBHQ), have been widely used in inhibiting meat oxidation (Lorenzo et al., 2013) but with side effects, thus justifying the need to exploit natural antioxidants. For example, several authors have reported the efficacy of different natural antioxidants to reduce the progression of lipid and protein oxidation, discoloration and microbial growth in some types of meat (Fernandes et al., 2016; Pateiro et al., 2018; Zamuz et al., 2018).
In the last years, proteomic and metabolomic approaches have been used for the assessment of meat quality and conservation (Capozzi et al., 2017). In fact, the high-throughput nature of these omic sciences has been exploited in many different applications, ranging from the genetic fingerprinting of specific breeds and traits to the study of the transformations occurring during/after meat processing. In a previous work, we fully characterised the phenolic profile of guarana seed extracts (GSEs) to be added pork patties during storage, showing that these extracts are particularly effective against colour deterioration and preserving lipids and proteins (Pateiro et al., 2018).
Therefore, in this work, we used a comprehensive untargeted metabolomic approach based on UHPLC-ESI-QTOF-MS to elucidate the changes of meat metabolite profiles following addition of either BHT or GSE, during storage at 2 ± 1 °C. In fact, to the best of our knowledge, scarce information is available on the application of untargeted metabolomics to study meat oxidation during storage. Therefore, the use of untargeted metabolomics is expected to provide a wider number of markers related to oxidation of meat, when compared to targeted or classical approaches.
Materials and methods
Chemicals and reagents
Guarana extract was obtained from Florien, Piracicaba (São Paulo, Brazil). BHT (2,6-di-tert-butyl-4-methylphenol; extra pure, 99%) was supplied by Scharlau (Barcelona, Spain). The methanol (LC-MS grade) and water (proteomic grade) used as mobile phases, and formic acid (98-100%, LiChropur® for LC-MS) were provided by VWR (Milan, Italy). Cellulose syringe filters (0.22 mm Ø) were obtained from FILTER-LAB (Barcelona, Spain).
Preparation of pork patties
Pork patties were prepared by rigorously following the protocol as detailed by Pateiro et al. (2018). Briefly, the meat products were developed in the ‘Meat Products Pilot-Plant’ at the Centro Tecnolóxico da Carne located in Ourense, Spain. Three treatments were prepared: without natural antioxidant (control), with BHT at 200 mg kg−1 (BHT) and with 250 mg kg−1 of guarana extract (GSE), respectively. The meat was mixed and compressed manually with 10 g of NaCl per kg of meat and 200 mg kg−1 of BHT or 250 mg kg−1 of guarana extract (Pateiro et al., 2018). Patties were packed under modified atmosphere (80% O2 and 20% CO2) and stored at 2 ± 1 °C under light to simulate supermarket conditions, being placed over metal shelving and receiving lux values in the range of 15–20 depending on the tray position (HT 306, Digital luxometer, Italy). Finally, pork patties samples were analysed considering two time-points of storage, being 11 and 18 days, respectively.
UHPLC-ESI-QTOF-MS untargeted profiling of GSE and pork patties during storage
The untargeted profile of the GSE, fully characterised from a polyphenolic point of view in our previous published paper (Pateiro et al., 2018), was further investigated by using untargeted metabolomics. In this regard, the extraction and analysis of metabolites in GSE were carried out following the protocol previously reported (Pateiro et al., 2018). Then, the compound annotation was recursively achieved against the comprehensive database FoodDB (http://foodb.ca/).
Regarding pork patties, one gram of each sample was extracted in 10 mL of a methanol:water solution (80:20, v/v) (both LC-MS grade, VWR, Milan, Italy) acidified with 0.1% formic acid by using a homogeniser-assisted extraction (Ultra-turrax, Ika T25, Staufen, Germany). The extracts were then centrifuged at 6000 × g for 15 mins at 4 °C, and then the resulting solutions were filtered using 0.22-μm cellulose syringe filters and further collected in amber vials.
The comprehensive screening of meat metabolites was performed by using an untargeted metabolomic approach, based on ultra-high-pressure liquid chromatography (1290 series, Agilent technologies, Santa Clara, CA, USA) and quadrupole time-of-flight mass spectrometry (G6550 iFunnel, Agilent technologies) equipped with a JetStream electrospray ionisation source (UHPLC-ESI/QTOF) (Rocchetti et al., 2018, 2019a). Briefly, chromatographic separation was achieved in reverse phase mode using a C18 column (100 × 2 mm i.d., 1.8 μm), with a gradient of methanol in water (from 6% to 94% in 33 mins) as mobile phase. Elution was operated with a flow rate of 0.22 mL min−1, injection volume was 6 μL, and the mass spectrometer was operated in positive SCAN mode (50–1200 m/z, ‘extended dynamic range’ mode) as previously reported (Pretali et al., 2016).
Raw metabolomic-based data were processed in Profinder B.07 (Agilent Technologies), based on the ‘find-by-formula’ algorithm, combining the use of monoisotopic accurate mass and isotopic pattern (isotope spacing and ratio). Finally, annotation of meat metabolites was achieved against 2 databases namely FoodDB (http://foodb.ca/) and LIPID MAPS (http://www.lipidmaps.org/) and following mass (5 ppm) and retention time (<0.1 min) alignment. In particular, features that were not present in 100% replications (n = 3) were discarded.
Statistical analysis
Metabolomic data were formerly interpreted using Mass Profiler Professional B.12.06 (from Agilent Technologies) as previously defined (Rocchetti et al., 2019b). Unsupervised hierarchical cluster analysis (HCA) was used on this processed data set by considering the different dosages at three time-points: t0 (before storage), t11 (11 days of storage) and t18 (18 days of storage), in order to group samples according to intrinsic similarities in their determinations.
Subsequently, the raw data set was exported into SIMCA 13 (Umetrics, Malmo, Sweden), UV-scaled and elaborated for orthogonal projections to latent structures discriminant analysis (OPLS-DA) supervised modelling, as previously reported (Rocchetti et al., 2019b). Model validation parameters (goodness-of-fit R2Y together with goodness-of-prediction Q2Y), cross validation parameters and permutation testing were also inspected.
The variables’ importance in projection (VIP) was then used to rank the importance of pork patties metabolites in prediction and to select those having the highest discrimination potential. Finally, a following fold change (FC) analysis (cut-off value = 2) was performed considering the VIP markers of samples (i.e. BHT and GSE vs. control) after 11 and 18 days of storage to gain a better understanding into the changes in oxidation processes over the time-points considered.
Results and discussion
Characterisation of guarana seed extract (GSE)
The untargeted UHPLC-QTOF mass spectrometric analysis of GSE allowed to putatively annotate 351 compounds in GSE being detected in all replications and passing Hotelling's T2 check for outliers. A detailed list of all GSE compounds identified, with individual abundances and composite mass spectra, is provided in supplementary material (Table S1).
The chemical composition of GSE has been previously characterised by using different analytical platforms, such as NMR spectroscopy and mass spectrometry (both liquid and gas chromatography coupled to different mass analysers). Overall, in our experimental conditions, the compounds annotated were in agreement with the chemical composition recently reported in literature for guarana seeds (Paulinia cupana) (Medeiros Marques et al., 2019). In fact, the most frequent compounds were diacylglycerols, glycerophospholipids (i.e. monoglycerophospholipids, phosphatidylcholines, phosphatidylethanolamines), polyphenols (mainly flavonoids and phenolic acids) and alkaloids (including methylxanthine derivatives such as caffeine, theobromine and theophylline). In this regard, caffeine (1,3,7-trimethylxanthine) is found in large quantities in guarana seeds (Machado et al., 2018), with mean levels of 2% in the integral seed. However, many studies reported that the origin of the raw material, as well as genetic and environmental factors, could impact on the final content of methylxanthines (Medeiros Marques et al., 2019). In our experimental conditions, the most abundant compounds were caffeine, glycerol 1-propanoate, amino acids, alkaloids, glycerophospholipids and other organic compounds (Table S1). Additionally, in our previously published paper (Pateiro et al., 2018), the untargeted screening of polyphenols revealed a great abundance of tyrosol equivalents (mainly low molecular weight phenolics, such as 6,7-furanocoumarin, tyrosol and 4-ethylcatechol). Besides, guarana seeds are widely studied for their tannin composition (Machado et al., 2018), consisting mainly of condensed tannins arising from proanthocyanidins (10.7%), catechin (6%) and epicatechin (4%). Accordingly, in this work, the most abundant compounds found in the formulated GSE were prodelphinidin trimers, followed by epicatechins and epigallocatechins (Table S1). Interestingly, it was reported that catechin, epicatechin, A/B-type procyanidin dimers and procyanidin trimers are also the main compounds responsible for the geographical variation of different guarana samples (Da Silva et al., 2017). Therefore, the results gained from our GSEs using untargeted metabolomics provided a wider compounds coverage than targeted approaches (Da Silva et al., 2017; Machado et al., 2018), highlighting the rich distribution of antioxidant compounds in this plant matrix.
Untargeted screening of meat metabolites during storage
In the last years, untargeted metabolomics has emerged as a valuable tool to assess quality, processing and safety of both raw materials and final products (Cevallos-Cevallos et al., 2009). In particular, this method is able to provide an impartial and holistic approach and then, by using statistical evaluations of the peak abundances (usually called ‘features’ after the detection by an algorithm), it makes possible to highlight significant changes between two or more groups.
In this work, the untargeted UHPLC-QTOF mass spectrometric approach allowed to detect 290 metabolites in meat; in this regard, 134 compounds were putatively annotated by using the combination of FoodDB (i.e. the most comprehensive database on food constituents) and LIPID MAPS (https://www.lipidmaps.org/). A detailed list containing all the meat metabolites annotated, together with their composite mass spectra, is reported as supplementary material (Table S1). The most represented category of compounds belonged to lipids, such as fatty acyls (linoleic acids and derivatives) and glycerophospholipids (i.e. glycerophosphocholines and glycerophosphoethanolamines). The lipid composition of pork usually includes the major fatty acid species such as saturated, monosaturated and polyunsaturated fatty acids. However, there are many additional phospholipids that contribute to the taste and aroma of meat. These phospholipids are mainly divided into glycerophospholipids and sphingolipids, and comprise phosphatidylinositol (PI), phosphatidylethanolamine (PE), phosphatidylserine (PS), phosphatidylcholine (PC) and sphingomyelin (SM) classes (Meynier et al., 1998). Consistently, the compounds annotated by untargeted metabolomics are quite representative of the typical phospholipid's distribution in meat. Interestingly, in our experimental conditions, four of the main aldehydic compounds arising from lipid oxidation could be detected, namely 4-hydroxy-2-hexenal (4-HHE), 2-heptenal, 2-hexenal and 2,4-heptadienal (Table S1).
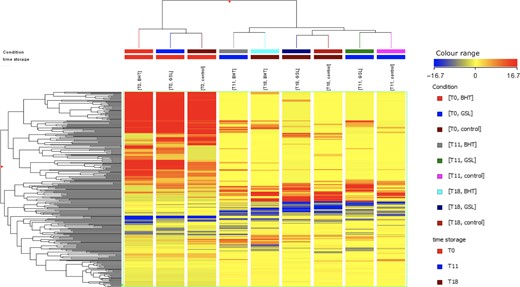
The unsupervised hierarchical cluster analysis (HCA), produced from the fold change based heat map of metabolites abundance, is reported as supplementary material (Figure 1). As it can be observed, the figure resulted in two main groups: the first cluster included all samples at time-point t0, whilst the second cluster consisted of all treated samples after 11 and 18 days of storage. The heat map clearly showed the modification of meat metabolites profile during storage, highlighting a marked effect mainly on two up-accumulated clusters of compounds at t0 (Figure 2). Multivariate analysis of metabolomic-based data is usually performed by applying both unsupervised (i.e. cluster analysis) and supervised (i.e. PLS-DA or OPLS-DA) tools (Worley & Powers, 2013). However, OPLS-DA is able to effectively eliminate the variation not directly correlated with Y in X matrix (i.e. orthogonal signal correction), considering only the Y-predictive variation. Therefore, an OPLS-DA score plot was built considering the storage time as class membership criterion in order to confirm the results provided by HCA. The output of this OPLS-DA model is provided in supplementary material (Figure S1). The class prediction model clearly discriminated the different treated samples over the storage time-points, thus corroborating previous unsupervised findings. Besides, the OPLS-DA model cross-validation parameters were excellent, being R2Y = 0.99 and Q2Y = 0.89, with adequate permutation test cross-validation (Figure S2). The absence of overfitting together with high prediction ability confirms the potential and robustness of the OPLS-DA model based on meat metabolites for investigating the main differences between meat samples during storage.
Distribution of each metabolite detected by UHPLC-QTOF mass spectrometry.
Lipid oxidation plays a major role in the meat quality, by producing volatile compounds that contribute to the typical meat flavour and to other off-flavours. In this regard, it is well established that phospholipids oxidise faster than triglycerides as a result of the extent of unsaturation. Furthermore, the effects of oxidation processes on pork flavour are strictly related to the different intramuscular lipids content and composition, as highlighted by Huang et al. (2010). Therefore, further investigation was made to shed light onto the modulation of oxidative processes imposed by GSE addition to the samples.
Multivariate statistical discrimination of pork patties during storage
Considering that the main differences were actually represented into the metabolomic data set, an additional OPLS-DA model was built to evaluate more selectively the changes of meat metabolites profile during the 18 days of storage. In this regard, the OPLS-DA score plot built comparing the different meat samples at t0 and t18. The output of this model is reported as Figure 2. As it can be observed from the figure, the OPLS-DA score plot revealed distinctive changes when considering each sample at t18 of storage. In fact, the first latent vector t1 was particularly effective in providing a good separation between the different meat samples, thus pointing out the effect of storage time. In this regard, GSE and BHT meat samples were characterised by completely different metabolomic profiles when compared with control sample.
![OPLS-DA considering BHT, GSE and control pork samples during 18 days of storage. [Colour figure can be viewed at wileyonlinelibrary.com]](https://oup.silverchair-cdn.com/oup/backfile/Content_public/Journal/ijfst/55/3/10.1111_ijfs.14329/1/m_ijfs14329-fig-0002-m.jpeg?Expires=1750301965&Signature=1uejft6lyc9bvvTk7zsUEEPQFM9GqsYCZZZ17Nq1OND3kq2yNny9ysOiDm~1ilh1IZOz6PewSd1-lkPF7rPm8n35aFiEtqF0qGOMDTP0S0OwSN6zzmnN~4GLJhNDvPipBjLo-DQcEuJJWvzW3wfsWkE-qPR4L~PgPaOF85mafVEk4FF3EEk5Z9WQ0p2uIAYGnEsoOD8BsDt~Yfs5hYY-g10l8tzkqzF1eDOR2no6o98GUjSRkY0ID1oP0CZAx4P5NFWMStwubYPjCfcn3E5f7g65X-3ymn0A-qKvcBo3hQwWf7aggrRwWMEiXGS2ILede9G9HD4PQ2~rwWmq5gJI5g__&Key-Pair-Id=APKAIE5G5CRDK6RD3PGA)
OPLS-DA considering BHT, GSE and control pork samples during 18 days of storage. [Colour figure can be viewed at wileyonlinelibrary.com]
Therefore, to explore these differences, a following variables’ selection method based on VIP (variable importance in projection) markers was exploited. This approach is able to provide the so-called VIP scores (i.e. the contribution a variable makes to the OPLS-DA model), highlighting those compounds better responsible for the hyperspace separation. The VIP score is calculated as a weighted sum of the squared correlations between the OPLS-DA components and the original variables (Rocchetti et al., 2018). Table 1 reports the most discriminant compounds highlighted by VIP selection method and organised in classes, together with their prediction score and LogFC values, when considering GSE vs. control pork samples. Overall, the VIP markers consist of glycerophospholipids (15 compounds), fatty acyls (5 compounds), and other organic compounds (e.g. aldehydes, carboxylic acids and amino acids). Interestingly, among VIP markers, the 56% of lipid compounds were found to be down-accumulated when considering the pairwise comparison GSE vs. control pork samples (Table 1). The glycerophospholipids showing the higher up-accumulation values were PC(16:1(9Z)/20:1(11Z)), followed by PC(20:3(5Z,8Z,11Z)/P-18:0), PC(22:4(7Z,10Z,13Z,16Z)/P-18:0) and PE(20:4(5Z,8Z,11Z,14Z)/22:1(13Z)) (Table 1). Additionally, four glycerophosphocholines such as PC(16:1(9Z)/18:2(9Z,12Z)), PC(P-18:0/16:0), LysoPC(18:1(9Z)) and PC(18:0/18:1(11Z)), followed by two fatty acyls, namely cetyl alcohol and 1-Tetradecanol, showed strong down-accumulation values, recording LogFC values of -7.32, -6.85, -12.01, -7.73, -18.23 and -8.71, respectively. Interestingly, among the VIP markers, we found a down-accumulation of spermine, an organonitrogen compound deriving from spermidine (through the addition of a C3N unit under the catalysis of spermine synthase) (Funayama & Cordell, 2015). Although many organisms contain spermidine, the distribution of spermine is more limited (Pegg & Michael, 2011). However, only in tissues from animals, the content of spermine is equal or higher than its precursor spermidine (Pegg & Michael, 2011).
VIP selection considering the comparison GSE vs. control during 18 days of storage
| Classification | Compound | OPLS-DA VIP score | LogFC [GSE vs. control]t18 | Accumulation |
|---|---|---|---|---|
| Aldehydic compounds | 2-hexenal | 1.16 ± 0.73 | −0.27 | Down |
| 4-hydroxy-2-hexenal (4-HHE) | 0.89 ± 1.85 | −0.81 | Down | |
| 2,4-heptadienal | 0.88 ± 0.19 | −0.22 | Down | |
| Amino acids/peptides | L-Phenylalanine | 1.03 ± 0.25 | −0.53 | Down |
| L-Leucyl-L-proline | 0.95 ± 0.16 | −0.45 | Down | |
| Carboxylic acids and derivatives | L-2-Amino-3-methylenehexanoic acid | 1.04 ± 0.36 | −0.41 | Down |
| Creatine | 0.95 ± 0.17 | −0.45 | Down | |
| DL-2-Aminooctanoic acid | 0.94 ± 0.49 | −0.43 | Down | |
| Fatty acyls | Isobutyryl-L-carnitine | 1.14 ± 0.25 | 1.05 | Up |
| Stearoyllactic acid | 1.04 ± 0.45 | 5.40 | Up | |
| 3-Dehydroxycarnitine | 1.02 ± 0.83 | −0.43 | Down | |
| 1-Tetradecanol | 1.43 ± 0.39 | −8.71 | Down | |
| Cetyl alcohol | 1.16 ± 0.35 | −18.23 | Down | |
| Glycerophospholipids | PC(16:1(9Z)/20:1(11Z)) | 1.02 ± 0.74 | 14.24 | Up |
| PE(20:4(5Z,8Z,11Z,14Z)/22:1(13Z)) | 0.99 ± 0.73 | 6.06 | Up | |
| PC(18:2(9Z,12Z)/18:1(9Z)) | 0.98 ± 0.13 | 0.58 | Up | |
| PC(16:1(9Z)/18:1(9Z)) | 0.92 ± 0.25 | 0.17 | Up | |
| PC(20:3(5Z,8Z,11Z)/P-18:0) | 0.89 ± 0.24 | 8.04 | Up | |
| PC(20:3(8Z,11Z,14Z)/18:3(9Z,12Z,15Z)) | 0.98 ± 0.33 | 5.21 | Up | |
| PC(22:4(7Z,10Z,13Z,16Z)/P-18:0) | 0.89 ± 0.43 | 7.70 | Up | |
| PS(18:0/18:0) | 0.80 ± 0.70 | 5.73 | Up | |
| PC(16:1(9Z)/18:2(9Z,12Z)) | 1.22 ± 0.45 | −7.32 | Down | |
| LysoPC(18:0) | 1.02 ± 0.93 | −0.81 | Down | |
| PC(P-18:0/16:0) | 0.93 ± 0.91 | −6.85 | Down | |
| LysoPC(18:1(9Z)) | 0.93 ± 0.41 | −12.01 | Down | |
| PC(20:4(8Z,11Z,14Z,17Z)/18:0) | 0.87 ± 0.33 | −0.04 | Down | |
| PC(20:2(11Z,14Z)/18:3(9Z,12Z,15Z)) | 0.83 ± 0.45 | −0.06 | Down | |
| PC(18:0/18:1(11Z)) | 0.83 ± 0.59 | −7.73 | Down | |
| Other lipids | N-(2R-Hydroxyhexadecanoyl)-2S-amino-9-methyl-4E,8E-octadecadiene-1,3R-diol | 0.88 ± 0.91 | −0.38 | Down |
| Aralia cerebroside | 0.94 ± 0.32 | −0.14 | Down | |
| 3-Hydroxy-1,10-bisaboladien-9-one | 0.96 ± 0.58 | −0.41 | Down | |
| Rotundone | 0.94 ± 0.22 | 5.48 | Up | |
| 3-O-Sulfogalactosylceramide (d18:1/18:0) | 1.13 ± 0.66 | −0.70 | Down | |
| Other organic compounds | 5-Acetyl-2,4-dimethyloxazole | 0.99 ± 0.34 | −0.39 | Down |
| 2-Acetylpyrazine | 0.96 ± 0.08 | −0.47 | Down | |
| 3-(1H-Indol-3-yl)-2-propenoic acid | 1.11 ± 0.58 | −0.31 | Down | |
| Hypoxanthine | 0.90 ± 0.28 | −0.45 | Down | |
| Nicain | 0.96 ± 0.06 | −0.38 | Down | |
| 6-Methylquinoline | 0.96 ± 0.17 | −0.55 | Down | |
| 10-Methylacridone | 0.93 ± 0.39 | −0.81 | Down | |
| Beta-guanidinopropionic acid | 1.18 ± 1.26 | −0.36 | Down | |
| Spermine | 0.92 ± 0.24 | −0.32 | Down | |
| 4-Vinlyphenol | 0.96 ± 0.09 | −0.56 | Down | |
| 1-(2,3-Dihydro-6,7-dimethyl-1H-pyrrolizin-5-yl)-2-hydroxy-1-propanone | 0.94 ± 0.20 | −0.64 | Down | |
| 1-Methyl-2-nonyl-4(1H)-quinolinone | 0.87 ± 0.78 | −0.48 | Down | |
| alpha-Amylcinnamyl acetate | 1.16 ± 1.20 | 6.43 | Up | |
| N6-Prenyladenine | 1.12 ± 0.29 | 0.05 | Up | |
| Caneine | 1.41 ± 0.30 | 23.87 | Up | |
| 2-Undecyl-4(1H)-quinolinone | 1.27 ± 0.89 | 6.26 | Up |
Another interesting result was obtained when considering the fold change distribution of aldehydic compounds such as 2-hexenal, 4-hydroxy-2-hexenal and 2,4-heptadienal (Table 1). These latter compounds were characterised by an overall down-accumulation when considering the pairwise comparison GSE vs. control pork samples, thus outlining a possible protective effect of the GSE on lipid oxidation processes. The production of aldehydic compounds from oxidative processes in meat is generally assessed by examining the formation of compounds such as TBARS, including malondialdehyde (MDA). However, this method lacks specificity because it measures the total content of aldehydes able to react with thiobarbituric acid, expresses in MDA content, instead of measuring each compound individually. In our previous work (Pateiro et al., 2018), we determined the TBARS content after the entire storage period. In particular, TBARs values in control sample were found to increase with storage time, whilst in GSE and BHT batches decreased between 11 and 18 days of storage. Therefore, our metabolomic-based results seem to corroborate the previously published results, outlining an overall reduction of the annotated aldehydic compounds in GSE-treated samples.
Finally, in order to compare the efficacy of BHT and GSE in terms of preserving lipid oxidation, a fold change analysis on the VIP markers comparing BHT vs. GSE at 18 days of storage time was carried out. The results of this additional analysis are reported as supplementary material (Table S1). As can be observed from the supplementary table, 18 compounds were able to explain the differences observed between BHT and GSE-treated pork samples. In particular, 3-O-Sulfogalactosylceramide (d18:1/18:0) was exclusively preserved by the GSE treatment compared to BHT, showing a LogFC value of -19.20. Other down-accumulated compounds belonged to glycerophospholipids category, being LysoPC(18:0), PC(16:1(9Z)/20:1(11Z)), PE(18:1(11Z)/20:3(8Z,11Z,14Z)) and PC(16:1(9Z)/18:2(9Z,12Z)), as highlighted in supplementary material (Table S1). Therefore, taking together, these results indicate that the antioxidant profile of GSE was able to preserve the pork patties against oxidative processes on both lipids and proteins.
Overall, our findings showed the suitability of untargeted metabolomics to assess meat quality. However, another very important issue related to meat is the comprehensive evaluation of its safety, above all when considering the control of pathogenic micro-organisms, food additives and chemical residues, the safety and quality of organic and natural products used and the need for developing improved laboratory methodologies (Pinu, 2016). Therefore, according to literature (Pinu, 2016), metabolomics has the great potential for a wider identification of biomarkers related to food spoilage by pathogenic micro-organisms, which may lead to the development of early detection techniques to control their growth and to guarantee meat safety/quality.
Conclusions
Guarana seed extracts can induce important changes in minor components of pork patties during storage, due to its rich content and composition including, among others, alkaloids and phenolic compounds. The marked changes observed at metabolomic level in all samples also indicate the impact of antioxidants on the composition of pork patties during the 18 days of storage. Regarding the main changes during storage, important differences in metabolomic profiles were recorded. Glycerophospholipids, fatty acyls and some compounds derived from lipid oxidation, such as 2-hexenal, 4-hydroxy-2-hexenal and 2,4-heptadienal, could be outlined by multivariate statistics. Overall, this preliminary study also extends the information about the use of untargeted metabolomics in the shelf life of meat products. In particular, this scenario allowed to understand, at a deeper and more precise molecular level, the impact of antioxidants from GSE on pork patties to mitigate the detrimental effects of lipid oxidation and thus to potentially modulate the changes in meat quality. Additionally, this metabolomic-based approach could be exploited to comprehensively assess meat safety.
Acknowledgments
The authors gratefully thank the ‘Romeo ed Enrica Invernizzi’ foundation for kindly supporting the metabolomic platform. Jose M. Lorenzo is member of the Healthy Meat network, funded by CYTED (Ref. 119RT0568). Paulo E. S. Munekata acknowledges postdoctoral fellowship support from Ministry of Economy and Competitiveness (MINECO, Spain) ‘Juan de la Cierva’ programme (FJCI-2016-29486). Thanks to GAIN (Axencia Galega de Innovación) for supporting this research (grant number IN607A2019/01).
