


Abstract
The objective of this study was to investigate the feasibility of enhancing the functional properties of spirulina protein (SPP) through polyphosphate covalent modification. The results indicated that the introduction of polyphosphates did not result in the degradation of the primary subunits of SPP, but rather increased its surface electronegativity and reduced particle size. Additionally, an increase in surface hydrophobic groups and free sulphhydryl groups was observed in polyphosphate-treated SPP, which can be attributed to changes in the secondary structure and tertiary conformation of SPP. Functional property analysis revealed that polyphosphate treatment could enhance the solubility, oil holding capacity, emulsifying capacity, and foaming ability of SPP. Moreover, the types and concentrations of polyphosphates significantly influenced these functional properties. Specifically, treatment with 8% sodium tripolyphosphate (STP) improved the solubility, emulsifying capacity, and foaming ability of SPP by 39.4%, 28.9%, and 30.9%, respectively. These findings suggest that STP treatment is a promising approach for improving the functional properties of SPP.
Introduction
Spirulina, a blue-green microalgae widely distributed in freshwater or saline lakes of tropical and subtropical regions, is abundant in proteins (60%–70%, w/w), polyunsaturated fatty acids, antioxidants, and minerals. These components render it a valuable functional food ingredient with diverse physiological functions, including anti-ageing, antioxidant, and antibacterial activities (Wang et al., 2023; Zhang et al., 2023b). Spirulina protein (SPP) exhibits a comprehensive amino acid profile, with essential amino acids constituting approximately 38%–47% of the total protein content. Moreover, the levels of the eight essential amino acids exceed those recommended by the World Health Organisation (WHO) and the Food and Drug Administration (FDA) (83.5 mg/(kg·d)), further underscoring its importance as a beneficial supplement (Clément et al., 1967; Tavakoli et al., 2025). Additionally, SPP demonstrates surface-related properties such as emulsifying and foaming capacities, as well as hydrodynamic properties like gelling functionality (Ding et al., 2023). Importantly, previous studies have shown that SPP possesses high light absorption capacity (Wang et al., 2023). Therefore, it can be speculated that SPP may serve as a promising candidate for stabilising emulsions with excellent ultraviolet protection capability (Kusumastuti et al., 2024). For instance, Xu et al. (2025) found that SPP nanoparticles formed through the combination of heating gelation and ultrasound could function as effective carriers for curcumin encapsulation, thereby enhancing its stability. Liu et al. (2023) reported that Pickering emulsion fabricated using SPP particles exhibited excellent astaxanthin encapsulation efficiency. In another work, SPP was used to develop protein-rich xero-templates for the delivery of live Lacticaseibacillus rhamnosus GG cells, exhibiting comparable effects to whey protein isolate and pea protein isolate (Fortuin et al., 2024).
However, our previous research has revealed that the solubility of SPP obtained through the traditional alkali-soluble and acid precipitation method was relatively limited. Moreover, emulsion delivery systems constructed using SPP was prone to creaming during storage and exhibited suboptimal protection ability for loaded functional substances. The delivery performance of protein-based emulsion carriers is significantly influenced by their structural and physicochemical properties. Consequently, various techniques such as ultrasound treatment, enzymatic hydrolysis, heating, high pressure processing, or pH adjustment have been increasingly explored to modify the conformational characteristics of proteins and enhance their functional properties (Zhao et al., 2021; Zou et al., 2022).
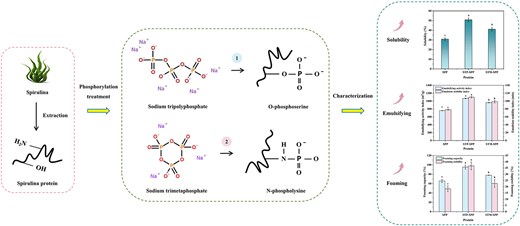
In recent years, phosphorylation treatment has been scientifically proven to be an effective approach for enhancing protein functionality and has garnered significant attention (Hu et al., 2021, 2024a; Liu et al., 2021). During this process, exogenous phosphate groups selectively attach to the –NH2 group of histidine imidazole ring and the hydroxyl groups of serine, tyrosine, and threonine residues within proteins. This binding elevates protein electronegativity and intermolecular electrostatic repulsion, thereby facilitating their dispersion in aqueous solutions and ultimately improving solubility, emulsification capacity, and foaming ability (Hu et al., 2023; Kang et al., 2024). Sodium tripolyphosphate (STP) and sodium trimetaphosphate (STM) have been demonstrated as feasible and cost-effective reagents for phosphorylation due to their safety profile and low toxicity (Hu et al., 2024b; Wang et al., 2019b; Zhao et al., 2024). Jia et al. (2023) investigated the effects of STP and sodium pyrophosphate on myofibrillar protein, revealing that the incorporation of phosphates promotes the exposure of hydrophobic groups and increases surface electronegativity, thereby improving gel strength, solubility, and water holding capacity. Dong et al. (2024) highlighted that phosphorylation modification can increase thermal stability and improve the pasteurisation sterilisation efficacy of liquid egg white. However, current literature lacks comprehensive information on the functional properties of polyphosphate-modified SPP. Furthermore, it is imperative to thoroughly investigate the modification efficiency of various polyphosphates as well as the phosphorylation mechanism of SPP.
Therefore, the objective of this study was to enhance the functional properties of SPP. STP and STM were individually used to explore the impact of polyphosphate types and concentrations (2%, 4%, 6%, 8%, and 10%) on the physicochemical and functional properties of SPP. The structural changes in phosphorylated SPP were characterised using sodium dodecyl sulfate–polyacrylamide gel electrophoresis (SDS-PAGE), fluorescence spectroscopy, and circular dichroism (CD) spectroscopy to elucidate the underlying mechanisms for the observed enhancements in functional properties. This study will serve as a technical reference for improving the functional properties of SPP and promoting its application in emulsion delivery systems.
Materials and methods
Materials
Ultrafine spirulina powder was acquired from Jinheng Chemical Co., Ltd. (Xian, China). SDS-PAGE analysis kit was purchased from Biyuntian Biotechnology Co., Ltd. (Shanghai, China). STM, STP, 1-anilino-8-naphthalene sulfonate, and 5,5′-dithio-bis-(2-nitrobenzoic acidic) (DTNB) were obtained from Macklin Biochemical Co., Ltd. (Shanghai, China). The remaining reagents were of analytical purity.
Preparation of polyphosphate-treated SPP
The extraction of SPP from ultrafine spirulina powder was performed according to our previous reports (Zhao et al., 2021). The protein content, determined by the Kjeldahl nitrogen method, was found to be 82.54% (wet basis). Subsequently, the lyophilized SPP powder was dispersed in distilled water to from a 6% (m/v) dispersion, which was then thoroughly mixed using a magnetic stirrer and hydrated overnight at 4 °C. Subsequently, STM or STP at concentrations of 2%, 4%, 6%, 8%, and 10% (w/w, based on the mass of SPP) were added to the SPP dispersion. The pH of the mixture was adjusted to 9.0 using a 3 mol/L NaOH solution and stirred at 45 °C for 2 h, followed by dialysis (molecular weight cut-off: 8,000–14,000 kDa) in distilled water at 4 °C for 36 h, and then freeze-dried (Ai & Jiang, 2021; Hu et al., 2019; Zhao et al., 2023). Finally, the polyphosphate-treated SPP samples were collected and labelled as STM-SPP (sodium trimetaphosphate-treated SPP) and STP-SPP (sodium tripolyphosphate-treated SPP), respectively.
Analysis of the physicochemical properties of polyphosphate-treated SPP
Particle size and zeta potential
The particle size and zeta potential of polyphosphate-treated SPP were detected by a Nano-ZS90 nanoparticle sizer (Malvern, UK), following the procedure described in our previous reports (Zhao et al., 2022).
SDS-PAGE analysis
SDS-PAGE analysis of polyphosphate-treated SPP was performed using a vertical gel electrophoresis device, following the protocol specified in the kit instructions. Specifically, 5% concentrating gel and 10% separating gel were prepared, and 10 μL of samples dispersion (0.2 mg/mL) were added into the gels for electrophoresis. The voltage settings for the concentrating gel and separating gel were adjusted to 80 and 120 V, respectively. After electrophoresis, Coomassie brilliant Blue R-250 staining was performed on the gel, followed by observation after decolourization (Wang et al., 2021). A standard marker with a molecular weight range of 14–97 kDa was utilised as a reference.
Surface hydrophobicity
The methodology for determining surface hydrophobicity was conducted in accordance with the procedures described in our previous reports, using a F7000 fluorescence spectrophotometer (Hitachi, Japan) (Zhao et al., 2022). The initial slope of the relationship between fluorescence intensity and protein concentration (0.1–0.5 mg/mL) represents the surface hydrophobicity.
Free sulphhydryl content
The content of free sulphhydryl groups in polyphosphate-treated SPP was determined following the method described by Kang et al. (2024). Specifically, 1 mL of protein dispersion (10 mg/mL) was mixed with 5 mL of Tris-gly buffer solution. Subsequently, 50 μL of DTNB solution at a concentration of 4 mg/mL was added. After incubating in darkness for 30 min, the absorbance at 412 nm was measured using an ultraviolet spectrophotometer (Shimadzu, Japan) and the content of free sulphhydryl groups was calculated using Equation 1:
where A was the absorbance of the sample, C and D were the protein concentration and dilution factor.
Colour
The colour of polyphosphate-treated SPP was analysed using the method described by Zhao et al. (2021). A colorimeter (DS-36D, Caipu, China) was used to collect three colour components: L* (−L, blackness; +L, whiteness), a* (−a, greenness; +a, redness), and b* (−b, blueness; +b, yellowness). The ΔE served as an indicator of the colour difference between natural protein and polyphosphate-treated SPP and was calculated following Equation 2:
CD spectra
The CD spectra of polyphosphate-treated SPP (0.2 mg/mL) were recorded using a CD spectrometer (V100, Applied Photophysics, UK) in the scanning range of 190–260 nm, and the secondary structure composition of the protein was analysed utilising CDNN software (Xu et al., 2024).
Intrinsic fluorescence spectra
The intrinsic fluorescence spectra of polyphosphate-treated SPP were collected using a fluorescence spectrophotometer (F7000, Hitachi, Japan), with the excitation wavelength set at 280 nm and the emission wavelength ranging from 290 to 450 nm. Both the excitation and emission slit widths were set at 5 nm (Zhao et al., 2024).
Functional properties of polyphosphate-treated SPP
Solubility
The solubility of polyphosphate-treated SPP was assessed using the method described by Zhang et al. (2023a). Specifically, the polyphosphate-treated SPP was dissolved in distilled water to form a dispersion with a concentration of 10 mg/mL, and then continuously stirred for 2 h and subjected to centrifugation at 8,500 rpm for 15 min. The resulting supernatant was collected and the protein content was determined using Coomasil bright blue G-250 colorimetry. The solubility was calculated using Equation 3:
where m1 and m represented the protein content of the supernatant and the sample dispersion.
Water/oil holding capacity
The water/oil holding capacity (WHC/OHC) of polyphosphate-treated SPP was detected following the methods described by Zhang et al. (2023a). The protein powder (1.0 g) was mixed with distilled water or sunflower oil (25 mL) and continuously stirred at room temperature for 2 h. Subsequently, the mixture was centrifuged at 6,000 rpm for 10 min to remove any excess distilled water or sunflower oil. The WHC/OHC was determined by calculating the difference in mass before and after absorption of water/oil.
where m represented the mass of the protein sample, m1 denoted the mass of the protein sample after water/oil adsorption.
Emulsifying capacity
The emulsifying activity index (EAI) and emulsion stability index (ESI) were detected following the method reported by Wang et al. (2019a), with slight modifications. Briefly, 4 mL of soybean oil was mixed with 16 mL of 1% protein dispersion and homogenised using a T18 homogeniser (IKA, Germany) at 12,000 rpm for 3 min. Subsequently, samples of 10 μL were collected from the emulsion at both 0 and 10 min. Each sample was then mixed with 4.0 mL of 0.1% SDS solution. The absorbance of the resulting mixture was measured at a wavelength of 500 nm to calculate the EAI and ESI using Equations 5 and 6:
where C signified the initial protein concentration, φ denoted the volume fraction of oil, DF represented the dilution factor, θ represented the optical path, A0 and A10 represented the absorbance of emulsion at 0 and 10 min, respectively.
Foaming properties
The foaming capacity (FC) and foaming stability (FS) of polyphosphate-treated SPP were assessed using a previously established method (Hadidi et al., 2021). 2% (m/v) protein dispersion was transferred to a graduated cylinder and subjected to homogenisation at 12,000 rpm for 2 min to generate foam. The volume of the foam was then measured at both 0 and 30 min. Equations 7 and 8 were employed to calculate the FC and FS:
where V1 represented the initial volume of protein dispersion, V2 and V3 represented the foam volumes at 0 and 30 min, respectively.
Statistical analysis
The data analysis was conducted using one-way variance analysis and Duncan test in SPSS 19.0 (SPSS Inc., Chicago, USA). A significance level of p < .05 was considered for determining statistical significance.
Results and discussion
Particle size and zeta potential
The particle size of proteins serves as a direct indicator of protein degradation and aggregation, exerting a significant influence on their solubility, stability, emulsification, and other intrinsic properties (Chen et al., 2025; Wang et al., 2019b). Figure 1A–D illustrates the average particle size and distribution of polyphosphate-treated SPP. The native SPP exhibited an average particle size of 1,675.67 nm, which was markedly reduced after polyphosphate treatment. Additionally, SPP treated with STP demonstrated a smaller average particle size compared to that treated with STM (Figure 1A). Furthermore, as the concentration of STP increased, an initial decrease followed by an increase in the particle size of STP-treated SPP was observed (Figure 1C), with the minimum particle size of 490.40 nm achieved at a concentration of 6%. Both untreated and polyphosphate-treated SPP exhibited multi-peak distributions in terms of particle size; however, STP treatment led to a relatively lower maximum peak intensity and a shift towards smaller sizes on the left side (Figure 1B). Additionally, increasing the concentration of STP initially caused the maximum peak position to shift to the left and then to the right (Figure 1D), which was consistent with the average particle size analysis results. Similarly, Zou et al. (2022) found that increasing the concentration of STP led to a leftwards shift in the particle size distribution of phosphorylated wheat gluten, indicating that enhanced electrostatic repulsion and steric hindrance effects between particles resulted in smaller average particle sizes and more widely dispersed particles.
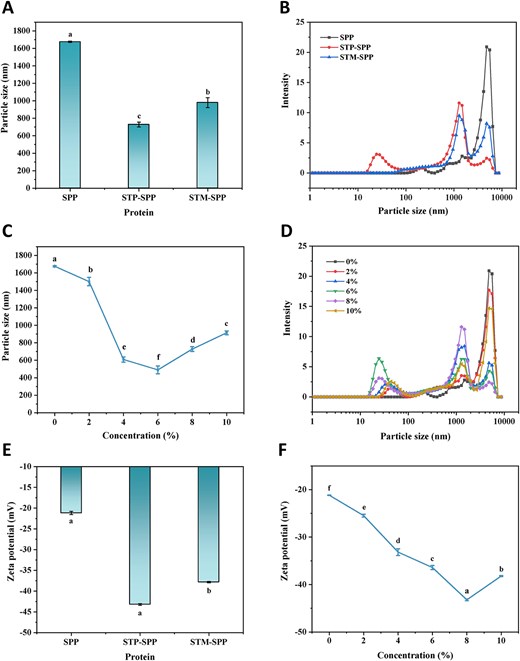
Effects of sodium trimetaphosphate or sodium tripolyphosphate at varying concentrations on the particle size (A and C), size distribution (B and D), and zeta potential (E and F) of spirulina protein (SPP). STP-SPP = sodium tripolyphosphate-treated SPP; STM-SPP = sodium trimetaphosphate-treated SPP.
Zeta potential serves as an indicator of the repulsion or attraction between protein particles and is a crucial parameter for assessing the surface charge of nanoparticles and the stability of protein suspensions (Hadidi et al., 2021). Figure 1E and F illustrates the variation in zeta potential of SPP treated with polyphosphates. As depicted in Figure 1E, native SPP exhibited a negative zeta potential, whereas polyphosphate treatment significantly increased its absolute potential value. Specifically, STP-treated SPP demonstrated a more pronounced enhancement compared to STM, which aligns with the observed trend in the degree of phosphorylation. Additionally, the absolute zeta potential of STP-SPP gradually increased from 21.47 to 43.21 mV as the concentration of STP was increased from 2% to 8% (Figure 1F). However, further increasing the STP concentration led to a decrease in the absolute zeta potential for STP-SPP. This phenomenon can be attributed to the combination of negatively charged phosphate groups (PO43−) with specific hydroxyl and amino groups in the SPP side chains, thereby increasing the electronegativity of protein molecules (Yan & Zhou, 2021). When the STP concentration exceeded 8%, steric hindrance inhibited the phosphorylation reaction, resulting in a reduction in the absolute potential value of STP-SPP. Similar phenomenon has been observed in myofibrillar protein from mantis shrimp treated with sodium pyrophosphate or STP (Jia et al., 2023).
Phosphorylation degree of SPP
The phosphorylation degree of SPP treated with polyphosphates is illustrated in Figure 2A. The phosphorus content of native SPP was measured at 0.23 mg/g, which may be attributed to the inherent presence of inorganic phosphorus within SPP. After treatment with polyphosphates, the phosphorus content of SPP increased. Notably, the phosphorylation degree was lower for SPP treated with STM compared to that treated with STP. This difference can likely be attributed to the lower reaction efficiency between circular STM and SPP relative to the linear structure of STP (Hu et al., 2023). Previous studies have also suggested that short-chain sodium pyrophosphate exhibits a higher affinity for binding to myofibrillar protein chains compared to long-chain STM (Hu et al., 2021; Zhang et al., 2023a). Furthermore, the phosphorylation degree of SPP initially increased and subsequently decreased with increasing concentrations of STP, reaching its peak value of 0.87 mg/g at an 8% concentration. This phenomenon can be explained by a higher propensity for phosphate groups to bind with protein side chains under elevated polyphosphate concentrations (Ai & Jiang, 2021). However, excessive polyphosphate levels hinder the phosphorylation process by causing steric hindrance effects that impede collisions between phosphate groups and protein molecules. Similar findings have been demonstrated in reports investigating polyphosphate-treated perilla protein isolate and wheat gluten (Zhao et al., 2022; Zou et al., 2022).
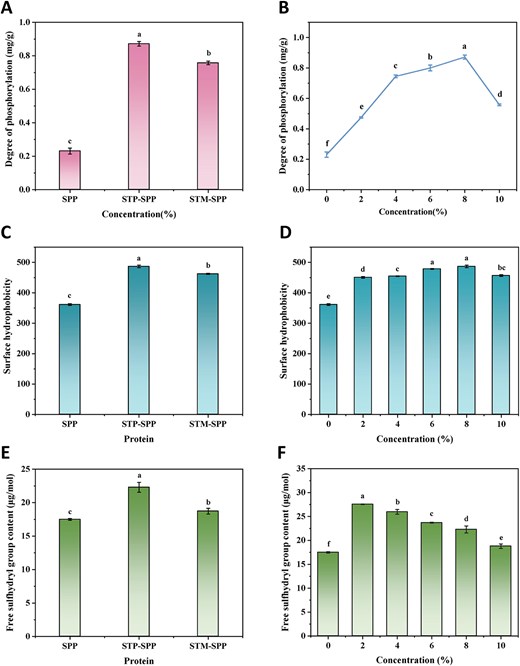
Effects of sodium trimetaphosphate or sodium tripolyphosphate at varying concentrations on the degree of phosphorylation (A and B), surface hydrophobicity (C and D), and free sulphhydryl group content (E and F) of SPP. STP-SPP = sodium tripolyphosphate-treated SPP; STM-SPP = sodium trimetaphosphate-treated SPP.
SDS-PAGE analysis
The impact of phosphorylation treatment on the molecular weight of SPP is shown in Figure 3. Native SPP exhibited four distinct bands ranging from 14 to 97 kDa, and the subunit composition remained largely unchanged after treatment with STP or STM. Furthermore, there were no significant alterations in the subunit composition of SPP treated with different concentrations of STP compared to the control group. These findings suggest that the incorporation of phosphate groups does not disrupt the peptide chain integrity of native SPP and preserves its primary structure. This phenomenon aligns with previous SDS-PAGE analyses of phosphorylated perilla protein isolate and myofibrillar protein (Zhang et al., 2023b; Zhao et al., 2022).
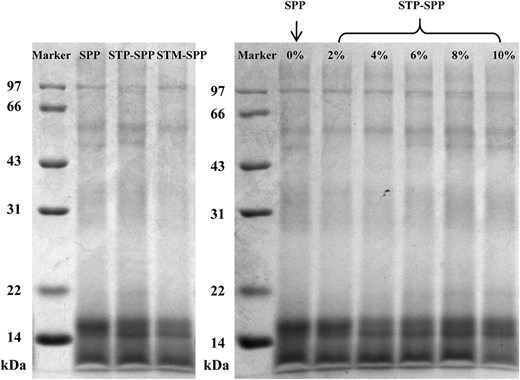
SDS-PAGE protein patterns of native SPP, sodium trimetaphosphate or sodium tripolyphosphate-treated SPP. STM-SPP = sodium trimetaphosphate-treated SPP; STP-SPP = sodium tripolyphosphate-treated SPP.
Surface hydrophobicity
Surface hydrophobicity is a commonly utilised index for characterising the conformational changes of proteins (Deng et al., 2019; Wan et al., 2024). As depicted in Figure 2C, the surface hydrophobicity of native SPP was 361.16, which was significantly lower than that of STP-SPP and STM-SPP. This observation suggests that treatments with STP and STM resulted in a significant increase in the surface hydrophobicity of SPP, with STP exhibiting an even more pronounced enhancement. The introduction of phosphate groups likely increased the ionic concentration within the microenvironment of SPP, promoting partial unfolding and exposing previously hidden hydrophobic regions. Moreover, STP treatment facilitated the exposure of more deeply buried hydrophobic groups within protein molecules. These findings are consistent with previous studies on phosphorylated myofibrillar proteins and wheat gluten (Jia et al., 2023; Zou et al., 2022). Figure 2D shows a gradual increase in the surface hydrophobicity of SPP with increasing concentrations of STP, suggesting that higher concentrations promote the exposure of hydrophobic groups in SPP. However, excessively high phosphate concentrations (e.g., 10%) may hinder this exposure by causing re-embedding through aggregation of protein molecules.
Free sulphhydryl content
Free sulphhydryl groups play a crucial role in determining the extent of protein oxidation and structural modifications. Figure 2E illustrates the impact of polyphosphates on the content of free sulphhydryl groups in SPP. The native SPP exhibited a free sulphhydryl content of 17.50 μmol/g, while phosphorylation treatment significantly enhanced this content in SPP, reaching its maximum value when treated with STP, which may be attributed to the structural differences between STP and STM. The influence of STP concentration on the content of free sulphhydryl groups in SPP is demonstrated in Figure 2F. It can be observed that at a concentration of 2%, STP-SPP reached a peak level of 27.56 μmol/g for free sulphhydryl groups. Subsequently, as the concentration continued to rise, there was a slight decrease in free sulphhydryl content due to oxidation and partial protein aggregation; however, it remained higher than that observed for native SPP. This phenomenon may be attributed to lower phosphate concentrations resulting in greater exposure of embedded free sulphhydryl groups within protein molecules. Furthermore, phosphorylation treatment disrupted disulphide bonds among proteins, further increasing the content of free sulphhydryl groups and leading to molecular elongation, enhanced interfacial contact area at two-phase interfaces, and improved emulsification properties (as shown in Figure 6A and B). Similarly, myofibrillar protein and egg white protein also exhibit increased contents of free sulphhydryl groups after phosphorylation treatment (Hu et al., 2021; Li et al., 2019).
Colour
The effects of polyphosphate type and concentration on the L and ΔE of SPP are presented in Table 1. The native SPP exhibited a blue–green appearance that transformed into a light blue after phosphorylation treatment. Based on the chromaticity data provided in Table 1, it is evident that native SPP possessed the lowest brightness value and darkest colour. After polyphosphate treatment, there was a slight increase in the brightness value of SPP, with STP-SPP showing a more pronounced enhancement. Furthermore, as the concentration of STP increased, there was an initial rise followed by a decline in the brightness value of SPP until reaching its peak at a concentration of 6%. Similarly, when STP reached a concentration of 6%, STP-SPP also displayed maximum colour difference values. Overall, the colour characteristics of proteins are influenced by their inherent properties, purity levels, and pigment content. This study revealed substantial changes in protein colorimetry values following polyphosphate treatment due to potential molecular structure disruption caused by phosphorylation and the removal of certain pigments within proteins. Similar findings have been observed in studies on meat colour regulation using phosphorylation treatment (Li et al., 2017).
Chromaticity value and colour difference of native SPP, sodium trimetaphosphate, or sodium tripolyphosphate-treated SPP.
| L | a | b | ∆E | ||
|---|---|---|---|---|---|
| Protein | SPP | 46.57 ± 0.17b | −3.35 ± 0.08c | 1.73 ± 0.03c | – |
| STP-SPP | 47.12 ± 0.10a | −4.33 ± 0.07a | 2.43 ± 0.42a | 1.33 ± 0.08a | |
| STM-SPP | 46.93 ± 0.03a | −4.11 ± 0.19b | 2.28 ± 0.09b | 1.00 ± 0.12b | |
| Sodium tripolyphosphate concentration (%) | 0 | 46.57 ± 0.17e | −3.35 ± 0.08a | 1.73 ± 0.03c | – |
| 2 | 47.59 ± 0.10b | −3.10 ± 0.00a | 1.08 ± 0.02d | 1.24 ± 0.01c | |
| 4 | 47.47 ± 0.35bc | −4.75 ± 0.19b | 2.62 ± 0.06b | 1.89 ± 0.13b | |
| 6 | 48.66 ± 0.17a | −3.44 ± 0.08a | 3.70 ± 0.06a | 2.88 ± 0.02a | |
| 8 | 47.12 ± 0.10bcd | −4.33 ± 0.07b | 2.43 ± 0.42b | 1.33 ± 0.18c | |
| 10 | 46.90 ± 0.31cd | −3.35 ± 0.08a | 1.77 ± 0.03c | 0.33 ± 0.01d |
Note. STP-SPP = sodium tripolyphosphate-treated spirulina protein; STM-SPP = sodium trimetaphosphate-treated spirulina protein. Different letters show significant differences in different groups (p < .05).
CD spectra
Circular dichroism spectroscopy is widely employed for characterising the composition, folding, and binding properties of protein secondary structure (Liu et al., 2020). Figure 4A and B displays the CD spectra of native SPP, STP-SPP, and STM-SPP. As illustrated in Figure 4A, all three samples exhibited a prominent positive peak at approximately 193 nm and two negative peaks at around 208 and 222 nm. Notably, the intensity of these negative peaks was significantly enhanced in both STP-SPP or STM-SPP compared to that observed in the native SPP, indicating a significant increase in α-helix content due to phosphorylation treatment. The primary mechanism responsible for stabilising the α-helix conformation involves the formation of hydrogen bonds between amino hydrogen and carbonyl oxygen groups within the polypeptide backbone. A higher proportion of α-helix structure would promote protein stability and order (Han et al., 2022). Furthermore, an increase in STP concentration resulted in a reduction in the intensity of the two negative peaks observed in STP-SPP samples, reaching its lowest value when the concentration reached 8%. These findings suggest that variations in ionic strength during STP treatment may induce structural unfolding, thereby affecting the formation of the α-helix structure. Additionally, CNDD software was used to analyse changes in the secondary structure composition of SPI before and after polyphosphate treatment. As shown in Figure 4C and D, the α-helix content in native SPP was approximately 16.1%, while β-turn, β-sheet, and random coil structures accounted for 17.4%, 33.8%, and 32.7%, respectively. In comparison to native SPP, STP-SPP and STM-SPP samples exhibited increased contents of α-helix, β-turn, and random coil structures, along with decreased levels of β-sheet structure. These findings suggest that phosphorylation modification may induce a shift from β-turn structure to other conformations in SPP. Similar trends were observed in phosphorylated walnut protein isolates (Xu et al., 2024). However, Hadidi et al. (2021) reported that phosphorylated mung bean protein showed a 2.2% reduction in α-helix content and a 4.7% decrease in β-sheet structures relative to its unmodified counterpart. These discrepancies may be attributed to variations in both the protein sources and the phosphorylation conditions.
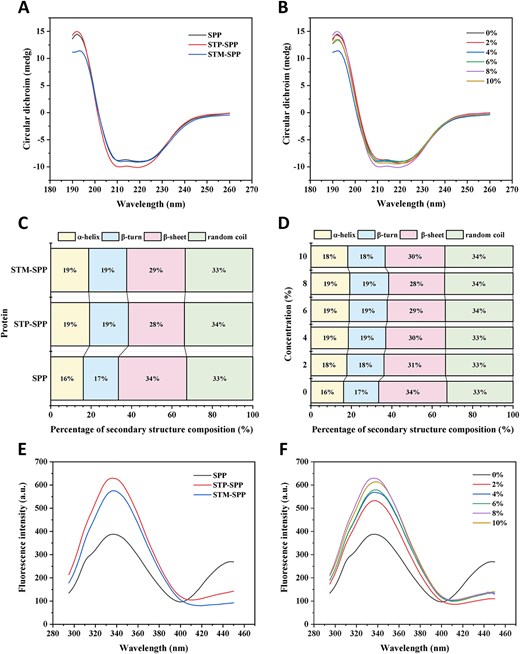
Circular dichroism spectra (A and B), percentage of secondary structure composition (C and D), and intrinsic fluorescence spectra (E and F) of native SPP, sodium trimetaphosphate or sodium tripolyphosphate-treated SPP. STM-SPP = sodium trimetaphosphate-treated SPP; STP-SPP = sodium tripolyphosphate-treated SPP.
Intrinsic fluorescence spectra
The aromatic amino acids are located within the side chains of proteins and exhibit fluorescence upon excitation at 280 nm. This property provides valuable insights into the spatial conformation of proteins. The predominant amino acid residues with aromatic structures include phenylalanine, tryptophan, and tyrosine. These fluorescent molecules, particularly tryptophan, are highly sensitive to environmental changes and serve as important indicators for assessing alterations in protein tertiary conformation (Cen et al., 2022; Yan & Zhou, 2021). Figure 4E displays the fluorescence spectra of STP-SPP and STM-SPP after phosphorylation modification using polyphosphates. It is evident that native SPP exhibited a maximum fluorescence emission peak at a wavelength of 335 nm. After phosphorylation treatment, both STP-SPP (338 nm) and STM-SPP (337 nm) presented a slight red shift in their maximum fluorescence emission peaks, indicating that tryptophan chromophores gradually moved towards the outer region of protein molecules due to partial unfolding of SPP’s molecular structure, resulting in increased polarity within their microenvironment. Furthermore, compared to native SPP, both STP-SPP and STM-SPP exhibited significantly enhanced fluorescence intensity, which can be attributed to changes in protein spatial conformation caused by the introduction of phosphate groups, leading to greater exposure of tryptophan residues within the protein structure. Similar phenomena have been observed in phosphorylated rice gluten, walnut protein isolate, and duck ovalbumin, suggesting that phosphorylation modification induces conformational changes in the spatial structure of SPP. Additionally, it is worth noting that STP-SPP treated with varying concentrations of STP displayed higher fluorescence intensity compared to native SPP (Figure 4F). Furthermore, as the concentration of STP was enhanced, the fluorescence intensity of STP-SPP initially increased and subsequently decreased, reaching its maximum at 8% STP. This observation suggests an increased exposure of tryptophan residues to a more polar environment. A similar finding has been reported in phosphorylated duck egg white protein (Ai & Jiang, 2021).
Functional properties of polyphosphate-treated SPP
Solubility
The solubility of proteins is a critical factor that significantly influences their gelation behaviour, emulsification capacity, foaming ability, and thermal stability (Hu et al., 2023). Figure 5A demonstrates the solubility of SPP after treatment with different polyphosphates. It can be observed that native SPP exhibited a relatively low solubility of only 30.76%. However, treatments with STP and STM resulted in a significant improvement in the solubility of SPP, with STP showing a more pronounced enhancement. Hu et al. (2021) also highlighted that STP was more efficient than STM in enhancing myofibrillar protein solubility. Moreover, increasing concentrations of STP initially enhanced the solubility of STP-SPP, reaching a peak of 50.73% at an 8% concentration (Figure 5B); beyond this point, higher concentrations led to increased ionic strength, which subsequently decreased the solubility of STP-SPP. The observed enhancement in solubility of polyphosphate-treated SPP can be attributed to the increased electronegativity of proteins and the formation of multiple hydrogen bonds between phosphate groups and protein molecules, thereby influencing their hydrophobic/hydrophilic balance and facilitating their interaction with water molecules. This leads to greater repulsion among protein molecules while promoting their hydration. Additionally, the elevated ionic strength and alkaline conditions provided by polyphosphates further enhance SPP solubility after phosphorylation treatment. These findings are consistent with previous studies on the solubility of phosphorylated perilla protein isolate and myofibrillar protein (Zhang et al., 2023a; Zhao et al., 2024). Moreover, the affinity between phosphate groups and proteins is influenced by their molecular structure and average chain length. Consequently, shorter-chain STP may facilitate easier binding to SPP compared to ring-structured STM (Hu et al., 2023), which could explain why phosphorylation using STP is more effective than STM.
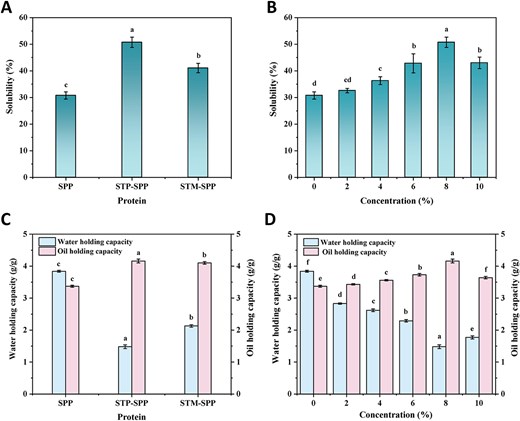
Solubility (A and B), water holding capacity, and oil holding capacity (C and D) of native SPP, sodium trimetaphosphate or sodium tripolyphosphate-treated SPP. STM-SPP = sodium trimetaphosphate-treated SPP; STP-SPP = sodium tripolyphosphate-treated SPP.
Water holding capacity
The water holding capacity of protein is closely associated with the taste and texture properties of foods, which refers to its capacity to retain water molecules (Wang et al., 2021). As shown in Figure 5C, SPP exhibited the highest water holding capacity (3.84 g/g), followed by STM-SPP (2.13 g/g) and STP-SPP (1.48 g/g). The amino acid composition of a protein serves as one of the key factors determining its water-holding capability. Moreover, intrinsic factors such as particle size and protein conformation also exert significant influences on the water-holding capacity of protein. The superior water holding capacity of SPP can be attributed to factors such as reduced solubility in water, larger particle size, and lower α-helix structure that enhance protein hydration (Hong et al., 2024). Additionally, the concentration of STP also plays a crucial role in determining the water holding capacity of STP-SPP (as shown in Figure 5D). Specifically, at an 8% concentration, the water holding capacity reached its minimum value due to increased phosphate groups that enhance interaction with water molecules and solubility in aqueous solutions. However, Zhang et al. (2023b) observed that incorporating hydrophilic phosphate groups capable of binding multiple water molecules significantly enhanced the water-holding capacity of myofibrillar protein during the gel formation phase. Similarly, Jia et al. (2023) reported that phosphorylation treatment greatly enhanced the ability of myofibrillar protein to retain water during heating-induced gel formation. The differences between our findings and previous studies primarily arise from variations in protein sources and functional properties.
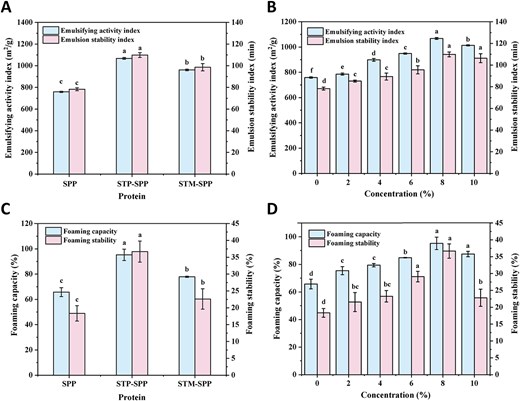
Emulsifying activity index and emulsion stability index (A and B), foaming capacity and foaming stability (C and D) of native SPP, sodium trimetaphosphate or sodium tripolyphosphate-treated SPP. STM-SPP = sodium trimetaphosphate-treated SPP; STP-SPP = sodium tripolyphosphate-treated SPP.
Oil holding capacity
Oil holding capacity refers to the protein’s ability to adsorb oil, which can be used as an indicator of its hydrophobic properties. Figure 5C and D illustrates the oil holding capacity of SPP and polyphosphate-treated SPP. As depicted in Figure 5C, native SPP exhibited an oil holding capacity of 3.37 g/g, which was significantly lower than previously reported values for papaya seed protein (10.77 g/g) and Euglena gracilis protein isolate (5.14 g/g) (Deng et al., 2019; Hong et al., 2024). However, after treatment with polyphosphates, particularly STP, the oil holding capacity of SPP increased significantly. Furthermore, as the concentration of STP increased, STP-SPP initially showed an increase in oil holding capacity, followed by a subsequent decrease until reaching a maximum value of 4.16 g/g at an 8% concentration of STP. Previous studies have suggested that proteins with higher surface hydrophobicity tend to exhibit enhanced oil absorption capacities. Therefore, it is plausible to suggest that phosphorylation modification enhances the oil holding capacity of SPP by exposing embedded hydrophobic groups to the external environment during reaction processes (Deng et al., 2019). However, when the concentration of STP exceeds a certain threshold, steric hindrance effects induce partial aggregation within proteins, thereby impeding further oil adsorption and ultimately resulting in a decrease in oil holding capacity.
Emulsifying capacity
EAI and ESI are commonly employed to characterise the protein’s ability in stabilising the two-phase interface and the resistance of formed emulsions against phase separation. Figure 6A and B demonstrate the emulsification properties of SPP treated with polyphosphates. As shown in Figure 6A, both the EAI (758.65 m2/g) and ESI (78.28 min) of untreated SPP were comparatively lower. However, significant improvements were observed after polyphosphate treatment. Specifically, the EAI of SPI treated with STP and STM increased to 1067.76 and 961.3 m2/g, respectively, while the corresponding ESI enhanced to 109.86 and 98.61 min. This improvement may be attributed to the phosphorylation treatment that increases the hydrophobicity of protein surfaces, resulting in a more favourable balance between hydrophilic and hydrophobic ratios required for effective emulsification. Consequently, this facilitates rapid protein adsorption at the oil–water interface. Additionally, the introduction of phosphate groups enhances electrostatic repulsion between droplets, further improving protein adsorption at the interface by promoting increased solubility, which in turn facilitates an enhancement in diffusion rate and strengthens interfacial films. The work conducted by Xiong et al. (2016) also demonstrated that STP treatment led to an increase in negative charges and intermolecular repulsion within ovalbumin, resulting in a significant reduction in particle size. This modification facilitated the rapid accumulation of ovalbumin at interfaces and exhibited improved emulsifying properties. As depicted in Figure 6B, both the EAI and ESI of STP-SPP initially increased and then decreased with increasing concentration of STP, reaching their maximum value at an 8% concentration. This observation can be attributed to the phosphorylation reaction inducing changes in protein conformation, leading to the formation of rigid interfacial films characterised by a high-density structure along with enhanced hydrophobic interactions due to the introduction of phosphate groups. These results suggest that phosphorylation may serve as an effective alternative method for endowing proteins with ideal emulsifying properties to stabilize emulsions under harsh environmental conditions, which can be advantageous for emerging food technologies (Hu et al., 2023).
Foaming properties
Proteins exhibit strong foaming properties, as they can rapidly adsorb onto the air–water interface to form a stable film that enhances bubble stabilisation. The evaluation of protein foaming properties generally involves assessing their FC and FS. Figure 6C and D illustrate the foaming characteristics of SPP treated with polyphosphates. As depicted in Figure 6C, native SPP only exhibited a FC of 65.71% and an FS of 18.34%. However, after treatment with STP and STM, both the FC and FS of SPP were significantly enhanced, with STP exhibiting a more pronounced effect. Previous studies have demonstrated that proteins possessing high solubility and surface hydrophobicity can effectively adsorb at the air–water interface, leading to a substantial reduction in interfacial tension that facilitates air entrapment. Similarly, phosphorylation modifications have been observed to increase the FC of pea protein isolate and soy protein isolate (Liu et al., 2020, 2021). Furthermore, the FC and FS of STP-SPP increased significantly from 65.71% and 18.34% to 95.23% and 36.68%, respectively, with increasing phosphate concentration after treatment with STP. This enhancement can be attributed to the strong electrostatic repulsion generated by sufficient intermolecular interactions between adjacent interface films used for foam stabilisation due to their high electronegativity. These findings are consistent with zeta potential as well as phosphorylation degree analysis of polyphosphate-treated SPP.
Conclusion
The polyphosphate modification significantly enhances the physicochemical properties, solubility, emulsifying capacity, and foaming ability of SPP. This finding provides a valuable technical reference for improving the stability of emulsion delivery carriers based on SPP. After treatment with polyphosphates, numerous phosphate groups are covalently bound to the skeleton of SPP, increasing its surface electronegativity and intermolecular electrostatic repulsion. Simultaneously, it promotes the unfolding of the molecular structure of the protein, resulting in increased exposure of hidden hydrophobic groups and free sulphhydryl groups on its surface. These changes lead to alterations in secondary structure and tertiary conformation. Consequently, water molecules have a higher likelihood of binding to proteins, thereby enhancing the solubility as well as emulsification and foaming capacity of SPP. Furthermore, STP exhibits superior functional modification effects compared to STM on SPP at an 8% concentration. Based on these findings, it is speculated that the improved functional properties achieved through STP treatment may enhance the stability and broaden applications for emulsion delivery carriers containing functional components; however, further exploration is required.
Data availability
The data that support the findings of this study areavailable from the corresponding author upon reason-able request.
Author contributions
Qiaoli Zhao (Conceptualization [lead], Investigation [lead], Writing—original draft [lead]), Zhiying Yang (Data curation [equal]), Meiyi Li (Data curation [equal], Methodology [equal]), Jinwei Li (Writing—review & editing [equal]), Saiyi Zhong (Funding acquisition [equal], Project administration [equal], Writing—review & editing [equal])
Funding
This research was supported by National Natural Science Foundation of China (32402136), Programme for scientific research start-up funds of Guangdong Ocean University (060302042402), Guangdong Basic and Applied Basic Research Foundation (2023A1515010005), and Special fund for universities in Guangdong Province in the key area of biomedicine and health (2023ZDZX2025).
Conflicts of interest
None declared.
Acknowledgements
None.
