


Abstract
Chronic stress and depression are associated with alterations in the hypothalamic–pituitary–adrenal signaling cascade and considered a risk factor for bone loss and fractures. However, the mechanisms underlying the association between stress and poor bone health are unclear. Using a transgenic (tg) mouse model in which glucocorticoid signaling is selectively disrupted in mature osteoblasts and osteocytes [11β-hydroxysteroid-dehydrogenase type 2 (HSD2)OB-tg mice], the present study examines the impact of chronic stress on skeletal metabolism and structure. Eight-week-old male and female HSD2OB-tg mice and their wild-type (WT) littermates were exposed to chronic mild stress (CMS) for the duration of 4 weeks. At the endpoint, L3 vertebrae and tibiae were analyzed by micro–computed tomography and histomorphometry, and bone turnover was measured biochemically. Compared with nonstressed controls, exposure to CMS caused an approximately threefold increase in serum corticosterone concentrations in WT and HSD2OB-tg mice of both genders. Compared with controls, CMS resulted in loss of vertebral trabecular bone mass in male WT mice but not in male HSD2OB-tg littermates. Furthermore, both tibial cortical area and area fraction were reduced in stressed WT but not in stressed HSD2OB-tg male mice. Osteoclast activity and bone resorption marker were increased in WT males following CMS, features absent in HSD2OB-tg males. Interestingly, CMS had little effect on vertebral and long-bone structural parameters in female mice. We conclude that in male mice, bone loss during CMS is mediated via enhanced glucocorticoid signaling in osteoblasts (and osteocytes) and subsequent activation of osteoclasts. Female mice appear resistant to the skeletal effects of CMS.
Chronic stress and depressive disorders adversely affect bone mineral density (1–3) and are associated with higher rates of fractures (4–6). Rodent models of chronic stress consistently reproduce the skeletal phenotype of bone loss and osteoporosis (7–9); however, the mechanisms underlying the association between stress and poor bone health remain largely obscure.
The pathogenesis of stress-related bone loss is clearly multifactorial, and changes in the endocrine regulation of bone and mineral homeostasis are likely to play a role (2). Thus, chronic stress is associated with prolonged activation of the hypothalamic–pituitary–adrenal axis (10, 11) and sustained hypercortisolaemia (12), a known negative regulator of bone mass (13).
At supraphysiological concentrations, glucocorticoids inhibit osteoblast and osteocyte function (14) and transiently increase osteoclast activity through a combination of direct effects on osteoclasts and changes in the receptor activator of NF-κB ligand/osteoprotegrin (RankL/Opg) ratio (13, 15). Thus, the initial stage of glucocorticoid-induced bone loss is characterized by a rapid increase in bone resorption (13). During prolonged exposure to high levels of glucocorticoids, their inhibitory effects on osteoblasts, osteocytes, and osteoclasts supplant the (transient) increase in osteoclast activity, leading to a profound reduction in bone turnover and sustained bone loss (16). Despite their direct effects on all skeletal cellular subsets, recent studies identified osteoblasts and osteocytes as the key target cells of glucocorticoids within the skeleton. When osteoblasts and osteocytes were genetically shielded from the deleterious effects of glucocorticoids through specific genetic manipulations in rodents, an adequate balance between bone formation and resorption was maintained and skeletal structure was preserved (15, 17, 18).
Consequently, the stress-related increase in systemic glucocorticoid levels and their known effects on bone cells led us to hypothesize that stress-induced bone loss is causally linked to changes in glucocorticoid signaling within osteoblasts and osteocytes. To test this hypothesis we used a mouse model in which glucocorticoid signaling has been selectively disrupted in osteoblasts and osteocytes via targeted transgenic (tg) overexpression of the glucocorticoid inactivating enzyme 11β-hydroxysteroid-dehydrogenase type 2 (11β-HSD2), or HSD2OB-tg mice (18–20). The current study investigates the effects of chronic mild stress (CMS) on bone structure, histology, and metabolism in wild-type (WT) and HSD2OB-tg mice of both genders.
Materials and Methods
Animal model
The HSD2OB-tg mice (CD1 Swiss White background) used in this study were generated and characterized previously (19–21). In short, HSD2OB-tg mice overexpress the potent glucocorticoid inactivating enzyme 11β-HSD2 under the control of the osteoblast- and osteocyte-specific 2.3-kb collagen type Ia1 promoter, thereby effectively disrupting glucocorticoid signaling specifically in mature osteoblasts and osteocytes.
As shown previously, the disruption of glucocorticoid signaling in osteoblasts and osteocytes via overexpression of 11β-HSD2 is associated with a mild reduction in spinal trabecular bone mass when compared with WT littermates (19). Additionally, HSD2OB-tg mice exhibit a reduction in the size of the periosteal envelope in long bones when compared with WT controls (20). These differences occur independently of CMS and have been well characterized in male and female mice previously (19–21). Therefore, the effects of CMS in WT and HSD2OB-tg mice are being assessed by comparing stressed mice to their respective genotype-matched, nonstressed control group.
Because glucocorticoids as well as stress-related disorders show a sexual dimorphism, we characterized the skeletal response to CMS in male and female mice (22, 23). Eight-week-old WT and tg male and female mice were exposed to either CMS or maintained undisturbed for 4 weeks. Aside from the procedures used to induce CMS, mice were housed under standard laboratory conditions on a 12-hour light:12-hour dark cycle with free access to standard chow and water. Blood was collected at the endpoint (day 28). Animals were kept at the animal facility of the ANZAC Research Institute, in accordance with institutional animal welfare guidelines. All studies were approved by the institutional animal ethics committee.
Chronic mild stress
HSD2OB-tg mice along with their WT littermates were exposed to an established protocol of chronic stress and depression, known as CMS. The CMS protocol has been used in a variety of studies not only to investigate skeletal changes (7, 8) but also depression-induced alterations in the central nervous system (24–26). As part of the stress protocol, mice are subjected to a series of unpredictable environmental stressors during a period of 4 weeks. Stressors included (per week) three 30-minute episodes each of physical restraint, 30 minutes each of exposure to cold water or a heat source, 360 minutes of cage tilt, and two overnight illuminations. All stressors were applied in random order with 2 days per week remaining stressor-free.
Micro–computed tomography
Micro–computed tomography (micro-CT) analyses of the tibia and L3 vertebra were performed using a SkyScan 1172 (Bruker, Kontich, Belgium) as previously described (19). In short, the tibia and vertebra were immersed in phosphate buffered saline and inserted in the scanner according to the manufacturer’s instructions. Scanning was performed at 60 keV, 167 μA, 1475 ms without filter. In total, ∼1100 projections were collected per sample at a resolution of 7.6 μm per pixel. Three-dimensional reconstruction and analyses of the samples were performed using NRecon and CTAn software, respectively (Bruker). The region of interest was selected employing an automated algorithm. For the tibia, two 1-mm-long regions of interest were selected for analysis of trabecular bone (0.5 mm distal to the growth plate) and cortical bone (2.5 mm distal of the growth plate). Vertebral trabecular bone parameters were quantified for the entire space between the cranial and caudal growth plates. Morphologic measurements following three-dimensional analysis included bone volume fraction, trabecular number, trabecular thickness, trabecular separation for trabecular bone, as well as cortical thickness, area, and area fraction for cortical bone.
Dynamic histomorphometry
Animals received intraperitoneal injections of calcein (30 mg/kg body weight) 10 and 3 days before tissue collection. Xylenol orange–stained, methylmethacrylate-embedded 5-μm sections of the L2 vertebra and proximal tibia were analyzed for fluorochrome labels according to standard procedures using OsteoMeasure software (OsteoMetrics, Decatur, GA). Mineral apposition rate and bone formation rate were calculated as described previously (27, 28).
Histomorphometry
Bone samples were fixed in 4% paraformaldehyde (Merck KGaA, Darmstadt, Germany), decalcified in 10% EDTA, and subsequently embedded in paraffin. For both the tibia as well as the L3 vertebra, 5-μm-thick sections were acquired at two levels 100 μm apart. For the analyses of trabecular bone, standardized regions of interest were placed in the axial middle of tibiae and vertebrae at 0.3 mm underneath the growth plate(s). Cortical bone was assessed in the tibia using a region of interest covering the region 1.5 to 3.0 mm below the growth plate. Osteoclast number and osteoclast surface relative to bone surface were measured at ×20 magnification following a tartrate-resistant acid phosphatase stain. Osteoblasts were identified by morphology as well as alkaline phosphatase (ALP) staining, and the osteoblast surface was calculated (×20 magnification). Histomorphometric measurements were performed using OsteoMeasure software (OsteoMetrics).
Steroid and biochemical measurements
Blood was collected at the endpoint of the study via cardiac puncture. Serum corticosterone (CS), testosterone, dehydroepiandrosterone (DHEA), and progesterone levels were analyzed by stable isotope dilution liquid chromatography–tandem mass spectrometry as described previously (29). Plasma levels of total osteocalcin were measured by a competitive radioimmunoassay (Immutopics International, San Clemente, CA). Plasma mouse TRAP5b was quantified using a solid-phase immunofixed enzyme activity assay (IDS, Bolden, UK).
Gene expression
Bone marrow was flushed from the tibia prior to isolation of total RNA using TRIzol (Invitrogen, Carlsbad, CA). First-strand complementary DNA was synthesized from 2 μg of total RNA during 1-hour incubation with SuperScript III reverse transcription (Invitrogen) at 50°C following oligo(dT) priming. The expression of messenger RNAs was estimated by real-time reverse transcription polymerase chain reaction (primer sequences are available upon request). Real-time reverse transcription polymerase chain reaction was carried out using iQ SYBR Green supermix (Bio-Rad Laboratories, Hercules, CA) according to the manufacturer’s instructions, using a Bio-Rad iCycler iQ5 real-time polymerase chain reaction detection system (Bio-Rad Laboratories). 18S was used for complementary DNA normalization. The following primers were used to determine gene expression: Sost, forward, 5′-AGGAGAGAGAGCGTTTGTAACA-3′, reverse, 5′-GCTTTCAGTCTTTGTGGATGAGT-3′; RankL, forward, 5′-GAAACTCACAGCCCTCTCTCTT-3′, reverse, 5′-TCATAAGCATCGGAATACCTCTC-3′; Opg, forward, 5′-GCCTTCTTCAGGTTTGCTGT-3′, reverse, 5′-TTTATCCTCTCTACACTCTCGGC-3′; and 18s, forward, 5′-CATGATTAAGAGGGACGGC-3′, reverse, 5′-TTCAGCTTTGCAACCATACTC-3′.
Statistical analysis
Data are shown as mean ± standard deviation (SD). The effects of chronic stress, mouse genotype, and their interaction were analyzed by full-factorial two-way analysis of variance (ANOVA). When significant differences were detected by ANOVA, individual group means were compared using Holm–Sidak post hoc tests for multiple pairwise comparisons. Nonparametric data (testosterone serum concentrations) were assessed via a Kruskal–Wallis test, followed by a Dunn test for multiple comparisons. P values of <0.05 were considered significant.
Results
Systemic steroid hormone levels
CMS induced significant hypercorticosteronemia in male and female mice, independent of genotype. In both WT and HSD2OB-tg mice, serum CS concentrations were approximately threefold higher in stressed animals compared with their respective controls [Fig. 1(a) and 1(b)]. To assess the role of androgen signaling during CMS, both serum testosterone and DHEA were determined in male mice. Neither testosterone nor DHEA was affected by stress exposure [Fig. 1(c) and 1(d)]. However, consistent with the increase in CS serum levels, an increase in progesterone, the direct CS precursor, was detected in stressed mice [Fig. 1(e)].
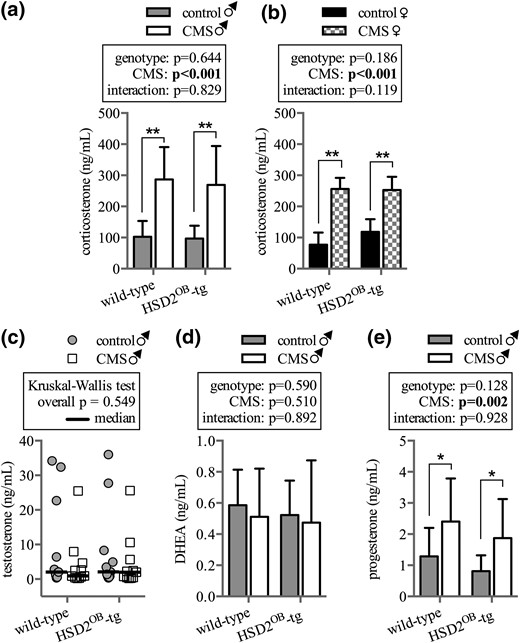
Hormone levels in male and female mice. Serum concentrations of CS in (a) male and (b) female WT and HSD2OB-tg mice following 28 days of exposure to CMS (n = 11 per group for males, n = 8 per group for females) are shown. Serum concentrations of (c) testosterone, (d) DHEA, and (e) the CS precursor progesterone in male mice at endpoint (n = 11 per group for all) are shown. In (a, b,d, e), data are presented as mean ± SD. (c) Testosterone data follow a nonparametric distribution and are displayed as scatter plot and median. Data were analyzed by (a, b, d, and e) two-way ANOVA followed by a Holm–Sidak post hoc test and (c) by a Kruskal–Wallis test. *P < 0.05, **P < 0.01 vs genotype-matched control.
Male mice: vertebral bone
Micro-CT analysis of the L3 vertebra revealed significant loss of trabecular bone mass (16% during 4 weeks) in stressed compared with nonstressed WT mice. In contrast, trabecular bone mass remained similar in stressed and nonstressed HSD2OB-tg mice [Fig. 2(a)]. The reduction of trabecular bone mass in stressed wild-type mice was largely due to a reduction in trabecular number [Fig. 2(c)], whereas trabecular thickness and pattern factor remained unaffected [Fig. 2(b) and 2(d)]. As a result, trabecular separation and structural modeling index were significantly greater in stressed than nonstressed WT mice [Fig. 2(d)]. In contrast, trabecular architecture stayed unchanged in HSD2OB-tg mice exposed to chronic stress [Fig. 2(b–f)].

Trabecular bone phenotype in male mice: vertebra. Micro-CT analysis is shown of (a) trabecular bone volume over total volume (BV/TV), (b) trabecular thickness (Tb.Th.), (c) trabecular number (Tb.No.), (d) trabecular separation (Tb.Sp.), (e) trabecular pattern factor (Tb.Pf.), and (f) structural modeling index (SMI) in the L3 vertebra of WT and HSD2OB-tg mice (n = 11 per group) at endpoint, followed by (g) trabecular mineral apposition rate (MAR), (h) mineralizing surface over bone surface (MS/BS), and (i) bone formation rate (BFR), (j) osteoblast surface (Ob.S.), and (k) osteoclast surface (Oc.S.) (n = 8 per group). Data are presented as mean ± SD and were analyzed by two-way ANOVA followed by a Holm-Sidak post hoc test. *P < 0.05, **P < 0.01 vs genotype-matched control.
Although the mineral apposition rate remained unaffected by CMS [Fig. 2(g)], the bone formation rate showed a trend increase in WT mice but not in HSD2OB-tg mice [Fig. 2(i)]. This change was largely due to an increase in mineralizing surface in WT animals following CMS [Fig. 2(h)]. Of note, vertebral trabecular mineral apposition rate, bone formation rate, and mineralizing surface remained unchanged in HSD2OB-tg mice following 28 days of CMS [Fig. 2(h) and 2(i)]. Furthermore, the osteoblast surface was unaffected by CMS in both WT as well as HSD2OB-tg mice [Fig. 2(j)]. Concurrently, we observed a significant increase in osteoclast surface in stressed vs nonstressed WT mice [Fig. 2(k)]. Thus, whereas stress-exposed WT mice exhibit the structural characteristics of bone loss paired with an increase in bone resorption, CMS did not affect any of the above parameters in HSD2OB-tg mice (2H-K).
Male mice: long bone phenotype
In contrast to the changes observed in the spine, trabecular bone structure in the tibia was unaffected by CMS in both WT and HSD2OB-tg mice [Fig. 3(a–f)]. Similarly, dynamic as well as static histomorphometry showed no significant difference between the study groups at the trabecular site [Fig. 3(g–k)].
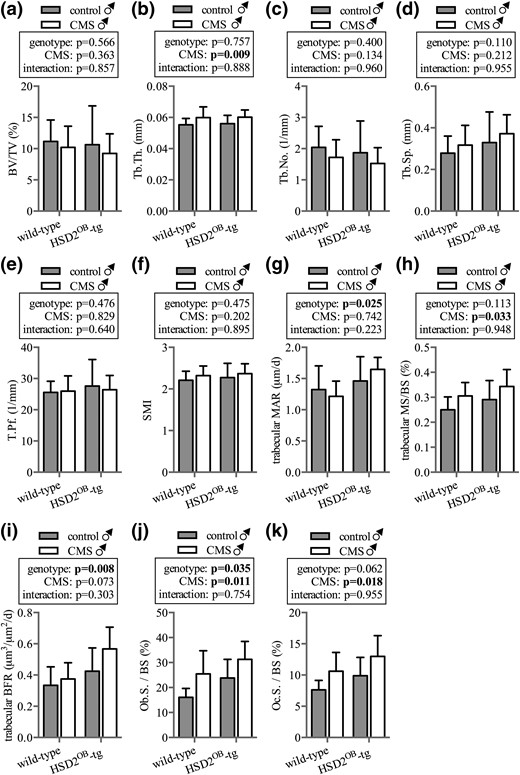
Trabecular bone phenotype in male mice: tibia. Micro-CT analysis is shown of (a) trabecular bone volume (BV/TV), (b) trabecular thickness (Tb.Th.), (c) trabecular number (Tb.No.), (d) trabecular separation (Tb.Sp.), (e) trabecular pattern factor (Tb.Pf.), and (f) structural modeling index (SMI) in the tibia of WT and HSD2OB-tg mice (n = 11 per group) at endpoint, followed by the histomorphometric assessment of the (g) trabecular mineral apposition rate (MAR), (h) mineralizing surface over bone surface, (i) bone formation rate (BFR), (j) osteoblast surface (Ob.S.), and (k) osteoclast surface (Oc.S.) (n = 8 per group). Data are presented as mean ± SD and were analyzed by two-way ANOVA followed by a Holm–Sidak post hoc test. *P < 0.05, **P < 0.01 vs genotype-matched control.
Interestingly, however, in contrast to tibial trabecular bone, CMS significantly affected tibial cortical bone structure in animals with intact osteoblastic and osteocytic glucocorticoid signaling. Thus, tibial cortical area, area fraction, and thickness were all reduced in CMS-exposed WT but not in HSD2OB-tg animals [Fig. 4(b–d)]. Dynamic histomorphometry revealed similar rates of mineral apposition and bone formation as well as mineralizing surface at the endocortex across all groups [Fig. 4(e–g)]. However, at the pericortex, mineral apposition showed a trend toward lower rates in stressed WT animals, whereas HSD2OB-tg mice maintained mineral apposition at this site [Fig. 4(h)]. Following CMS exposure, the mineralizing surface and rate of bone formation at the pericortex were significantly impaired in WT but not in HSD2OB-tg animals [Fig. 4(h–j) and 4(l)]. Lastly, the number of endocortical osteoclasts was significantly increased in WT mice but remained unaffected in HSD2OB-tg animals [Fig. 4(k)].

Cortical bone phenotype in male mice: tibia. Micro-CT analysis is shown of (a) total periosteal envelope area (Tt.Ar.), (b) cortical area (Ct.Ar.), (c) cortical area fraction (Ct.Ar./Tt.Ar.), and (d) cortical thickness (Ct.Th.) in WT and HSD2OB-tg mice (n = 11 per group) at endpoint, followed by the histomorphometric assessment of the (e) endocortical mineral apposition rate (MAR), (f) endocortical mineralizing surface over bone surface (MS/BS), and (g) endocortial bone formation rate (BFR) as well as (h) pericortical MAR, (i) pericortical MS/BS, (j) pericortical BFR, and (k) the endocortical osteoclast surface (n = 6 to 7 per group). (l) Representative images of skeletal calcein labels at the pericortex. Data are presented as mean ± SD and were analyzed by two-way ANOVA followed by a Holm–Sidak post hoc test. *P < 0.05, **P < 0.01 vs genotype-matched control.
Female mice: skeletal phenotype
In contrast to male mice, CMS had no effect on bone mass or vertebral trabecular architecture in female animals [Fig. 5(a–d)]. In the tibia, neither genotype nor chronic stress altered trabecular bone volume or structure with the exception of small changes in trabecular separation [Fig. 5(e–h)]. Similar to their male littermates, female HSD2OB-tg controls showed a small increase in cortical area fraction and cortical thickness compared with WT controls [Fig. 5(k) and 5(l)]; however, CMS had no effect on cortical bone in female mice of both genotypes [Fig. 5(i–l)].

Skeletal phenotype in female mice. Micro-CT analysis is shown of vertebral (a) trabecular bone volume over total volume (BV/TV), (b) trabecular thickness (Tb.Th.), (c) trabecular number (Tb.No.), and (d) trabecular separation (Tb.Sp.) in WT and HSD2OB-tg females at endpoint, followed by tibial (e) trabecular bone volume (BV/TV), (f) trabecular thickness (Tb.Th.), (g) trabecular number (Tb.No.), and (h) trabecular separation (Tb.Sp.). Micro-CT analysis is shown of tibial (i) total periosteal envelope area (Tt.Ar.), (j) cortical area (Ct.Ar.), (k) cortical area fraction (Ct.Ar./Tt.Ar.), and (l) cortical thickness (Ct.Th.) (n = 8 per group). Data are presented as mean ± SD and were analyzed by two-way ANOVA followed by a Holm–Sidak post hoc test. *P < 0.05, **P < 0.01 vs genotype-matched control.
Bone turnover markers and gene expression
Compared with their respective nonstressed controls, serum osteocalcin concentrations were lower in CMS-exposed WT but not HSD2OB-tg male mice [Fig. 6(a)]. In keeping with the known effects of glucocorticoids on sclerostin expression (30), CMS induced Sost gene and protein expression in WT mice but not in HSD2OB-tg animals [Fig. 6(b–d)]. Furthermore, CMS exposure increased serum TRAP5b levels in stressed WT and stress-exposed HSD2OB-tg males when compared with controls; however, TRAP5b levels remained significantly higher in CMS-treated WT males than in HSD2OB-tg littermates [Fig. 6(e)]. There was a trend toward increased skeletal RankL expression in CMS vs control mice, and average serum RankL levels were higher in WT compared with HSD2OB-tg mice, although neither of these differences was statistically significant [Fig. 6(f)]. Skeletal Opg expression remained unaffected by CMS [Fig. 6(g)], and the RankL/Opg ratio was significantly increased in WT animals compared with HSD2OB-tg mice regardless of CMS [Fig. 6(h)].
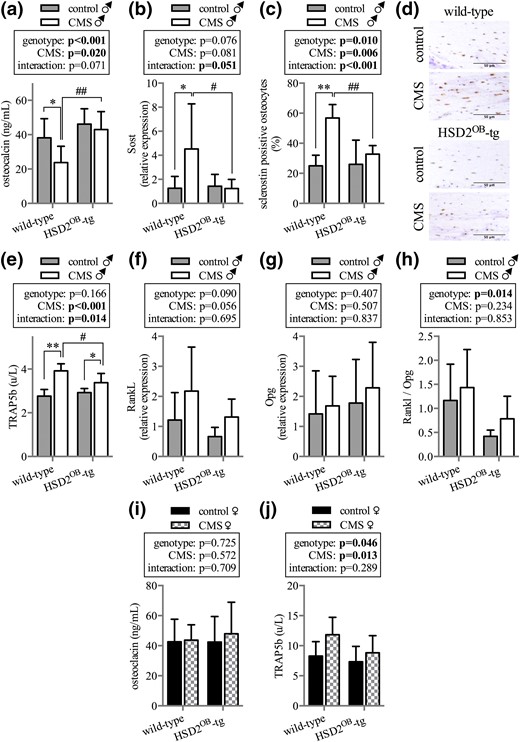
Bone turnover markers and gene expression. (a) Serum concentration of osteocalcin (n = 8 per group) and (b) skeletal Sost gene expression as well as (c and d) histological quantification of sclerostin protein expression in bone (n = 6 per group) after 4 weeks of CMS exposure in male mice. (e) TRAP5b serum concentration (n = 8 per group) as well as (f) RankL, (g) Opg, and (h) RankL/Opg ratio (n = 6 per group) in WT and HSD2OB-tg male mice at endpoint. Serum concentrations of (i) osteocalcin (n = 8 per group) and (j) TRAP5b (n = 6 per group) in WT and HSD2OB-tg female mice. Data are presented as mean ± SD and were analyzed by two-way ANOVA followed by a Holm–Sidak posthoc test. *P < 0.05, **P < 0.01 vs genotype-matched control; #P < 0.05, ##P < 0.01 vs WT CMS.
In female mice neither osteocalcin [Fig. 6(i)] nor amino-terminal propeptide of type I procollagen (data not shown) or TRAP5b [Fig. 6(j)] serum concentrations showed significant differences between individual groups.
Discussion
The present study provides evidence that CMS induces bone loss through enhanced glucocorticoid signaling in osteoblasts and osteocytes. In male mice, exposure to chronic stress leads not only to an increase in systemic glucocorticoid concentrations but also to a concurrent loss of bone mass in the spine as well as the tibial cortex. In contrast, abrogation of glucocorticoid signaling in osteoblasts and osteocytes (but in no other cell or tissue) completely prevents stress-induced bone loss. Notably, exposure to chronic stress had no effect on skeletal structure in female mice, despite markedly increased systemic CS concentrations. Thus, CMS appears to induce bone loss in a site- and gender-specific manner.
In male WT mice, stress exposure compromised trabecular bone structure in the lumbar spine. Although this loss of bone could be mechanistically linked to an increase in local bone resorption, the role of bone formation in this context is less clear. CMS did not change mineral apposition in the L3 vertebra, whereas a statistical trend toward increased bone formation rates was noted following stress exposure in WT animals. Although these data indicate an activation of osteoblasts along the bone surface in CMS-treated males, the concurrent rise in bone resorption likely outpaces any rise in bone formation, ultimately leading to bone loss. Interestingly, this mechanism did not seem to apply to tibial trabecular bone where chronic stress exposure had no significant effect on structural or cellular parameters. In contrast to trabecular bone, the cortical compartment was clearly affected by chronic stress in male mice. Micro-CT analysis suggested a loss of endocortical bone formation and/or increase in bone resorption as the underlying reason for reduced cortical thickness. Correspondingly, the histomorphometric analysis of the cortical site clearly showed an increase of bone resorption at the endocortex of stressed male mice, whereas the endocortical bone formation markers remained unchanged. Interestingly, a lack of pericortical bone formation was detected in stress-exposed males via dynamic histomorphometry. This stress-induced change remained undetected in the micro-CT analysis. This apparent contradiction may be explained by a late onset of the pericortical reduction of bone formation in stress-exposed males. Thus, the reduction in pericortical bone formation was detectable on the cellular level (dynamic histomorphometry) but had not yet caused significant structural deficiencies in the skeleton (which would be detectable via micro-CT analysis). Although the effects of chronic stress in the skeleton of male mice were site-specific, overall bone formation was suppressed following stress exposure, as evidenced by a reduction in osteocalcin serum concentrations.
Although the use of young adult mice is a limitation of the present study, utilizing this particular model enabled us to make direct comparisons with a previous dataset. In a previous study utilizing the same mouse model (at the same age and treatment duration) we established that the skeletal actions of exogenous glucocorticoids are not only site-specific, but that glucocorticoid signaling in osteoblasts also mediates an increase in osteoclast activity and bone resorption (18). Similarly, in the present study, an increase in bone resorption was observed predominantly in WT mice, as evidenced by a rise in serum TRAP5b levels and increased osteoclast surfaces in the L3 vertebra and at the endocortex following stress exposure. Because the activation of bone resorption was largely absent in HSD2OB-tg mice, we conclude that bone resorption was increased in a predominantly osteoblast- and osteocyte-dependent fashion. In this context, the moderate increase in TRAP5b serum concentrations in HSD2OB-tg mice following stress exposure may reflect the direct activation of osteoclasts by glucocorticoids. Mechanistically, the osteoblast-mediated activation of bone resorption could potentially be mediated via an altered expression pattern of RankL and/or Opg. However, whereas RankL gene expression shows a trend increase in WT mice following stress exposure, the RankL/Opg ratio was found unaltered by stress exposure in both WT and HSD2OB-tg mice. Interestingly, HSD2OB-tg mice showed an overall lower RankL/Opg ratio compared with WT mice, independent of CMS. The overall lower RankL/Opg ratio in HSD2OB-tg mice may have contributed to the preservation of bone mass in these animals. In summary, the skeletal effects of CMS are mediated to a large extent via glucocorticoid signaling in osteoblasts and osteocytes.
The mechanisms underlying the response of osteoblasts, osteocytes, and osteoclasts to chronic stress exposure is likely influenced by a variety of factors. A contributing factor to the diverse effects of chronic stress on the skeleton may be the concurrent activation of the sympathetic nervous system and an increase in sympathetic signaling in the skeleton (7, 31). Activation of sympathetic nerve fibers in bone has been shown to reduce bone formation and bone mass in rodents (32). Hence, the interplay between an increase in sympathetic and glucocorticoid signaling may well contribute to the phenotype observed in stress-exposed WT mice. The present study demonstrates that by selectively blocking glucocorticoid signaling in osteoblasts and osteocytes the negative effects of chronic stress on bone can be prevented entirely. Interestingly, Yirmiya et al. (7) demonstrated that by blocking sympathetic signaling during chronic stress, bone loss was also prevented. These seemingly contradicting results could be united if increased glucocorticoid and sympathetic signaling in the skeleton were to act synergistically to the overall detriment of bone. Indeed, Ma et al. (33) demonstrated that β-adrenergic signaling in osteoblasts exacerbates the catabolic effect of supraphysiological glucocorticoid concentrations. However, the interplay between sympathetic and glucocorticoid signals in the context of CMS has to be treated with caution, as direct proof of this mechanism in the CMS model is currently lacking. Other factors, which may contribute to stress-induced bone loss, particularly in light of the observed site specificity, are stress-related variations in diet and exercise. Both of these factors are known to elicit site-specific effects throughout the skeleton (34, 35). In a subgroup analysis of the present study, food intake between stressed and nonstressed mice remained unchanged (data not shown), thus ruling out diet as a mediator of stress-induced bone loss. Any underlying effects of exercise in stressed and nonstressed animals remain obscure in the present study, as voluntary movements of the mice in their cages were not examined.
Exposure to CMS induced the skeletal expression of Sost in WT but not in HSD2OB-tg mice. The rise in Sost expression is a possible contributor to the overall suppression of osteoblast activity (as determined by serum osteocalcin) in WT mice. Disruption of glucocorticoid signaling in HSD2OB-tg mice prevented the induction in Sost expression, thus underscoring the importance of glucocorticoids in mediating the detrimental effects of CMS. Additionally, sclerostin has recently been highlighted as a potential inductor of osteoclast activity and bone resorption (36). In the context of excessive glucocorticoid signaling, Sato et al. (37) reported that sclerostin-induced bone resorption may be an important contributor to glucocorticoid-induced osteoporosis. A similar mechanism may in fact play a role in relaying the effects of CMS on bone resorption in the present study. Interestingly, the disruption of glucocorticoid signaling in osteoblasts and osteocytes is sufficient to prevent the CMS-induced bone loss, highlighting the important contribution of glucocorticoid signaling to the overall bone phenotype.
Taken together, these results indicate that during chronic stress exposure elevated levels of glucocorticoids increase osteoclast activity likely via amplified expression of Sost/sclerostin.
Following stress exposure, bone loss was readily observed in male animals, whereas female mice were found to be largely resistant to the skeletal effects of CMS. To our best knowledge, this is the first study to characterize the skeletal phenotype of CMS in female rodents. Of note, serum CS concentrations were similarly elevated in stressed male and female mice. There is evidence that in female mice some glucocorticoid effects, such as an increase in lipid deposition in the liver, are attenuated by ovarian steroids, most likely estradiol (38). Also, the immunosuppressive effects of glucocorticoids in rats are diminished in females compared with their male counterparts, an effect that is partially reversed following ovariectomy (39). We recently made similar observations regarding the dysmetabolic and adipogenic effects of exogenous glucocorticoids, which were less pronounced or even absent in female compared with male mice (40). Hence, gonadal steroids may interfere with glucocorticoid signaling at the receptor and/or postreceptor level (22), thereby rendering female rodents more resilient toward the effects of excess glucocorticoids. Although the mechanism underlying the resilience of female mice to stress-induced bone loss remains obscure and warrants further investigation, the present study clearly demonstrates a sex-specific skeletal response to CMS.
Taken together, our data highlight the importance of systemically elevated glucocorticoid concentrations during CMS in mice. In male mice, enhanced glucocorticoid signaling in osteoblasts and osteocytes is not only a significant contributor but a prerequisite to stress-induced bone loss.
Abbreviations:
- ANOVA
analysis of variance
- CMS
chronic mild stress
- CS
corticosterone
- DHEA
dehydroepiandrosterone
- HSD2
11β-hydroxysteroid-dehydrogenase type 2
- micro-CT
microcomputed tomography
- SD
standard deviation
- tg
transgenic
- WT
wild-type.
Acknowledgments
The HSD2OB-tg mice were a gift from Prof. Barbara Kream (University of Connecticut, Farmington, CT). The authors acknowledge the facilities and the scientific and technical assistance of the Australian Microscopy and Microanalysis Research Facility at the Australian Centre for Microscopy and Microanalysis at the University of Sydney. We thank Julian Kelly for technical assistance with histomorphometry, and Dr. Reena Desai for steroid hormone measurements.
This work was supported by NHMRC Project Grants 402462, 632819, and APP1086100 (to H.Z and M.J.S.). Scholarship support was received via Australian postgraduate award scholarships (to H.H., S.J.G., and S.K.) and by the China scholarship council (to J.L.).
Disclosure Summary: The authors have nothing to disclose.
References
Author notes
These authors contributed equally to this study.
Address all correspondence and requests for reprints to: Hong Zhou, MD, PhD, Bone Research Program, ANZAC Research Institute, University of Sydney, Gate 3, Hospital Road, Concord, Sydney, New South Wales 2139, Australia. E-mail: [email protected].
