


Abstract
Low vitamin D status potentiates experimental colitis, but the vitamin D–responsive cell in colitis has not been defined. We hypothesized that vitamin D has distinct roles in colonic epithelial cells and in nonepithelial cells during colitis. We tested this hypothesis by using mice with vitamin D receptor (VDR) deletion from colon epithelial cells (CEC-VDRKO) or nonintestinal epithelial cells (NEC-VDRKO). Eight-week-old mice were treated with 1.35% dextran sulfate sodium (DSS) for 5 days and then euthanized 2 or 10 days after removal of DSS. DSS induced body weight loss and increased disease activity index and spleen size. This response was increased in NEC-VDRKO mice but not CEC-VDRKO mice. DSS-induced colon epithelial damage and immune cell infiltration scores were increased in both mouse models. Although the epithelium healed between 2 and 10 days after DSS administration in control and CEC-VDRKO mice, epithelial damage remained high in NEC-VDRKO mice 10 days after removal of DSS, indicating delayed epithelial healing. Gene expression levels for the proinflammatory, M1 macrophage (Mɸ) cytokines tumor necrosis factor-α, nitric oxide synthase 2, and interleukin-1β were significantly elevated in the colon of NEC-VDRKO mice at day 10. In vitro experiments in murine peritoneal Mɸs demonstrated that 1,25 dihydroxyvitamin D directly inhibited M1 polarization, facilitated M2 polarization, and regulated Mɸ phenotype switching toward the M2 and away from the M1 phenotype. Our data revealed unique protective roles for vitamin D signaling during colitis in the colon epithelium as well as nonepithelial cells in the colon microenvironment (i.e., modulation of Mɸ biology).
Intestinal epithelial cells and immune cells play crucial but distinct roles in maintaining intestine tissue homeostasis and preventing inflammatory bowel disease (IBD) (1). Epithelial cells form the physical barrier that prevents infiltration of luminal bacteria into the body and systemic exposure to foreign antigens. As a result, impaired barrier function triggers a local immune response and induces chronic inflammation in the gut (2). Immune cells are needed to maintain immune tolerance, defend against infection, and facilitate immune resolution and mucosa healing during colitis (3). Disturbing either cell compartment increases the risk for IBD. Epidemiologic studies have shown that low vitamin D status is associated with increased IBD risk, and several small clinical studies have reported that vitamin D supplementation significantly improves human IBD outcomes (4). Similarly, in experimental colitis models, low vitamin D intake or disrupted vitamin D signaling increased the severity of colon damage, inflammation, and systemic colitis disease activity in mice (5).
The biological function of vitamin D depends on 1,25 dihydroxyvitamin D [1,25(OH)2D], the active hormonal form that binds to the vitamin D receptor (VDR) and regulates gene transcription (6). VDR is expressed in both intestinal epithelial cells and immune cells, and thus the inhibitory effects of vitamin D on IBD may be through one or both of these cell compartments. Previous studies showed that vitamin D signaling regulates intestinal epithelial cell function, which maintains epithelial cell tight junction protein expression and localization and prevents cytokine-induced epithelial cell apoptosis (7, 8). However, 1,25(OH)2D also has immune-suppressive effects on a diverse group of immune cells (9).
In this study we used two animal models to test the independent roles of VDR-dependent signaling in colon epithelial cells and nonepithelial cells in the intestinal response to dextran sulfate sodium (DSS), an agent that induces a form of IBD that closely resembles human ulcerative colitis (10). Our data showed that VDR deletion in either cell compartment potentiated DSS-induced colitis, but the effect of VDR deletion from each compartment was distinct. Only DSS-exposed mice with VDR deletion in nonepithelial cells had the delayed epithelial healing as well as the induced robust systemic effect that is typical of vitamin D–deficient, DSS-treated mice. In addition, we found VDR loss in the nonepithelial compartment increased the colonic expression of M1 macrophage (Mɸ) markers in vivo and that 1,25(OH)2D treatment can modulate the polarization of Mɸs in vitro.
Materials and Methods
Animal models and breeding
All breeding colonies were maintained on the C57Bl/6J background. C57BL6/J wild-type breeders were purchased from Jackson Laboratory (Bar Harbor, ME) and were also used to generate experimental mice for the peritoneal Mɸ cell culture experiments. Breeding mice were housed individually, given a standard chow diet and water ad libitum, and exposed to a 12-hour light/12-hour dark cycle. All mouse experiments were approved by the Purdue Animal Care and Use Committee.
C57BL/6-Tg(Car1-cre)5Flt (CAC) mice were previously generated and characterized by our laboratory (11, 12) and are available at Jackson Laboratories. CAC mice have a Cre-recombinase (Cre) transgene whose expression is limited to large intestine epithelial cells and is induced by DSS colitis, leading to sustained gene inactivation after healing (11, 12). This feature makes the CAC/DSS model uniquely suited for studying the function of genes in the healing of colonic epithelium following DSS-induced colitis. Rosa26R, HV2, VDRKO, and VDRflox/flox were used to generate breeders in our experiments; they have been previously described elsewhere (13–16). The HV2 mouse has a villin promoter flag–tagged human VDR transgene that is expressed in the epithelial cells throughout the intestine (17). Genotypes were determined by analyzing tail genomic DNA by standard polymerase chain reaction (PCR) methods as previously described for CAC (11), Rosa26R (13), VDR floxed (16), HV2 (17) and VDR KO (18) mice.
For the dietary vitamin D study, CACTg/WT;Rosa26Rflox/WT mice (CAC;ROSA) were generated by breeding CACTg/WT and Rosa26Rflox/flox mice (12). For study 2, on the role of colon epithelial cell VDR, experimental mice with colon epithelial cell–specific VDR inactivation (CACTg/WT;Rosa26Rflox/WT;VDRflox/flox or CEC-VDRKO) were generated by breeding CACTg/WT;Rosa26Rflox/flox;VDRflox/flox and VDRflox/flox mice. CACWT/WT;Rosa26Rflox/WT;VDRflox/flox littermates were used as controls. This is the first study to specifically target VDR deletion to the colonic epithelium. In the final animal study, we used transgenic mice with villin promoter–driven expression of hemagglutinin-tagged human VDR in the intestinal epithelium (HV2Tg/WT) (17) and crossed them to global VDR knockout mice (VDR KO) (19) to generate experimental mice: HV2Tg/WT; VDR−/− [i.e., nonintestinal epithelial cell–VDRKO mice, (NEC-VDRKO)] (17). These mice express VDR only in the intestinal epithelium, and this normalizes calcium metabolism in VDR KO mice (17). As a result, NEC-VDRKO mice can be used to study the noncalcemic roles of vitamin D in vivo. HV2Tg/WT; VDR+/+ mice were maintained by crossing HV2Tg/WT with C57BL6/J wild-type mice; these were used as controls.
Study design (animal studies)
A schematic for the DSS treatment protocol used for all of the experiments is presented in Fig. 1(a).
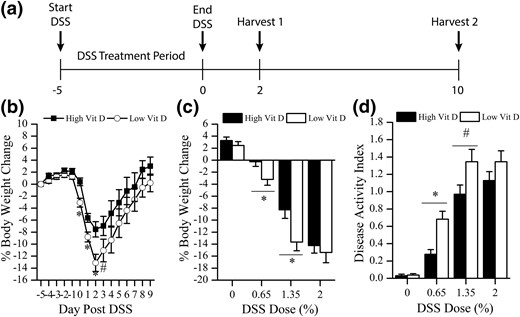
Effect of dietary vitamin D (Vit D) intake level on the gross phenotype of DSS-induced colitis in mice. (a) Schematic of the DSS treatment protocol used for all animal experiments. (b) Daily body weight change after treatment of mice with 1.35% DSS (n = 14–28 per time per group; start, −5 days; end, 0 days). (c) Percentage body weight change at day 2 after removal of DSS from mice given 0%, 0.65%, 1.35%, or 2% DSS for 5 days. (d) Disease activity index at day 2 after removal of DSS from mice given 0%, 0.65%, 1.35%, or 2% DSS for 5 days (n = 28 per group). *P < 0.05 and #P < 0.10 versus high vitamin D.
Study 1: dietary vitamin D status and DSS-induced colitis
Male and female experimental mice (CAC;ROSA) were weaned at 3 weeks of age (group housed by sex; four mice per cage) and fed AIN93G diets with 1000 IU or 0 IU added vitamin D3/kg and deionized water ad libitum (n = 112 per diet; 56 male and 56 female) (20). Mice in each diet group were randomly assigned to one of four DSS treatment groups (0%, 0.65%, 1.35%, and 2%; n = 28 per dose, balanced by sex). DSS (molecular weight, 36,000–50,000; MP Biomedicals LLC, Solon, OH) was diluted in deionized water (weight-to-volume ratio) to the appropriate concentrations. At 8 weeks of age, mice received the DSS solution in place of water ad libitum for 5 consecutive days. Afterward, DSS was replaced with deionized water, and this was provided until the scheduled day of euthanasia. Half of the mice in each DSS group were euthanized 2 days after ending the DSS treatment and half were euthanized 10 days after DSS treatment (n = 14 per diet per DSS per time point). All mice were fasted 12 hours before harvest. Body weight (BW), rectal bleeding, and fecal consistency were recorded daily from the start of DSS treatment until the scheduled day of termination. Spleen weight was recorded at necropsy.
Study 2: colon epithelial cell–specific VDR deletion and DSS-induced colitis
Sixty-four control (32 female and 32 male) and 64 CEC-VDRKO (32 female and 32 male) mice were weaned at 3 weeks of age and fed AIN93G diet containing 1000 IU vitamin D3/kg (20). At 8 weeks of age, mice were treated with vehicle (0% DSS) or 1.35% DSS dose (n = 64 per dose, balanced by genotype and sex) for 5 days, followed by deionized water until the harvest. All mice were fasted for 12 hours before their scheduled day of termination. Mice were euthanized 2 or 10 days after DSS treatment. BW, rectal bleeding, and fecal consistency were recorded daily from the start of DSS treatment until the scheduled day of termination. Spleen weight was recorded at necropsy. At each time point, tissue from half of the mice (n = 8, balanced by sex, genotype, and DSS dose) were collected, formalin fixed, embedded in paraffin, and processed for histopathologic examination as described below. Tissue from the other half of the animals (n = 8) were flash frozen in liquid nitrogen for gene expression endpoints.
Study 3: NEC-VDRKO and DSS-induced colitis
Sixty-four control (32 female and 32 male) and 64 NEC-VDRKO (32 female and 32 male) mice were used in this study. The study design was the same as described for study 2.
Live phase observation: daily BW loss and disease activity index
Rectal bleeding, fecal consistency, and BW were evaluated daily from the start of DSS treatment (day −5) until the scheduled termination day. Each mouse was assigned a daily disease activity index (DAI) score that was calculated as the average value of BW, rectal bleeding, and fecal consistency scores (21). BW loss score of 0 indicated less than 1.0% weight loss from the baseline BW on the day starting DSS; a score of 1, 1.0% to 4.9% loss; a score of 2, 5.0% to 9.9% loss; a score of 3, 10% to 20% loss; a score of 4, greater than 20% loss. A rectal bleeding score of 0 indicated normal-color feces; a score of 2, red to dark red-brown feces, with no perianal blood staining or blood spots in the cage bedding; a score of 4, perianal blood staining and/or blood spots in the cage bedding. A fecal consistency score of 0 indicated normally formed feces; a score of 2, loosely formed feces that do not stick to the anus; a score of 4, feces that fail to form a pellet and/or presence of perianal fecal staining.
Necropsy
Mice were weighed and then anesthetized with ketamine/xylazine (2 and 0.2 mg/g, respectively). Blood was collected by cardiac venipuncture and used to prepare serum. The Spleen and large intestine were carefully dissected and removed. The spleen was weighed and the colon length was measured. The colon was cut open along its mesenteric border from the anus to cecum. The mucosa was carefully rinsed with cold phosphate-buffered saline.
Serum metabolite assays
For the diet vitamin D study, serum concentrations of 25-hydroxyvitamin D [25(OH)D] (n = 16 to 19 per group) and 1,25(OH)2D (n = 4 to 8 per group) were determined by using commercial radioimmunoassays (Immunodiagnostic Systems, Scottsdale, AZ) as per the manufacturer’s instructions: 25(OH)D [at 57 nmol/L: intra-assay coefficient of variation (CV), 5%; interassay CV, 8.1%] and 1,25(OH)2D (at 46 pmol/L: intra-assay CV, 8.8%; interassay CV, 13%). Total serum calcium (n = 8 to 10 per diet and DSS group) was determined by using a QuantiChrom Calcium Assay Kit (BioAssay Systems, Hayward, CA) per the manufacturer’s instructions.
Formalin-fixed, paraffin-embedded tissue collection
For both studies on genetically modified mice, the colon was transected at its midpoint to separate the proximal and distal segments. Each segment was then split longitudinally and Swiss-rolled, resulting in two rolls each of proximal colon and distal segments per mouse. The spleen was cut along its longest axis before fixation. Tissues were immersion fixed for 48 hours in 10% neutral buffered formalin at 4°C before being transferred to 70% ethanol. Tissues were routinely processed and embedded in paraffin within 7 days of collection at the Purdue Histology and Phenotyping Laboratory.
Histologic and image analyses
Paraffin-embedded spleen and colon segments were sectioned (4 µm) and sections were stained with hematoxylin and eosin. The sections were deidentified, then evaluated by one author (F.W.) under the supervision of a board-certified veterinary pathologist (P.W.S.). Quantitative morphology of colon was performed by using ImageScope software (Aperio, Vista, CA). Scores were assigned to the distal colon for extent of mucosal damage and immune cell infiltration by using criterion summarized in Table 1.
Components of Histologic Grading Scheme for Colon Damage and Inflammation
| Score | Description |
|---|---|
| Colon epithelial damage score | |
| 0 | No mucosal damage |
| 1 | 1%–25% of mucosa ulcerated or healing |
| 2 | 26%–50% of mucosa ulcerated or healing |
| 3 | 51%–75% of mucosa ulcerated or healing |
| 4 | >75% of mucosa ulcerated or healing |
| Colon inflammation score | |
| 0 | No inflammation |
| 1 | Mild increase in lamina propria leukocytes |
| 2 | Moderate increase in lamia propria and submucosal leukocytes |
| 3 | Submucosal edema and moderate to marked increase in lamina propria and submucosal leukocytes |
| 4 | Extension of leukocytes into tunica muscularis and/or mild serositis |
| 5 | Extension of leukocytes through tunica muscularis with severe serositis |
Spleen hematoxylin and eosin–stained images were taken from a white light microscope (Leica, Wetzlar, Germany) at ×32 magnification; when necessary, multiple images of the same spleen were joined by using Photoshop CS3 (Adobe Inc. Total area and white pulp area per spleen were measured by using ImageJ software (National Institutes of Health, Bethesda, MD). Red pulp area was calculated by subtracting the white pulp area from the total area. The percentage red pulp was calculated by dividing red pulp area by the total area.
Reagents for Mɸ culture experiments
Mɸ culture medium was composed of 45% RPMI 1640 (Sigma-Aldrich, St. Louis, MO), 45% high-glucose Dulbecco’s modified Eagle medium (ThermoFisher, Waltham, MA), 10% fetal bovine serum (FBS; Lonza, Williamsport, PA), 100 U/mL penicillin–streptomycin (Invitrogen), 2 mM l-glutamine (Life Technology, Carlsbad, CA), and 20 ng/mL murine macrophage colony-stimulating factor (R&D Systems, Minneapolis, MN). The culture medium was prepared within 1 week before use and stored at 4°C.
1,25(OH)2D was purchased from Enzo Life Science (Farmingdale, NY). 1,25(OH)2D stock was prepared in 100% ethanol to a concentration of 10−3 M and stored in the dark at −80°C. Lipopolysaccharide (LPS) was purchased from Sigma-Aldrich (#L4391; St. Louis, MO). LPS stock was prepared in RPMI 1640 supplemented with 10% FBS to a concentration of 1 mg/mL and stored at −80°C. Recombinant murine interferon (IFN)-γ and interleukin (IL)-4 were purchased from Peprotech (Rocky Hill, NJ). Stocks of each cytokine were prepared at 20 μg/mL in RPMI 1640 supplemented with 10% FBS and stored at −80°C. Working stocks were made by diluting stocks into Mɸ culture medium and they were stored at 4°C for 1 to 7 days before use.
Peritoneal cell isolation and culture
Peritoneal Mɸs (M0) were harvested from 6- to 8-week-old C57BL6/J mice (male and female) and cultured according to published procedures, with the following modification (22). Mice were killed with CO2, and the peritoneal cavity cells were immediately collected by lavage using 5 mL cold RPMI 1640 per mouse. Each mouse yielded 2 to 4 million peritoneal cells, and the cells from six to eight mice were pooled for each replicate of the experiments. Each experiment was repeated three times.
Cells were stored on ice throughout the harvest and cell preparation procedures. Isolated peritoneal cavity cells were centrifuged (400g for 10 minutes at 4°C) and suspended into Mɸ culture medium (22). Viable cell number was determined by assessing trypan blue exclusion. Peritoneal cavity cells were diluted to a concentration of 4 million/mL in the Mɸ culture medium. Cell suspensions were seeded into 24-well (500 μL/well) or 48-well (250 μL/well) cell culture plates. After 2 to 4 hours of incubation (37°C, 5% CO2), floating cells were removed with three washes of 37°C RPMI 1640. Flow cytometric analysis was done to test the purity of the adherent cells, as previously described (22) and more than 90% of the cells were F4/80 and CD11b double-positive peritoneal Mɸs (M0) (data not shown). The purified Mɸs were allowed to rest for 1 hour before initiation of treatments to induce polarization.
Mɸ polarization and phenotype switching
In vitro M0 polarization was done according to published procedures (22). Five experiments were conducted to assess the effect of 1,25(OH)2D on M0 polarization and phenotype switching. Experiment 1 tested the effect of 1,25(OH)2D alone on M0 polarization. M0 cells were treated with 0, 0.1, 1, or 10 nM 1,25(OH)2D, and after 6-hour incubation, cells were harvested for messenger RNA (mRNA) analysis. Experiment 2 tested the effect of 1,25(OH)2D on M1 polarization. M0 cells were polarized to the M1 phenotype by adding 20 ng/mL IFN-γ for 1 hour, followed by 5-hour cotreatment with 20 ng/mL IFN-γ + 1 μg/mL LPS. This polarization was conducted in the presence or absence of 1,25(OH)2D (0, 0.1, 1, or 10 nM) for 6 hours; afterward, cells were harvested for mRNA analysis. Experiment 3 tested the effect of 1,25(OH)2D on M2 polarization. M0 cells were polarized to the M2 phenotype by treating cells with 20 ng/mL IL-4 for 6 hours in the presence or absence of 1,25(OH)2D (0, 0.1, 1, or 10 nM), after which cells were harvested for mRNA analysis.
Experiment 4 tested the effect of 1,25(OH)2D on the M1 to M2 phenotype switch. Isolated peritoneal Mɸs were maintained as M0 or polarized to M1 phenotype for 6 hours, as described above. To induce a phenotype switch, polarized M1 Mɸs were washed three times with RPMI 1640, after which they were treated with Mɸ culture medium containing 20 ng/mL IL-4 (M1 to M2 switch) with or without 10 nM 1,25(OH)2D for an additional 6 hours. The M1 to M2 switch was evaluated by using the Arg1/nitric oxide synthase 2 (NOS2) expression ratio. Experiment 5 tested the effect of 1,25(OH)2D on the M2 to M1 phenotype switch. Mɸs were maintained as M0 or polarized to M2 phenotype for 6 hours. Afterward, M2 polarized cells were washed three times with 37°C RPMI 1640, then incubated in Mɸ culture medium containing 20 ng/mL IFN-γ for 1 hour, followed by cotreatment with LPS for 5 hours in the presence or absence of 10 nM 1,25(OH)2D. Cells were harvested for analysis of mRNA levels. The M2 to M1 switch was evaluated by using the NOS2/Arg1 expression ratio.
At the end of each experiment, Mɸs were washed three times with 37°C RPMI 1640 and directly harvested into TRI Reagent (Sigma-Aldrich), snap-frozen in liquid nitrogen, and stored at −80°C until use. NOS2 and Arg1 gene expression levels were used to confirm M1 and M2 polarization, respectively. In each experiment, four analytical replicates of pooled cells were used. Each experiment was repeated three times.
Gene expression
Colonic RNA was isolated from whole colon tissue (study 2 in CEC-VDRKO mice) or a colonic mucosa scraping (study 3 in NEC-VDRKO mice) by using the Qiagen RNeasy kit. Mɸ RNA was isolated by using Direct-zol RNA kits from Zymo Research (Irvine, CA). Purified RNA was reverse transcribed to make complementary DNA (0.5 μg of RNA in a 10-μL reaction with the following reagents: 10 U/μL M-MLV reverse transcription (Invitrogen); 50 μg/mL bovine serum albumin (Invitrogen, Carlsbad, CA); 0.6 U/μL RNAsin (Promega); 0.005 μg/μL oligo-dT (Invitrogen); 0.005 μg/μL random hexamers (Invitrogen); and 0.05 mmol/L each of deoxynucleotide triphosphates (Promega, Madison, WI), incubated at 37°C for 1 hour, diluted to 100 μL total volume with autoclaved, distilled deionized water. Real-time PCR was used to analyze complementary DNA for specific messages. Primer/probe sets were from Integrated DNA Technologies (IDT, Coralville, IA): tumor necrosis factor (TNF)-α (IDT assay ID: Mm.TP.58.12575861), NOS2 (Mm.PT.56a.43705194), Arg1 (Mm.PT.58.8651372), CCL2 (Mm.PT.58.42151692), and IL-1β (Mm.PT.58.41616450) gene expression; 18s ribosomal RNA (RNA18S, Hs.PT.39a.22214856) was used as a housekeeping gene. PCR was conducted by using the iQ Supermix (Bio-Rad, Hercules, CA) and 10 pmol of each primer/probe with the following cycling conditions: 95°C for 3 minutes and then 40 cycles at 95°C for 15 seconds, 60°C for 30 seconds, and 72°C for 30 seconds. Relative expression levels were determined by using the delta delta Ct method (23).
Statistical analysis
Data were analyzed using SAS enterprise 5.1 software (SAS Institute, Cary, NC). Evaluation of histograms and the Shapiro–Wilk test of normality (P > 0.05) were used to determine whether data were normally distributed. Percentage BW loss, serum metabolites, and spleen weight were normally distributed and analyzed by two-way analysis of variance (ANOVA) for the effects of genotype, DSS dose, and their interaction. Colonic gene expression values were not normally distributed and required log10 transformation before analysis by two-way ANOVA. Multiple comparisons were done with the Tukey honest significant difference test. DAI and histologic scores were analyzed by Kruskal–Wallis nonparametric ANOVA. Spleen red pulp enlargement data were analyzed by Student t test. The study groups were balanced for sex but not statistically powered to identify sex-specific effects. As a result, sex was considered as a covariate in each analysis. Cell culture data were analyzed by one-way ANOVA, followed by the Fisher least significant difference test. All data are reported as mean ± standard error of the mean, and the differences were considered significant at P < 0.05, with a trend being defined as P < 0.10.
Results
Low vitamin D intake caused more severe colitis in mice
In the dietary vitamin D study, feeding CAC;ROSA mice a vitamin D–deficient diet significantly reduced serum 25(OH)D level compared with mice fed the 1000 IU/kg vitamin D diet [16.86 ± 0.62 nmol/L (n = 17) versus 175.45 ± 11.80 nmol/L (n = 16); P < 0.001]. Serum Ca levels were reduced in the low vitamin D group but the difference was not statistically significant (9.59 ± 0.29 mg/dL in low vitamin D group versus10.87 ± 0.19 mg/dL in high vitamin D group; n = 16 per group). Dietary vitamin D intake level did not influence BW (data not shown).
DSS treatment induced BW loss and increased the DAI in a dose-dependent manner, with the most severe BW response seen at day 2 after DSS [Fig. 1(b)]. DSS-induced mortality was low but increased in the higher DSS dose groups (0.65% DSS, 0 of 28; 1.35% DSS, 1 of 28; 2% DSS, 3 of 28). Sex did not influence DSS-induced BW loss in the high or low vitamin D group (P = 0.1853 or 0.1136, data not shown). Low vitamin D intake increased the severity of BW loss and DAI in mice treated with 0.65% and 1.35% DSS, whereas the vitamin D effect was masked at the 2% DSS dose [Fig. 1(c) and 1(d)]. Spleen weight as a percentage of BW was increased by DSS treatment in a dose-dependent manner (0% DSS, 0.36% ± 0.01%; 0.65% DSS, 0.39% ± 0.02%; 1.35% DSS, 0.53% ± 0.02%; 2% DSS, 0.63% ± 0.04%; P < 0.0001). In addition, mice fed the low vitamin D diet had significantly increased spleen weight relative to controls at the 1.35% DSS dose (24% higher; P = 0.03). On the basis of these results, we used 1.35% DSS for all subsequent experiments.
Nonepithelial cell VDR deletion, but not colon epithelial cell VDR deletion, increased DSS-induced BW loss, DAI, and spleen response in mice
In both study 2 (using CEC-VDRKO mice) and 3 (using NEC-VDRKO mice), BW and DAI were stable in vehicle-treated mice (data not shown), whereas DSS treatment significantly induced BW loss and increased DAI regardless of genotype (Fig. 2). In study 2, in which VDR deletion was limited to the colonic epithelium, neither DSS-induced BW loss nor DAI was altered in CEC-VDRKO mice compared with control mice [Fig. 2(a) and 2(b)]. In study 3 (using NEC-VDRKO mice), the maximum BW loss was 6.7% ± 1.5% at 2 days after DSS and recovered by day 5 after DSS in control mice with intestine epithelium–specific transgenic expression of human VDR [Fig. 2(c)]. In contrast, the NEC-VDRKO mice had more extreme BW loss (10.3% ± 2.1%), and their BW was not completely recovered at 10 days after DSS [Fig. 2(c)]. In addition, the DAI of NEC-VDRKO mice was also significantly higher than that of the controls from day −2 (3 days of DSS treatment) until the end of the study [Fig. 2(d)]. Spleen enlargement is a common feature of DSS-induced colitis; spleen size in the control group for both mouse models increased by 40% by 10 days after DSS. A similar 40% increase in spleen weight was seen in CEC-VDRKO mice. However, spleen enlargement after DSS treatment was 46% greater in NEC-VDRKO mice than in the control mice (P < 0.01). The increase in spleen weight in DSS-treated NEC-VDRKO mice was due to an expansion of the red pulp area (22.7% ± 5.8% enlargement in controls versus 35.1% ± 2.4% enlargement in NEC-VDRKO mice; P < 0.05). This could reflect increased splenic accumulation of monocytes/Mɸs or extramedullary hematopoiesis (24).
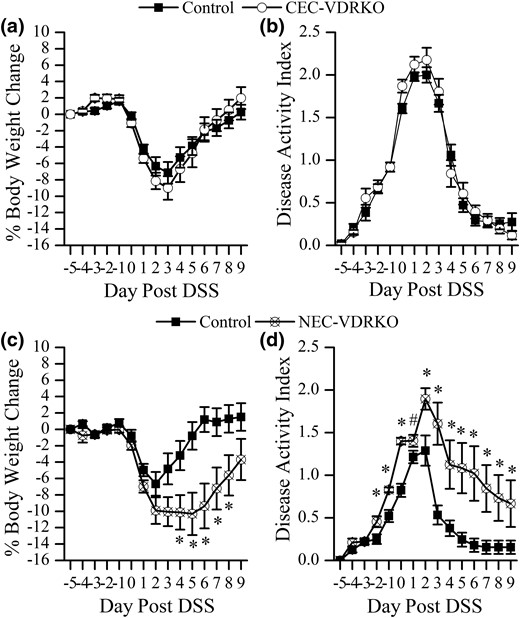
Effect of VDR deletion from colon epithelial cells (CEC-VDRKO) or nonepithelial cells (NEC-VDRKO) on the gross phenotype of DSS-induced colitis in mice. (a) Daily body weight change and (b) DAI of control and CEC-VDRKO mice treated with 1.35% DSS. (c) Daily BW change and (d) DAI of control and NEC-VDRKO mice treated with 1.35% DSS (n = 16 to 32 per time per group). *P < 0.05 and # P < 0.10 versus control.
Histologic features of colitis were exacerbated in mice with nonepithelial or epithelial cell–specific VDR deletion
In the CEC-VDRKO mouse study, DSS treatment caused colonic mucosal damage in the proximal and distal colon of all experimental mice, and this epithelial damage was more severe in the distal colon of CEC-VDRKO mice at both 2 days (P = 0.0013 versus control) and 10 days (P = 0.0283 versus control) after DSS [Fig. 3(a)]. Similar results were observed in NEC-VDRKO mice, which had more severe DSS-induced distal colonic damage than the control mice at both time points (day 2, P = 0.0794; day 10, P = 0.0155) [Fig. 3(b)]. This suggests that VDR in both colon epithelial cells and nonepithelial cells protects against DSS-induced tissue damage in the distal colon. In contrast, DSS-induced damage to the proximal colon in CEC-VDRKO and NEC-VDRKO mice were not different from that in their respective controls, suggesting an anatomic site–specific response to DSS. As a result, all subsequent analyses we conducted were limited to the distal colon. In CEC-VDRKO mice, the colon damage scores fell significantly from 2 to 10 days after DSS was removed (P = 0.0037) [Fig. 3(a)]. In contrast, the damage score of NEC-VDRKO mice was high at 2 days after DSS and remained high at 10 days after DSS [Fig. 3(b)]. This suggests that the loss of VDR in nonepithelial cells delays epithelial healing after DSS-induced colitis.
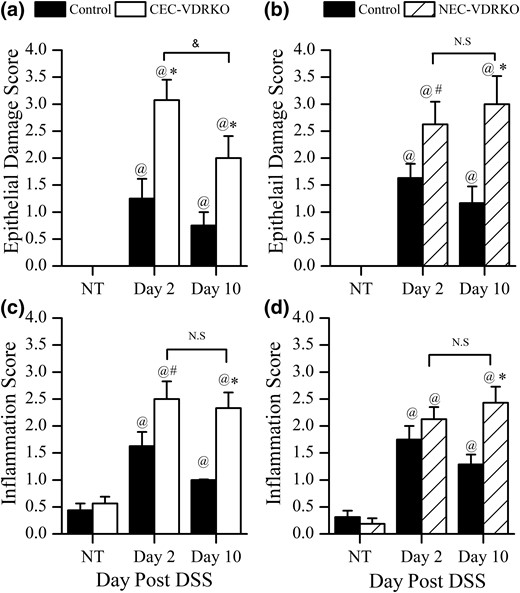
Histologic evaluation of the distal colon at 2 or 10 day after completion of a 5-day treatment with 1.35% DSS. Colon epithelial damage score in (a) control and CEC-VDRKO mice (n = 8 per group) (@P < 0.05 versus NT; *P < 0.05 versus control; &P < 0.05 versus day 2) or (b) control and NEC-VDRKO mice (n = 8 per group) (@P < 0.05 versus NT; *P < 0.05 and #P < 0.10 versus control). Colon inflammation score in (c) control and CEC-VDRKO mice (n = 8 per group) (@P < 0.05 versus NT; *P < 0.05 and #P < 0.10 versus control) and (d) control and NEC-VDRKO mice (n = 8 per group) (@P < 0.05 versus NT; *P < 0.05 versus control). NS, not significant.
DSS treatment increased colonic immune cell infiltration in both studies on genetically modified mice [Fig. 3(c) and 3(d)]. In study 2 (using CEC-VDRKO mice), distal colon inflammation scores were higher in CEC-VDRKO mice than controls at both 2 days (P = 0.0605) and 10 days (P = 0.0036) after DSS [Fig. 3(c)]. In contrast to the colonic damage scores in CEC-VDRKO mice, inflammation scores did not fall between 2 and 10 days after DSS [Fig. 3(a)]. In study 3, NEC-VDRKO mice had significantly higher colon inflammation scores than controls at 10 days (P = 0.0142), and the score did not decline from 2 d to 10 d [Fig. 3(d)].
M1 Mɸ cytokine mRNA levels were elevated in colon of mice lacking VDR in nonepithelial cells
Others have reported that Mɸ phenotypes influence colon mucosa healing after DSS treatment (i.e., M1 cells contribute to mucosa injury and M2 cells promote mucosa healing [25, 26]). We hypothesized that the delayed healing of the distal colon epithelium and the systemic phenotype we observed in NEC-VDRKO mice reflected an enhanced M1 cell response. To test this hypothesis, we measured the colonic M1 cell cytokine mRNA profile in both of the studies using genetically modified mice. In the CEC-VDRKO mouse study, colonic TNF-α (twofold), NOS2 (5.8-fold), and IL-1β (fourfold) mRNA levels were elevated at 10 days after removal of DSS in control mice, but when we compared DSS-treated control and CEC-VDRKO mice, no significant difference was found between these groups even though values were elevated by 1.47-, 2.4-, and 5.1-fold for TNF-α, NOS2, and IL-1β, respectively [Fig. 4(a)–4(c)]. In the NEC-VDRKO mouse study, TNF-α (twofold), NOS2 (8.4-fold), and IL-1β (7.2-fold) expression levels were significantly elevated at 10 d after DSS treatment, but this response was significantly greater in NEC-VDRKO mice compared with the controls (TNF-α, 49-fold; NOS2, 176-fold; and IL-1β, 370-fold [Fig. 4(d)–4(f)]. We also measured IL-12p40 (Th1 polarization) and IFN-γ (Th1 activation) mRNA levels in colon as indicators of a Th1 cell–related response. In the CEC-VDRKO mouse study, neither IL-12 nor IFN-γ was elevated at 10 days after DSS treatment, and no difference was observed between control and CEC-VDRKO mice (data not shown). In the NEC-VDRKO mouse study, DSS treatment did not increase IL-12p40 or IFN-γ mRNA levels in control groups, but in NEC-VDRKO mice the colonic IFN-γ mRNA level was elevated at 10 days after DSS compared with control controls (6.4 ± 2.7 versus 87.2 ± 38.9 AU; P = 0.08).
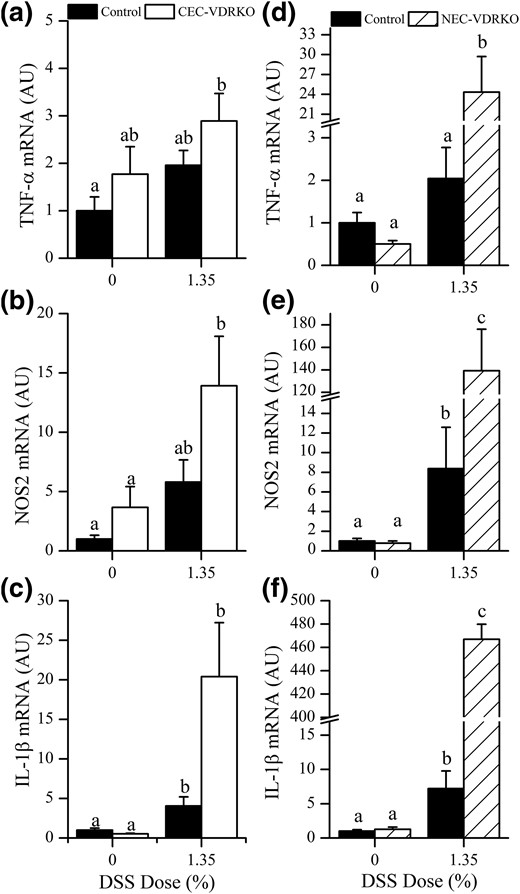
Expression of M1 Mɸ-associated mRNAs in the distal colon 10 day after removal DSS. (a) TNF-α, (b) NOS2, and (c) IL-1β mRNA levels in the colon of control and CEC-VDRKO mice. (d) TNF-α, (e) NOS2, and (f) IL-1β mRNA levels in the colon of control and NEC-VDRKO mice (n = 8 per group). Bars with different letter superscripts are significantly different at P < 0.05. AU, arbitrary units.
1,25(OH)2D directly regulates Mɸ polarization and phenotype switching
Peritoneal M0 cells isolated from C57BL/6 mice had undetectable levels of the M1 cell marker NOS2 mRNA, but treatment with IFN-γ and LPS significantly elevated NOS2 mRNA levels [Fig. 5(b)], indicating that the treatment successfully polarized M0 cells to an M1-like phenotype. Both 1 and 10 nM 1,25(OH)2D significantly suppressed induction of NOS2 mRNA by over 20% [Fig. 5(b)]. Expression of the M2 marker Arg1 mRNA was suppressed by treatment of M0 cells with IFN-γ and LPS (from 185.7 ± 53.8 to 16.7 ± 3.0 AU; P = 0.006). There was a trend toward increased expression of Arg1 mRNA at the higher 1,25(OH)2D doses (44% higher with 1 nM [P = 0.08]; 43% higher with 10 nM [P = 0.054]) and so the NOS2/Arg1 mRNA ratio was significantly suppressed by 45.6% ± 4.8% after 6 hours of cotreatment with IFN-γ, LPS, and 10 nM 1,25(OH)2D [Fig. 5(c)].
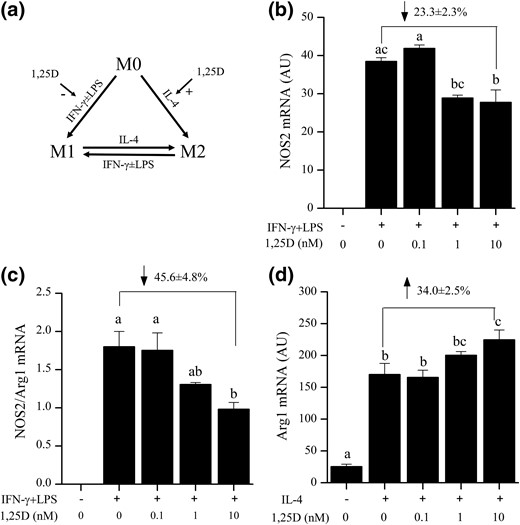
Effect of 1,25(OH)2 D on the polarization of peritoneal M0 Mɸs in to M1 and M2 subtypes. (a) Experimental model of M0 Mɸs polarization into M1 or M2 subtypes with hypothesized effects of 1,25(OH)2 D (1,25D) identified with arrows. (b) 1,25(OH)2 D (1,25D) effects on induction of NOS2 mRNA levels (a marker of M1 polarization) by IFN-γ and LPS. (c) 1,25(OH)2 D effects on the ratio of NOS2/Arg1 mRNA in peritoneal M0 Mɸs induced to polarize to the M1 subtype. (d) 1,25(OH)2 D effects on induction of Arg1 mRNA levels (a marker of M2 polarization) by IL-4. Representative data from one of three replicate experiments are shown. The overall percentage change between the 0- and 10-nM 1,25(OH)2 D groups is presented and reflects the combined data from all three replicates. (n = 3 per group). Bars with different letter superscripts are significantly different at P < 0.05.
Previous research has used 1,25(OH)2D to induce M2-like Mɸ polarization in murine bone marrow–derived Mɸs but did not test the ability of 1,25(OH)2D to induce polarization of mature primary Mɸ (M0) (27, 28). In primary murine peritoneal M0 Mɸs, Arg1 mRNA levels (an M2 marker) were increased by 36.4% ± 10.0% (P = 0.011) or 44.1% ± 6.9% (P = 0.009) after 6-hour treatment with 1 or 10 nM 1,25(OH)2D, respectively. This shows that 1,25(OH)2D alone can induce M0 Mɸ polarization to an M2-like phenotype in vitro. Treatment of M0 Mɸs with IL-4 significantly induced Arg1 mRNA (5.3-fold ± 0.7-fold) [Fig. 5(d)], confirming that the treatment induces M0 Mɸ to polarize to an M2-like phenotype. Cotreatment with 10 nM 1,25(OH)2D and IL-4 further increased Arg1 gene expression by 34.0% ± 2.5% above IL-4 alone, indicating an additive effect of 1,25(OH)2D on IL-4–induced M2-like polarization [Fig. 5(d)].
Incubating M1-like Mɸs with 20 ng/mL IL-4 for 6 hours significantly reduced NOS2 and increased Arg1 mRNA level [Fig. 6(b) and 6(c)], leading to an increased Arg1/NOS2 gene expression ratio [Fig. 6(d)] and reflective of an M1- to M2-like phenotype switch. Cotreatment with 10 nM 1,25(OH)2D and IL-4 further reduced NOS2 mRNA level by 21.8% ± 3.9% but did not significantly alter Arg1 mRNA [Fig. 6(b) and 6(c)] so that 1,25(OH)2D had a small impact on the ratio of Arg1/NOS2 [Fig. 6(d); P = 0.06]. In M2-like Mɸs, IFN-γ and LPS treatment significantly increased NOS2 mRNA and reduced Arg1 mRNA levels by 91% [Fig. 6(e) and 6(f)], resulting in a significant increase of the NOS2/Arg1 mRNA ratio [Fig. 6(g)] and reflective of an M2- to M1-like Mɸ phenotype switch. NOS2 mRNA levels were significantly lower after M2-like Mɸs were cotreated with 10 nM 1,25(OH)2D, IFN-γ, and LPS. Cotreatment also caused a nonsignificant 40% increase in Arg1 mRNA levels [Fig. 6(f)], leading to a 47.2% ± 1.2% reduction in the NOS2/Arg1 mRNA ratio [Fig. 6(g)]. This indicates that 1,25(OH)2D signaling has an inhibitory effect on the M2 to M1 phenotype switch.
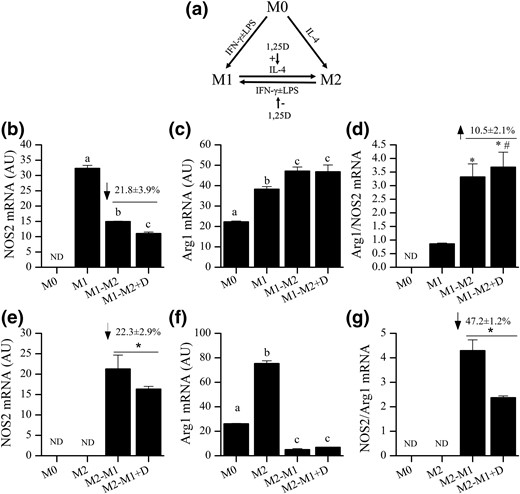
Effect of 1,25(OH)2 D on M1 and M2 phenotype switching. (a) Experimental model of M1 and M2 phenotype switching with hypothesized effects of 1,25(OH)2 D (1,25D) identified with arrows. (b–d) Effects of 1,25(OH)2 D on (b) NOS2 mRNA, (c) Arg1 mRNA, or (d) Arg1/NOS2 mRNA ratio during IL-4–mediated of M1 to M2 phenotype switching. (e–g) Effects of 1,25(OH)2 D on (e) NOS2 mRNA, (f) Arg1 mRNA, or (g) NOS2/Arg1 mRNA ratio during IFNγ + LPS–mediated M2 to M1 phenotype switching. Bars are representative data from one of three replicate experiments are shown (n = 3 replicates in each experiment). Numbers above bars in (b), (e), and (g) are the overall percentage change of the data combined from all three replicates (n = 3 experiments). In (a), (c), and (f), bars with different letter superscripts are significantly different at P < 0.05. In (d), *P < 0.05 versus M1, #P < 0.1 versus M1-M2. In (e) and (g), * P < 0.05 versus vitamin D–treated group). AU, arbitrary units.
Effects of VDR deletion on signals for monocyte migration to the inflamed colon during DSS colitis
Circulating monocytes respond to colonic inflammation and migrate to local tissues through CCL2/CCR2-dependent signaling (29). We hypothesize that blocking vitamin D signaling induces monocyte migration to the inflamed colon. As a preliminary test of this hypothesis, we examined colonic CCL2 mRNA levels in both mouse models. NEC-VDRKO mice, but not CEC-VDRKO mice, had significantly increased colonic CCL2 mRNA levels at both 10 d (Fig. 7) and 2 days after DSS treatment (2.3-fold increase in control versus 36-fold increase in NEC-VDRKO; P < 0.01). This suggests that deleting VDR from nonepithelial cells may increase monocyte migration and consequently total Mɸ number in the colon during DSS colitis.
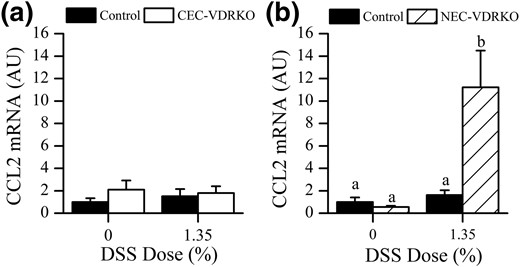
Effect of VDR deletion from colon epithelial cells (a, CEC-VDRKO) or nonepithelial cells (b, NEC-VDRKO) on colonic CCL2 mRNA levels in the distal colon 10 days after removal of DSS (n = 8 per group). Bars with different letter superscripts are significantly different at P < 0.05.
Discussion
Vitamin D is an immune regulator whose role in colitis prevention has been examined in multiple experimental models. Studies using global VDR KO mice or 1,25(OH)2D/vitamin D analog treatment show a protective role for vitamin D in colitis models that were developed to study T cell function [e.g., T cell transfer into Rag KO mice (30); IL-10 KO mice (31), trinitrobenzene sulfonic acid–induced colitis (32, 33)]. In contrast to the T cell–driven models, DSS induces colitis by disrupting the colonic epithelial barrier, which allows the infiltration of luminal bacteria to stimulate a robust innate immune response (34). Previous studies have reported that vitamin D deficiency as well as global deletion of the VDR or Cyp27b1genes increases the severity of DSS-induced colitis (35–37). Our work adds to this body of literature by differentiating between the role of vitamin D signaling in the colonic epithelium and its role in the nonepithelial cells within the colon microenvironment during DSS-induced colitis.
Others have shown that vitamin D signaling in the epithelial cell maintains colonic epithelial barrier function by regulating the expression of tight junction proteins (7, 8, 38) and inhibiting cytokine-induced epithelial cell apoptosis (25). This suggests that vitamin D signaling may prevent cell injury–induced ulceration and subsequent development of colitis. Consistent with this, mice with global (8) or intestine-epithelial cell–specific VDR deletion have increased DSS-induced BW loss, rectal bleeding, and colon injury (25, 26). Unfortunately, these studies did not use a high-calcium, high-lactose rescue diet (25, 26) and so the increased severity of colitis they observed may be an indirect effect of hypocalcemia that occurs when vitamin D–mediated intestinal calcium absorption is disrupted in these models. In contrast, intestine-specific VDR overexpression reduces BW loss, protects gut permeability, and reduces colon epithelial damage after induction of colitis with trinitrobenzene sulfonic acid, as well as reduces the clinical and histologic colitis score in mice with DSS-induced colitis (8). Collectively, these studies support a critical role for colon epithelial cell VDR in the initiation of colitis.
Our studies add to previous studies in two ways. First, the unique features of the modified carbonic anhydrase 1 promoter-Cre mouse model we used to make CEC-VDRKO mice (11, 12) allowed us to show that colon epithelial cell–specific VDR deletion at the site and time of DSS-induced ulcers does not influence colonic epithelial healing. In contrast, with previous VDR deletion and overexpression models, intestinal vitamin D signaling is affected throughout the intestinal epithelium before induction of colitis. Thus, although these studies revealed an effect of intestinal VDR on experimental colitis, they could not differentiate between the role that vitamin D signaling may play in preventing damage from the role it may play in the healing of epithelium that occurs after ulceration. By combining our findings from CEC-VDRKO mice with earlier findings from intestine-specific VDR KO and transgenic mice, we conclude that the primary role for vitamin D signaling in the colon epithelial cell during colitis is the protection of the epithelium from damage.
Second, our data show that nonepithelial cells in the colon are a critical vitamin D target during DSS colitis. Similar to what we and others have observed in mice fed a vitamin D–deficient diet (35, 36), NEC-VDRKO mice (with VDR expression in the intestinal epithelium but no VDR outside this compartment) had a more severe systemic response to DSS (i.e., BW loss, DAI, and spleen enlargement), had greater colon epithelial damage, and had increased inflammation during DSS colitis compared with the control mice. Although many cell types are VDR deficient in NEC-VDRKO mice, we believe that our data support a role for vitamin D signaling in Mɸs, a known vitamin D target cell that expresses the VDR. Our data are consistent with previous studies showing that global deletion of the VDR or Cyp27b1 increases the local expression of Mɸ-derived proinflammatory cytokines that normally accompany DSS treatment (i.e., TNF-α, IL-12, and IL-1β) (36, 37). However, in these earlier studies it was not clear whether the increase in colonic cytokine expression observed in whole-body VDR KO mice was a primary response resulting from VDR deletion in Mɸs or a secondary effect resulting from the loosening of tight junctions when VDR is deleted from colonic epithelial cells, which leads to increased damage to the colonic epithelium and elevated Mɸ infiltration. Because VDR was present in the colonic epithelium of NEC-VDRKO mice, the elevated levels of Mɸ cytokines we observed in these mice are not due to secondary effects resulting from the loss of VDR action in the epithelium. Instead, our data support the hypothesis that the increased cytokine expression/Mɸ activity is a primary consequence of the loss of vitamin D signaling in monocytes/Mɸs.
Mɸs found in the DSS-induced, inflamed colon have two independent and interchangeable phenotypes, M1 and M2 (39). M1 Mɸs produce proinflammatory mediators (e.g., TNF-α and reactive oxygen species) that stimulate the adaptive immune response and induce tissue injury, whereas M2 Mɸs have anti-inflammatory features that facilitate tissue healing (40). During DSS treatment and injury, the ratio of M1 to M2 cells increases in the colon, but after DSS is removed the ratio falls as M2 Mɸ number increases during active healing (39, 41). Two of our in vivo findings suggest that vitamin D suppresses development of an M1-like response, encourages development of a M2-like response, and thus facilitates mucosa healing during the recovery phase. First, we found that the healing of the colon epithelium between 2 and 10 days after DSS treatment was delayed in NEC-VDRKO mice, suggesting a loss of M2 Mɸ activity in the absence of VDR. Second, the colons of NEC-VDRKO mice have dramatically elevated mRNA levels of M1 markers after DSS treatment (i.e., NOS2, TNF-α, and IL-1β). These inflammatory mediators are known to induce effects that could further delay epithelial healing (i.e., colonic oxidative stress), damage colon epithelial cell tight junctions, and induce colon epithelial cell death (42).
There are many potential points where vitamin D could affect Mɸ biology. Earlier research has shown that 1,25(OH)2D treatment induces the antimicrobial proteins cathelicidin and β-defensin in human Mɸs but these genes are not vitamin D–regulated in mouse and thus do not explain our findings (43). Additional research has shown that 1,25(OH)2D treatment suppresses production of proinflammatory cytokines in a variety of Mɸ cell models (e.g., mouse P388D1 cells) (44), in human blood monocytes and U937 cells (45), and in mouse bone marrow–derived or peritoneal Mɸ (46, 47). To extend these earlier findings, we asked whether 1,25(OH)2D can directly regulate the ability of mature peritoneal M0 Mɸs to respond to polarizing signals. Consistent with earlier studies using bone marrow–derived Mɸ precursors (25), we found that 1,25(OH)2D cotreatment can dampen IFN-γ + LPS-induced polarization to the M1 subtype in primary murine peritoneal Mɸ. In addition, our in vitro study shows that 1,25(OH)2D alone can induce polarization of mature peritoneal M0 Mɸ toward the M2 phenotype. Once polarized, Mɸs can also switch phenotype classes in response to the biological demands and regulatory signals in their microenvironment. Our data are consistent with those of Zhang et al. (48), who showed that 1,25(OH)2D shifted glucose-induced polarization of RAW 264.7 cells away from M1 cells and toward M2 cells by upregulating PPARγ signaling. Our in vitro studies also showed that 1,25(OH)2D significantly reduced the ability of IL-4 polarized M2 Mɸs to switch to an M1 phenotype in response to IFN-γ + LPS treatment. Thus, our data suggest that vitamin D signaling in the microenvironment of inflamed colon acts on M0, M1, and M2 Mɸ to skew the population to an anti-inflammatory phenotype.
Although our data show that 1,25(OH)2D regulates Mɸ polarization and phenotype switching, the effect was moderate compared with the robust systemic response to DSS treatment seen in NEC-VDRKO mice. This suggests that vitamin D may alter other aspects of the monocyte/Mɸ biology during colitis. Mɸs in the inflamed colon are derived primarily from circulating monocytes (29) and vitamin D signaling can influence monocyte differentiation into Mɸs (27, 49) as well as regulate monocyte/Mɸ migration and activation (46, 47, 50). The number of infiltrating Mɸs in the gastrointestinal tract during colitis reflects disease stage in both DSS-induced colitis (51) and human IBD (52). Consistent with the hypothesis that vitamin D signaling influences Mɸ recruitment to the site of colitis, global VDR KO mice had more CD68+ Mɸ in the colon after treatment with azoxymethane and DSS (53). CCL2 signaling drives blood monocyte infiltration into the inflamed colon (29). As a preliminary test of the hypothesis that vitamin D signaling influences Mɸ recruitment to the inflamed colon, we measured CCL2 mRNA and found that compared with controls, the expression level was significantly elevated in the distal colon of NEC-VDRKO mice at both 2 and 10 days after removal of DSS. Further studies will be necessary to demonstrate the mechanism by which vitamin D signaling regulates CCL2 mRNA levels and to directly evaluate the effects of vitamin D signaling on Mɸ recruitment.
In conclusion, our data have clarified the role that vitamin D signaling plays in the regulation of DSS-induced colitis, a model of human ulcerative colitis. First, we have demonstrated that the systemic effects on colitis seen during vitamin D deficiency (e.g., more BW loss, enlarged spleen) do not depend on VDR-dependent signaling in colon epithelial cells. In addition, our data suggest that loss of epithelial VDR does not influence epithelial healing after removal of DSS. In contrast, our data show that the systemic effects of vitamin D deficiency on colitis depend on VDR in the nonepithelial compartment and suggest that vitamin D signaling in the monocyte/Mɸ lineage is a significant target of vitamin D action during ulcerative colitis. Vitamin D signaling in this lineage may protect against colitis through multiple actions: suppressing monocyte migration, regulating Mɸ phenotypes, reducing proinflammatory M1 cytokine production, and enhancing M2-mediated epithelial healing. When coupled with other studies demonstrating important roles for vitamin D signaling in T cell biology, our research supports a role for vitamin D signaling as an important immunomodulator that reduces the severity of colitis.
Abbreviations:
- 1,25(OH)2D
1,25 dihydroxyvitamin D
- 25(OH)D
25-hydroxyvitamin D
- ANOVA
analysis of variance
- BW
body weight
- CAC
C57BL/6-Tg(Car1-cre)5Flt
- CEC-VDRKO
colon epithelial cell vitamin D–receptor knockout
- CV
coefficient of variation
- DAI
disease activity index
- DSS
dextran sulfate sodium
- FBS
fetal bovine serum
- IBD
inflammatory bowel disease
- IFN
interferon
- IL
interleukin
- KO
knockout
- LPS
lipopolysaccharide
- Mɸ
M1 macrophage
- mRNA
messenger RNA
- NEC-VDRKO
nonintestinal epithelial cell vitamin D–receptor knockout
- NOS2
nitric oxide synthase 2
- PCR
polymerase chain reaction
- TNF
tumor necrosis factor
- VDR
vitamin D receptor.
Acknowledgments
The work was supported by awards from the American Institute for Cancer Research (award number 09A098, to J.C.F.) and the National Cancer Institute (NCI) (CA156240, to J.C.F.), a pilot grant from the Purdue University Center for Cancer Research, an NCI-designated basic science cancer center (P30 CA023168, to J.C.F.), fellowship support from the Purdue Interdisciplinary Cancer Prevention Internship Program from the National Institutes of Health (R25 CA128770, to F.W. and M.L.D.), and an Abbott Laboratories Pathology Research Fellowship (to R.L.J.).
Disclosure Summary: R.L.J. is an employee of Eli Lilly and Company. P.W.S. is an employee of EPL, Inc. J.C.F. is on the Scientific Advisory Board for Innophos, Inc. The remaining authors have nothing to disclose.
References
Zhang X, Goncalves R, Mosser DM. The isolation and characterization of murine macrophages.
Author notes
Address all correspondence and requests for reprints to: James C. Fleet, PhD, Department of Nutrition Science, Purdue University, 700 West State Street, West Lafayette, Indiana 47907-2059. E-mail: [email protected].
