


Abstract
Oxidative stress induces endogenous antioxidants via nuclear factor erythroid 2–related factor 2 (Nrf2), potentially preventing tissue injury. We investigated whether insulin affects renal Nrf2 expression in type 1 diabetes (T1D) and studied its underlying mechanism. Insulin normalized hyperglycemia, hypertension, oxidative stress, and renal injury; inhibited renal Nrf2 and angiotensinogen (Agt) gene expression; and upregulated heterogeneous nuclear ribonucleoprotein F and K (hnRNP F and hnRNP K) expression in Akita mice with T1D. In immortalized rat renal proximal tubular cells, insulin suppressed Nrf2 and Agt but stimulated hnRNP F and hnRNP K gene transcription in high glucose via p44/42 mitogen-activated protein kinase signaling. Transfection with small interfering RNAs of p44/42 MAPK, hnRNP F, or hnRNP K blocked insulin inhibition of Nrf2 gene transcription. Insulin curbed Nrf2 promoter activity via a specific DNA-responsive element that binds hnRNP F/K, and hnRNP F/K overexpression curtailed Nrf2 promoter activity. In hyperinsulinemic-euglycemic mice, renal Nrf2 and Agt expression was downregulated, whereas hnRNP F/K expression was upregulated. Thus, the beneficial actions of insulin in diabetic nephropathy appear to be mediated, in part, by suppressing renal Nrf2 and Agt gene transcription and preventing Nrf2 stimulation of Agt expression via hnRNP F/K. These findings identify hnRNP F/K and Nrf2 as potential therapeutic targets in diabetes.
Under physiological conditions, oxidative stress triggers upregulation of endogenous antioxidants via nuclear factor erythroid 2–related factor 2 (Nrf2), which may prevent tissue injury by the induction of genes encoding various antioxidant and phase 2-detoxifying enzymes (1–3). Preclinical studies have postulated a renoprotective role for Nrf2 activation in diabetes (4–6). Clinical trials with bardoxolone methyl (an Nrf2 activator that activates Nrf2 signaling and also inhibits nuclear factor-κB and STAT signaling in human cell lines) (7, 8), however, have yielded conflicting results. The phase 2 Trial to Determine the Effects of Bardoxolone Methyl on eGFR in Patients With Type 2 Diabetes and Chronic Kidney Disease study targeted renoprotective actions of bardoxolone methyl in patients with type 2 diabetes with stage 3b or 4 chronic kidney disease (9). In contrast, the phase 3 Bardoxolone Methyl Evaluation in Patients With Chronic Kidney Disease and Type 2 Diabetes (BEACON) trial in type 2 diabetes patients with stage 4 chronic kidney disease was discontinued after 9 months owing to insufficient improvement in renal function and unchanged risk of end-stage renal disease (10). Bardoxolone methyl actually increased the risk of heart failure and cardiovascular death in the BEACON trial (10). The reasons for these disparate outcomes remain unknown.
We reported previously that catalase (Cat) overexpression in renal proximal tubular cells (RPTCs) prevents hypertension and nephropathy, attenuates renal angiotensinogen (Agt) and Nrf2 gene expression, and blocks Nrf2 stimulation of Agt gene transcription, in type 1 diabetes (T1D) Akita Cat-transgenic mice (11–13). Our data suggested that chronic Nrf2 activation by hyperglycemia might aggravate renal dysfunction via enhanced intrarenal renin-angiotensin system (RAS) in diabetes.
Beyond its hypoglycemic effect, insulin has been shown to regulate the expression of transcription factor genes and genes involved in inflammation and insulin signaling (14, 15). We previously established that insulin inhibits high glucose (HG) and reactive oxygen species (ROS) stimulation of renal Agt expression via 2 nuclear proteins, heterogeneous nuclear ribonucleoprotein F and K (hnRNP F and hnRNP K), which bind to a putative insulin-responsive element (IRE) in the rat Agt gene promoter (16–21). We further established that hnRNP F normalizes systemic hypertension via suppression of renal Agt production in transgenic mice specifically overexpressing hnRNP F in their RPTCs (22). Recently, we showed that hnRNP F and hnRNP K mediate, at least in part, insulin suppression of renal Agt gene expression (23).
Here we investigated whether insulin could inhibit Nrf2 gene transcription, avert Nrf2-stimulation of Agt gene expression via hnRNP F/K, and, subsequently, prevent systemic hypertension and renal injury in T1D mice.
Materials and Methods
Chemicals and constructs
d-glucose, d-mannitol, human insulin, PD98059 [a p44/42 mitogen-activated protein kinase (p44/42 MAPK) inhibitor], wortmannin and Ly-294,002 (specific inhibitors of phosphatidylinositol 3-kinase), and oltipraz (an Nrf2 activator) were purchased from Sigma-Aldrich Canada Ltd. (Oakville, ON, Canada). U0126 (a p44/42 MAPK inhibitor) was obtained from Cell Signaling Technology (New England Biolabs Ltd., Whitby, ON, Canada). Dulbecco’s modified Eagle medium (DMEM, 5 mmol/L d-glucose, catalog no. 12320) and penicillin/streptomycin and fetal bovine serum were procured from Invitrogen, Inc. (Burlington, ON, Canada). Insulin implants (Linßit, with a release rate of approximately 0.1 unit/implant/day for >30 days) were sourced from Linshin (Scarborough, ON, Canada). pGL4.20 [Luc/Puro] vector containing luciferase reporter came from Promega Corporation (Sunnyvale, CA). The pGL4.20 construct, containing the rat Agt gene promoter N-1495 to N+18 or the rat Nrf2 gene promoter N-1960 to N+111, has been described previously (11, 24). The hnRNP F gene promoter N-1,500 to N+99 and the hnRNP K gene promoter N-1,516 to N+16 were cloned from rat genomic DNA by conventional polymerase chain reaction (PCR) with specific primers (Table 1), confirmed by DNA sequencing, and then inserted into pGL4.20 vector via Kpn I and Hind III restriction sites. Rabbit polyclonal antibodies specific to rat hnRNP F and polyclonal antibodies against rat Agt were generated in our laboratory (J.S.D.C.) (20, 25). The other antibodies used are listed in Table 2. Scrambled Silencer Negative Control #1 and p44/42 MAPK, Nrf2, hnRNP F, and hnRNP K small interfering RNAs (siRNAs) were provided by Ambion, Inc. (Austin, TX). Restriction and modifying enzymes were supplied by Invitrogen, Inc., and New England Biolabs. Oligonucleotides were synthesized by Integrated DNA Technologies (Coralville, IA). QuickChange II Site-Directed Mutagenesis Kit and LightShift Chemiluminescent electrophoretic mobility shift assay (EMSA) Kit were procured from Agilent Technologies (Santa Clara, CA) and Thermo Scientific (Life Technologies Inc., Burlington, ON, Canada), respectively. Primer biotin-labeling kit was purchased from Integrated DNA Technologies.
Primer Sequences for RT-qPCR, Subcloning, and EMSA
| Gene/Species | Forward/Reverse Primer Sequences | Reference Sequence |
|---|---|---|
| Angiotensinogen (mouse/rat) | F: 5′-CCACGCTCTCTGGATTTATC-3′ | NM_007428.3 |
| R: 5′-ACAGACACCGAGATGCTGTT-3′ | ||
| HO-1 (mouse/rat) | F: 5′-CACCAAGTTCAAACAGCTCT-3′ | NM_010442.2 |
| R: 5′-CAGGAAACTGAGTGTGAGGA-3′ | ||
| hnRNP F (mouse/rat) | F: 5′-AATTGTGCCAAACGGGATCA-3′ | NM_133834.2 |
| R: 5′-GCACCAGACCTCATCCTATCCA-3′ | ||
| hnRNP K (mouse/rat) | F: 5′- CAGCTCCCGCTCGAATCTG-3′ | NM_001301341.1 |
| R: 5′- ACCCTATCAGGTTTTCCTCCAA-3′ | ||
| KEAP1 (mouse/rat) | F: 5′-CATCCACCCTAAGGTCATGGA-3′ | NM_016679.4 |
| R: 5′-GACAGGTTGAAGAACTCCTCC-3′ | ||
| Nrf2 (mouse/rat) | F: 5′-CGCCGCCTCACCTCTGCTGCCAGTAG-3′ | NM_010902.3 |
| R: 5′-AGCTCATAATCCTTCTGTCG-3′ | ||
| Nox1 (mouse/rat) | F: 5′-GGTCACTCCCTTTGCTTCCA-3′ | NM_172203.2 |
| R: 5′- GGCAAAGGCACCTGTCTCTCT-3′ | ||
| Nox2 (mouse/rat) | F: 5′-CCCTTTGGTACAGCCAGTGAAGAT-3′ | NM_007807.5 |
| R: 5′- CAATCCCGGCTCCCACTAACATCA-3′ | ||
| Nox4 (mouse/rat) | F: 5′-TGGCCAACGAAGGGGTTAAA-3′ | NM_015760.4 |
| R: 5′-GATGAGGCTGCAGTTGAGGT-3′ | ||
| β-Actin (mouse/rat) | F: 5′-ACGATTTCCCTCTCAGCTT-3′ | NM_031144.3 |
| R: 5′-TACAATGAGCTGCGTGTGGC-3′ | ||
| hnRNP F gene promoter (rat) | F: 5′-AAAGGTACCTTTTTAAAGTCTTAAGCATTTG-3′ | NC_005103.4 |
| R: 5′-AAAAAGCTTCAGGGGAAACGCTTTTCG-3′ | ||
| hnRNP K gene promoter (rat) | F: 5′-AAAGGTACCGGAGGCAACGGCGGACTCGC-3′ | NC_005116.4 |
| R: 5′-AAAAAGCTTACCAATTCACCATTGGTTTCGG-3′ | ||
| Rat Nrf2 promoter | F: 5′-TAATTAGGTACCCTTGCCTCTTGCCCTAGCC-3′ | −150 |
| F: 5′-TAATTAGGTACCCCCGAACCACGAGAGGAGG-3′ | −400 | |
| F: 5′-TAATTAGGTACCTTCGGCAAACAGCTGCTAATC-3′ | −537 | |
| F: 5′-TAATTAGGTACCAGCGTGGACTCATCCATCTC-3′ | −820 | |
| R: 5′-AAAAAACTCGAGTGCTGGGACTGTAGTCCTGGC-3′ | +111 | |
| Rat Nrf2 promoter- hnRNP F/K-RE (N-607/-592) | F: 5′-CGATAGCAGCGCAGGTGTGTTTGCTC-3′ | Site-directed mutagenesis primers |
| R: 5′-GAGCAAACACACCTGCGCTGCTATCG-3′ | ||
| Rat Nrf2 promoter- hnRNP F/K-RE (N-463/-444) | F: 5′-CAAGGCCTCCTGCTACTTCAGCCCAC-3′ | Site-directed mutagenesis primers |
| R: 5′-GTGGGCTGAAGTAGCAGGAGGCCTTG-3′ | ||
| Rat Nrf2 promoter hnRNP F/K-RE (N-463/-444) | F: 5′-CTCGCGCCCCGCCCCCGCGGGAC-3′ | Biotinylated probe for EMSA |
| R: 5′-GTCCCGCGGGGGCGGGGCGCGAG-3′ | ||
| Rat Nrf2 promoter hnRNP F/K-RE (N-463/-444) WT | F: 5′-CTCGCGCCCCGCCCCCGCGGGAC-3′ | Competitor |
| R: 5′-GTCCCGCGGGGGCGGGGCGCGAG-3′ | ||
| hnRNP F/K-RE (M1) | F: 5′-CTCGCGAAAAGCCCCCGCGGGAC-3′ | Competitor |
| R: 5′-GTCCCGCGGGGGCTTTTCGCGAG-3′ | ||
| hnRNP F/K-RE (M2) | F: 5′-CTCGCGCCCAAACCCCGCGGGAC-3′ | Competitor |
| R: 5′-GTCCCGCGGGGTTTGGGCGCGAG-3′ | ||
| hnRNP F/K-RE (M3) | F: 5′-CTCGCGCCCCGAAAACGCGGGAC-3′ | Competitor |
| R: 5′-GTCCCGCGTTTTCGGGGCGCGAG-3′ | ||
| hnRNP F/K-RE (M4) | F: 5′-CTCGCGAAAAGAAAACGCGGGAC-3′ | Competitor |
| R: 5′-GTCCCGCGTTTTCTTTTCGCGAG-3′ |
Boldface letters indicate the nucleotides replacing the nucleotides in WT hnRNP F/K-RE.
Abbreviations: HO-1, heme oxygenase-1; Keap1, Kelch-like ECH-associated protein 1; RE, responsive element; RT-qPCR, real-time quantitative polymerase chain reaction.
Antibodies Used in This Study
| Protein Target | Name of Antibody | Manufacturer, Catalog, and/or Name of Individual Providing the Antibody | Species Raised in; Mono or Polyclonal | Dilution for WB and or IHC | RRID |
|---|---|---|---|---|---|
| Agt | Angiotensinogen antibody | Specifically recognizing Agt were generated in our laboratory | Rabbit; polyclonal | WB; 1:2000 | AB_2631321 |
| IHC; 1:200 | |||||
| Cat | Catalase | Sigma-Aldrich | Rabbit; polyclonal | WB; 1:1000 | AB_259018 |
| IHC;1:200 | |||||
| HO-1 | HO-1 antibody | Enzo Life Sciences (SPA-895(D)) | Rabbit; polyclonal | WB; 1:2000 | AB_2248405 |
| IHC; 1:200 | |||||
| hnRNP F | hnRNP F antibody | Specifically recognizing (CTARRYIGIVKQAGLER) were generated in our laboratory | Rabbit; polyclonal | WB; 1:10,000 | AB_2631323 |
| IHC; 1:200 | |||||
| hnRNP K | hnRNP K (H-300) | Santa Cruz Biotechnology (sc-25373) | Rabbit; polyclonal | WB; 1:1000 | AB_2120388 |
| IHC; 1:100 | |||||
| hnRNP K | Anti–hnRNP K antibody (3C2) | Abcam (ab39975) | Mouse; monoclonal-chip grade | — | AB_732981 |
| Keap1 | Anti-Keap1 | Abcam (ab66620) | Rabbit; polyclonal | WB; 1:1500 | AB_1141055 |
| IHC; 1:200 | |||||
| Nrf2 | Anti-Nrf2 | Abcam (ab31163) | Rabbit; polyclonal | WB; 1:1000 | AB_881705 |
| IHC; 1:200 | |||||
| β-Actin | β-Actin clone AC-15 | Sigma-Aldrich (A5441) | Mouse; monoclonal | WB; 1:20,000 | AB_476744 |
| pERK1/2 | Phospho-p44/42 MAPK (Thr202/ Tyr204) (E10) | Cell Signaling (#9106) | Mouse; monoclonal | WB; 1:1000 | AB_331768 |
| ERK1/2 | p44/42 MAPK | Cell Signaling (#9102) | Rabbit; polyclonal | WB; 1:2000 | AB_330744 |
| p-Nrf2 | Nrf2 (S40) | Bioss (bs-2013R) | Rabbit; polyclonal | WB; 1:1000 | AB_10855428 |
Abbreviations: IHC, immunohistochemistry; RRID, Research Resource Identifier.
Physiological studies
Adult male wild-type (WT) and heterozygous Akita mice with mutated insulin2 gene (C57BL/6-Ins2Akita/J) were purchased from Jackson Laboratories (Bar Harbor, ME).
Male Akita mice (age 10 weeks) were divided into 2 groups with and without insulin implants at week 12 until week 16 (23). Non-Akita littermates served as controls. All animals had access to standard mouse chow and water ad libitum. Animal care and procedures were approved by the Centre de recherche du Centre hospitalier de l’Université de Montréal Animal Care Committee and followed the Principles of Laboratory Animal Care [National Institutes of Health (NIH) publication no. 85-23, revised 1985: http://grants1.nih.gov/grants/olaw/references/phspol.htm].
Blood glucose levels and systolic blood pressure (SBP) were measured with an Accu-Chek Performa System (Roche Diagnostics Laval, Quebec, Canada) and BP-2000 tail-cuff pressure monitor (Visitech Systems, Apex, NC), respectively (11–13, 22, 23, 26). The mice were housed individually in metabolic cages 24 hours before euthanasia. Blood was collected by cardiac puncture before euthanization and centrifuged for serum. Urine was sampled and assayed for albumin/creatinine ratio (ACR) by enzyme-linked immunosorbent assay with Albuwell and Creatinine Companion (Exocell, Inc., Philadelphia, PA) (11–13, 22, 23, 26).
Glomerular filtration rate (GFR) was estimated with fluorescein isothiocyanate inulin (11, 22, 23, 26). Kidneys were removed immediately after GFR measurement, decapsulated, and weighed before Percoll gradient isolation of renal proximal tubules (RPTs) (11, 22, 23, 26). Aliquots of freshly isolated RPTs from individual mice were immediately processed for total RNA and protein isolation.
Separate hyperinsulinemic-euglycemic clamp experiments were performed on conscious male C57Bl/6 mice (age 12 to 14 weeks) after a 4-hour food restriction (27).
Serum and urinary Agt and angiotensin II
Serum and urinary Agt and angiotensin II (Ang II) levels were quantified by enzyme-linked immunosorbent assay (Immuno-Biological Laboratories, Inc., Minneapolis, MN) (11, 13, 22, 23, 26).
Morphologic studies
Kidney sections (3 to 4 μm thick, 4 to 5 sections per kidney, 5 to 6 kidneys per group) were stained with standard periodic acid Schiff or Masson’s trichrome or processed for immunohistochemistry (ABC Staining, Santa Cruz Biotechnology, Santa Cruz, CA) (11–13, 22, 23, 26). Tubular luminal areas, mean glomerular tuft, and RPTC volumes were assessed on periodic acid Schiff–stained sections (11–13, 22, 23, 26). Immunostained images were quantified by NIH ImageJ software (http://rsb.info.nih.gov/ij/).
ROS generation as an index of oxidative stress was assessed by dihydroethidium (DHE; Sigma-Aldrich Canada Ltd.) staining of frozen kidney sections (11–13, 22, 23, 26) and by lucigenin in freshly-isolated RPTs (11–13, 17–19, 22, 23, 26). The results were confirmed by standard Cat and nicotinamide adenine dinucleotide phosphate (NADPH) oxidase activity assays (22, 23, 26, 28).
Effect of Insulin on gene expression in immortalized renal proximal tubular cells
Rat immortalized renal proximal tubular cells (IRPTCs) (29) (passages 12 to 18) were studied. Plasmids pGL4.20-Agt, pGL4.20-Nrf2, pGL4.20-hnRNP F, and pGL4.20-hnRNP K, respectively, containing Agt, Nrf2, hnRNP F, and hnRNP K gene promoters, were transfected into IRPTCs. Stable transformants were selected in the presence of 0.6 mg/L of puromycin (11).
To study the effects of insulin, stable transformants (75% to 85% confluence) were synchronized overnight in serum-free DMEM containing 5 mmol/L d-glucose, then incubated in normal glucose (NG, 5 mmol/L d-glucose plus 20 mmol/L d-mannitol) or HG (25 mmol/L d-glucose) DMEM containing 1% depleted fetal bovine serum and insulin (10−7 mol/L) for up to 24 hours ± p44/42 MAPK inhibitors (PD98059 or U0126), phosphatidylinositol 3-kinase inhibitors (Ly-294, 002 or wortmannin), or the Nrf2 activator oltipraz. The cells were then harvested, and promoter activity was measured by luciferase assay (11, 23, 30). IRPTCs stably transfected with pGL4.20 served as controls.
In additional studies, stable IRPTC transformants were transfected with scrambled siRNA, p44/42 MAPK, Nrf2, hnRNP F, or hnRNP K siRNAs (11, 23, 30), and their effects on gene promoter activity, messenger RNA (mRNA), and protein expression were analyzed after 24 hours of culture.
Real-time quantitative polymerase chain reaction assays and Western blotting
Cat, Agt, hnRNP F, hnRNP K, Nrf2, heme oxygenase-1 (HO-1), Kelch-like ECH-associated protein 1 (Keap1), Nox1, Nox2, Nox4, and β-actin mRNA levels in RPTs and IRPTCs were quantified by real-time quantitative PCR (RT-qPCR) with specific primers (Table 1).
Western blotting (WB) was undertaken (11–13, 22, 23, 26, 28, 30). The relative densities of Cat, Agt, hnRNP F, hnRNP K, Nrf2, HO-1, Keap1, and β-actin bands were quantified by computerized laser densitometry (ImageQuant software, version 5.1, Molecular Dynamics, Sunnyvale, CA).
Statistical analysis
Values were expressed as mean ± standard error of the mean (SEM). Data were analyzed using 1- or 2-way analysis of variance, as appropriate, followed by a Bonferroni multiple comparison testing. P < 0.05 values were considered statistically significant.
Results
Physiological studies
Table 3 reports the results of physiological measurements in non-Akita WT, Akita, and Akita mice treated with insulin at the age of 16 weeks. Insulin normalized blood glucose, SBP, kidney weight/tibia length (KW/TL) and heart weight/TL ratios, ACR, GFR, urinary Agt, and Ang II levels in Akita mice compared with untreated Akita controls. No changes in serum Agt levels were detected among the different groups.
Physiological Measurements
| WT | Akita | Akita + Insulin | |
|---|---|---|---|
| Blood glucose (mmol/L) | 7.46 ± 0.667 | 31.6 ± 0.76a | 14.62 ± 3.57b |
| Systolic blood pressure (mm Hg) | 109.17 ± 1.5 | 133.2 ± 4.86a | 114.3 ± 4.16c |
| Body weight (g) | 30.7 ± 0.73 | 22.41 ± 0.45a | 24.35 ± 0.42a |
| Kidney weight (mg) | 324 ± 11 | 520 ± 27a | 467 ± 10a,d |
| Heart weight (mg) | 140 ± 10 | 160 ± 10 | 150 ± 10 |
| Tibia length (mm) | 18.5 ± 0.15 | 16.3 ± 0.12a | 17.3 ± 0.10c,e |
| Kidney/tibia length (mg/mm) | 17.51± 0.8 | 31.91 ± 1.36a | 26.99 ± 0.02a,c |
| Heart/tibia length (mg/mm) | 7.6 ± 0.10 | 9.8 ± 0.31e | 8.6 ± 0.10d,f |
| ACR (µg/µmol) | 1.12 ± 0.17 | 5.64 ± 0.32a | 1.96 ± 0.10b |
| GFR/body weight (µL/min−1g−1) | 6.65 ± 0.12 | 16.3 ± 0.37a | 7.79 ± 0.48b |
| Urinary Agt/creatinine ratio (ng/mg) | 29.44 ± 4.3 | 289.75 ± 61.2a | 167.6 ± 21.1a,c |
| UrinaryAng II/creatinine ratio (ng/mg) | 1.40 ± 0.42 | 23.64 ± 12.04e | 5.10 ± 5.01a,b |
| Serum Agt (ng/mL) | 5221 ± 43.4 | 4609 ± 78.73 | 4114.13 ± 95.01 |
| Glomerular tuft volume (×103 μm3) | 141.2 ± 4.52 | 182.03 ± 6.3a | 135.7 ± 6.61b |
| RPTC volume (×103 μm3) | 6.9 ± 0.66 | 9.93 ± 0.27a | 7.81 ± 0.37c,f |
| Tubular luminar area (μm2) | 44.7 ± 5.01 | 71.75 ± 4.02a | 54.54 ± 6.03c |
P < 0.005 vs WT.
P < 0.005 vs Akita.
P < 0.01 vs Akita.
P < 0.05 vs WT.
P < 0.01 vs WT.
P < 0.05 vs Akita.
Histological studies
Consistent with earlier observations (11, 13, 22, 23, 26, 28, 30), Akita mice developed renal damage, including proximal tubule cell atrophy, tubule lumen dilation, accumulation of cell debris [Supplemental Fig. 1(a)], and increased extracellular matrix proteins in the glomeruli and tubules [Supplemental Fig. 1(b)]. Glomerular tufts, RPTC volume, and renal tubule lumen areas were augmented significantly in Akita mice compared with WT controls. Insulin treatment normalized these changes (Table 3).
Average SBP was 20 to 25 mm Hg higher in Akita mice at age 11 weeks than in WT mice (P < 0.005) and remained significantly elevated for the study’s duration [Fig. 1(a); Table 3]. Insulin treatment completely normalized SBP in Akita mice.
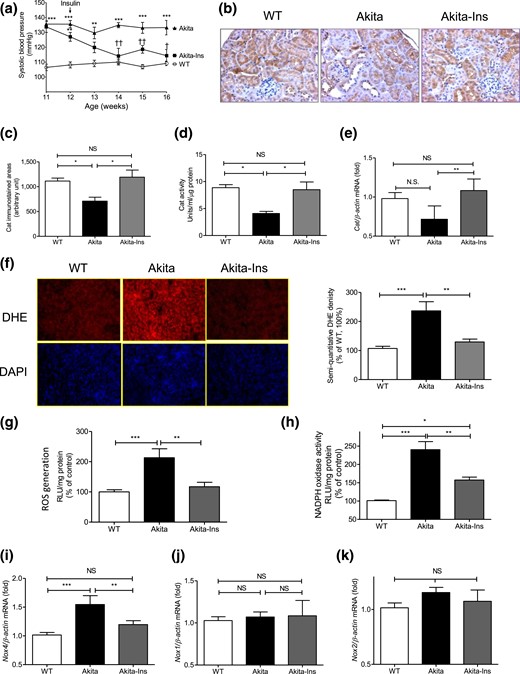
Insulin prevents systemic hypertension and renal oxidative stress in Akita mice. (a) Longitudinal changes in mean SBP (measured 2 to 3 times per mouse per week in the morning without fasting). Baseline SBP was recorded daily over 5 days before initiation of measurements. (b) Cat immunostaining, (c) semiquantitation of Cat-immunostained areas, (d) Cat activity, (e) Cat mRNA level, (f) DHE (red) staining (left panel) and semiquantitation of DHE fluorescence (right panel), (g) ROS generation by lucigenin assay, (h) NADPH oxidase activity, (i) Nox4, (j) Nox1, and (k) Nox2 mRNA expression in freshly isolated RPTs from WT controls, Akita mice, and Akita mice + insulin (Ins) implants. Values are mean ± SEM, n = 8 per group. *P < 0.05; **P < 0.01, and ***P < 0.005, WT vs Akita. ††P < 0.01, Akita vs Akita-Ins. WT controls (open bars); Akita (solid bars), and Akita mice + Ins (gray bars). DAPI, 4′, 6-diamidino-2-phenylindole; NS, not significant; RLU, relative luciferase unit.
Cat immunostaining [Fig. 1(b)] and semiquantitation of Cat-immunostained areas [Fig. 1(c)], Cat activity [Fig. 1(d)], but not Cat mRNA expression [Fig. 1(e)], were significantly lower in RPTs from Akita vs WT mice. Insulin treatment reversed these changes in Akita mice. In contrast, Akita mice exhibited significantly greater DHE staining [Fig. 1(f)], ROS levels [Fig. 1(g)], NADPH oxidase activity [Fig. 1(h)], and Nox4 mRNA expression [Fig. 1(i)] than WT controls. Insulin normalized these changes. No differences in Nox1 and Nox2 mRNA expression were detected [Fig. 1(j) and 1(k)].
Renal Agt, HO-1, Nrf2, Keap1, and hnRNP F/K expression
Agt, HO-1, and Nrf2 immunostaining increased in RPTCs of Akita mice compared with WT controls. Treatment with insulin normalized these changes [Fig. 2(a)]. Keap1 immunostaining did not differ between groups [Fig. 2(a)]. WB of Agt and HO-1 [Fig. 2(b)], Nrf2 and Keap1 [Fig. 2(c)], and RT-qPCR of Agt, HO-1, Nrf2, and Keap1 mRNA expression [Fig. 2(e), i–iv] from isolated RPTs confirmed these findings. Furthermore, insulin treatment decreased nuclear Nrf2 and phosphorylated (p)-Nrf2 (s-40) expression without significantly affecting cytosolic Nrf2 and p-Nrf2 expression in RPTs of Akita mice [Fig. 2(d)]. Consistent with previous observations (23), immunostaining of hnRNP F/K and WB of hnRNP F/K showed decreases in Akita compared with WT mice, with normalization by insulin [Supplemental Fig. 1(c), i and ii, respectively].
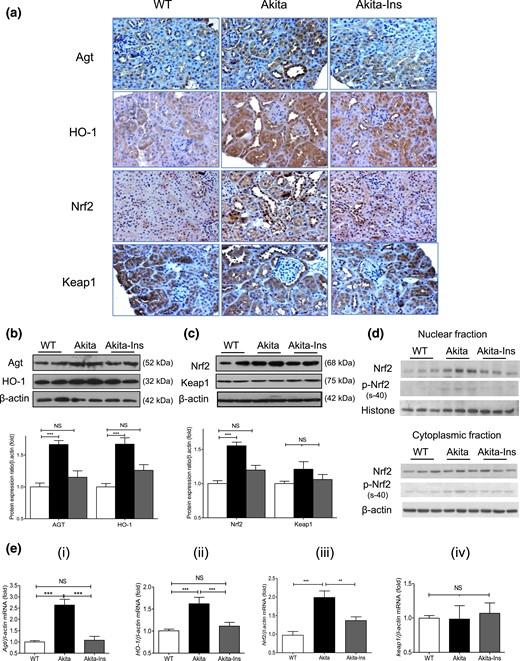
Renal Agt, HO-1, Nrf2, and Keap1 expression in Akita mice. (a) Agt, HO-1, Nrf2, and Keap1 immunostaining (magnification ×200). (b) WB of Agt and HO-1 in total lysates. (c) WB of Nrf2 and Keap1 in total lysates. (d) WB of Nrf2 and p-Nrf2 (s-40) in nuclear and cytoplasmic fractions of RPTs. (e) (i–iv) RT-qPCR of Agt, HO-1, Nrf2, and Keap1 mRNA expression in RPTs of WT controls, Akita, and Akita mice + insulin (Ins). Values are mean ± SEM, n = 8 per group. **P < 0.01; ***P < 0.005; WT controls (open bars); Akita (solid bars), and Akita mice + Ins (gray bars). NS, not significant.
Effect of insulin on Agt, hnRNP F/K, and Nrf2 gene expression in IRPTCs
Insulin attenuated Nrf2 and Agt gene promoter activity in NG and prevented HG stimulation of Nrf2 and Agt gene promoter activity in IRPTCs in a time-dependent manner [Supplemental Fig. 1(d) and 1(e), respectively]. In contrast, insulin stimulated hnRNP F and hnRNP K gene promoter activity in NG and HG in IRPTCs in a time-dependent manner [Supplemental Fig. 1(f) and 1(g), respectively]. PD98059 and U0126, but not wortmannin or Ly-294, 002, prevented insulin inhibition of Nrf2 gene promoter activity [Fig. 3(a)], Agt gene promoter activity [Fig. 3(b)], and insulin stimulation of hnRNP F [Fig. 3(c)] as well as hnRNP K promoter activity [Fig. 3(d)] in IRPTCs.
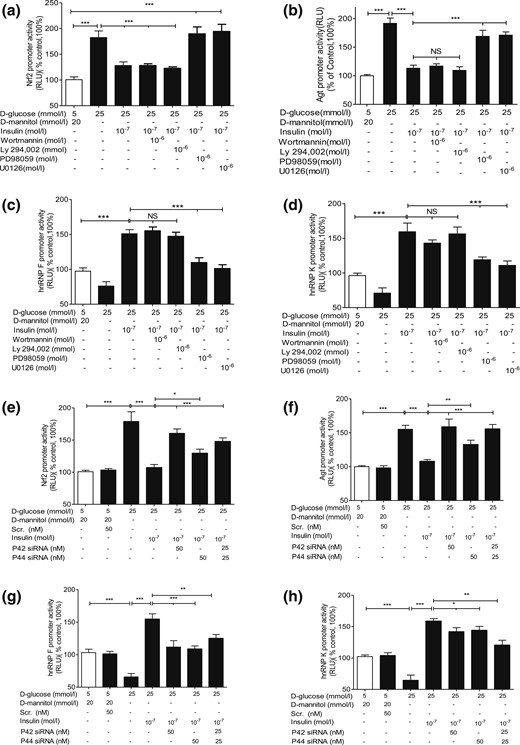
Insulin effect on Nrf2, Agt, hnRNP F, and hnRNP K gene promoter activity in IRPTCs. Cells stably transfected with (a) pGL4.20-Nrf2, (b) pGL4.20-Agt, (c) pGL4.20-hnRNP F, or (d) pGL4.20-hnRNP K gene promoter were incubated in NG or HG DMEM ± insulin for 24 hours with or without wortmannin, Ly-294, 002, PD98059, or U0126 or transiently transfected with p42 MAPK or p44 MAPK siRNA (e–h). Luciferase activity in cells cultured in NG medium was considered as 100%. The results are expressed as percentage of control (mean ± SEM, n = 3). *P < 0.05; **P < 0.01; ***P < 0.005. Similar results were obtained in two separate experiments. NS, not significant; RLU, relative luciferase unit.
Insulin stimulated p44/p42 MAPK phosphorylation in a time-dependent manner in NG and HG in IRPTCs [Supplemental Fig. 2(a), i and iii]. Transient transfection of p44 MAPK and p42 MAPK siRNAs attenuated the expression of respective p44 MAPK and p42 MAPK in IRPTCs, whereas scrambled siRNA had no effect [Supplemental Fig. 3(b)]. Transfection with p44 MAPK or p42 MAPK siRNAs or both reversed insulin inhibition of Nrf2 and Agt gene promoter activity [Fig. 3(e) and 3(f), respectively] and insulin stimulation of hnRNP F and hnRNP K gene promoter activity [Fig. 3(g) and 3(h), respectively]. Quantitation of Nrf2, Agt, hnRNP F, and hnRNP K mRNA expression [Supplemental Fig. 2(c–f)) confirmed these observations. Our findings lend additional support to the concept that insulin inhibition of Agt and Nrf2 and stimulation of hnRNP F and hnRNP K transcription require either p44 MAPK or p42 MAPK—or perhaps both—for optimal signaling in RPTCs in vivo.
Insulin prevents Nrf2 stimulation of Nrf2 and Agt gene expression via hnRNP F/K expression in IRPTCs
We next explored whether insulin inhibits Nrf2 gene expression via hnRNP F/K and whether hnRNP F/K could prevent Nrf2 stimulation of Agt and Nrf2 gene transcription in IRPTCs. As anticipated, oltipraz (an Nrf2 activator) stimulated both Nrf2 and Agt gene promoter activity in IRPTCs (11), which was tempered by insulin [Fig. 4(a) and 4(b), respectively]. In contrast, oltipraz diminished hnRNP F and hnRNP K gene promoter activity that was reversed by insulin [Fig. 4(c) and 4(d), respectively]. Once again, PD98059 reversed these actions of insulin [Fig. 4(a–d)]. Our observations were confirmed by RT-qPCR and WB of their respective mRNA [Fig. 4(e–h)] and protein [Fig. 4(i) and 4(j)] expression.
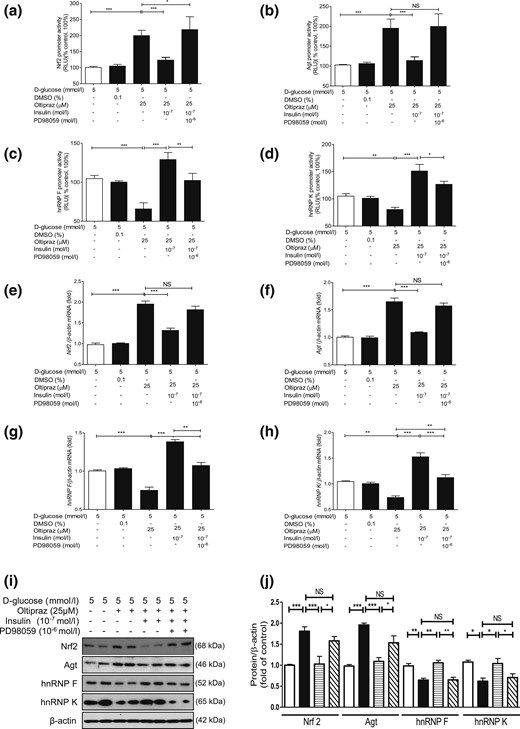
Oltipraz effect on Agt, Nrf2, hnRNP F, and hnRNP K gene expression in IRPTCs. Effect of oltipraz on promoter activity of (a) Nrf2, (b) Agt, (c) hnRNP F, and (d) hnRNP K genes and their respective mRNA (e–h) and protein (i and j) levels in IRPTCs incubated in NG or HG medium ± insulin with or without PD98059. Promoter activity, mRNA, and protein levels in cells in NG medium are considered as 100% or arbitrary unit 1, respectively. The results are reported as percentages of control values (mean ± SEM, n = 3). *P < 0.05; **P < 0.01; ***P < 0.005. Similar results were obtained in three separate experiments. Control IRPTCs in NG (open bars), IRPTCs treated with oltipraz (solid black bars), IRPTCs treated with oltipraz + Ins (horizontal striped bars), and IRPTCs treated with oltipraz + insulin + PD98059 (diagonal striped bars). DMSO, dimethyl sulfoxide; NS, not significant; RLU, relative luciferase unit.
Transfection of hnRNP F or hnRNP K siRNA or both reversed the inhibitory effect of insulin on Nrf2 promoter activity and Nrf2 mRNA expression in IRPTCs in HG [Fig. 5(a) and 5(b), respectively], whereas transfection of Nrf2 complementary DNA (cDNA) attenuated insulin’s inhibitory impact on both Nrf2 and Agt promoter activity in a concentration-dependent manner [Fig. 5(c) and 5(d), respectively]. In contrast, Nrf2 siRNA transfection further enhanced the suppressive action of insulin on both Nrf2 and Agt gene promoter activity [Fig. 5(e) and 5(f), respectively]. Interestingly, cotransfection with hnRNP F and/or hnRNPK cDNA tempered the stimulatory effect of Nrf2 cDNA on Nrf2 and Agt gene promoter activity [Fig. 5(g) and 5(h), respectively] and their mRNA levels [Fig. 5(i) and 5(j), respectively], indicating that hnRNP F and hnRNP K compete with Nrf2 on Nrf2 and Agt gene transcription in RPTCs in vivo.
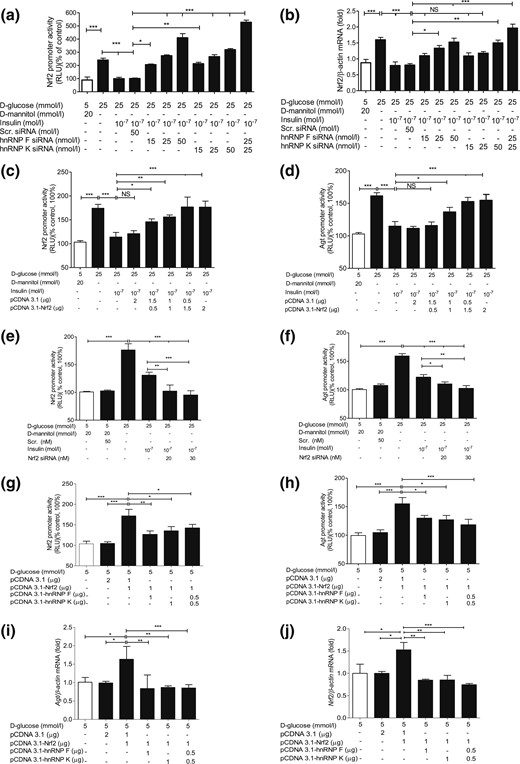
SiRNA of hnRNP F/K or Nrf2 and hnRNP F/K cDNA affect Nrf2 and Agt gene promoter activity in IRPTCs. Effect of hnRNP F siRNA or hnRNP K siRNA or a combination of both on (a) promoter activity and (b) mRNA expression of Nrf2 in IRPTCs incubated in NG or HG medium ± insulin. Effect of transfection of Nrf2 cDNA (c and d) and Nrf2 siRNA (e and f) on Nrf2 and Agt promoter activity and their respective Nrf2 and Agt mRNA levels (g–j) in IRPTCs. Promoter activity and mRNA levels in cells incubated in NG medium are expressed as 100% or arbitrary unit 1, respectively. Each point represents the mean ± SEM (n = 3) assayed in duplicate. *P < 0.05; **P < 0.01; ***P < 0.005. Similar results were obtained in two to three separate experiments. NS, not significant; RLU, relative luciferase unit.
Localization of hRNP F–responsive elements in rat Nrf2 gene promoter
To localize putative DNA-responsive elements (REs) that mediate insulin’s inhibitory action, plasmids containing various lengths of the rat Nrf2 gene promoter were transiently transfected into IRPTCs. pGL4.20-Nrf2 promoter N-1960/N+111 exhibited 10-fold increases compared with control plasmid promoterless pGL4.20 in IRPTCs [Fig. 6(a)]. Deletion of nucleotides to N-820, N-537, and N-400 augmented the activity of pGL4.20-Nrf2 promoter N-820/N+111, pGL4.20-Nrf2 promoter N-537/N+111, and pGL4.20-Nrf2 promoter N-400/N+111 to 22-, 18-, and 10-fold compared with control plasmid pGL4.20, respectively. Furthermore, deletion of nucleotides to N-150 lowered the promoter activity of pGL4.20-Nrf2 promoter N-150/+111 to 2.5-fold higher than the control [Fig. 6(a)]. Insulin averted the stimulatory effect of HG on pGL4.20-Nrf2 promoters N-1960/N+111, N-820/N+111 and N-537/N+111, whereas HG and insulin had no impact on the activity of the pGL4.20-Nrf2 promoters N-400/N+111 and N-150/N+111 [Fig. 6(b)]. Interestingly, deletion of nucleotides N-463 to N-444 (5′-cgcgccccgcccccgcggga-3′) in the Nrf2 gene promoter completely abolished the inhibitory action of insulin on pGL4.20-Nrf2 promoter N-1960/N+111 activity in HG, whereas deletion of N-607 to N-592 (5′-ggggcccgggctccc-3′) in the Nrf2 gene promoter had no effect [Fig. 6(c)]. Furthermore, transfection of the plasmid pCMV-Myc containing hnRNP F or hnRNP K cDNA or both plasmids inhibited pGL4.20 Nrf2 promoter N-1960/N+111 activity with or without N-607 to N-592 deletion, but had no impact on Nrf2 gene promoter activity with N-463 to N-444 deletion [Fig. 6(d)]. These data would point toward nucleotides N-463 to N-444 as a putative IRE that binds hnRNP F/K.
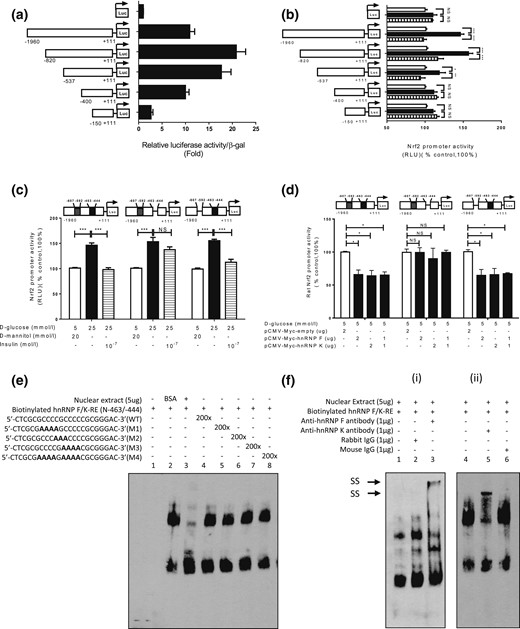
Identification of hnRNP F/K-RE or putative IRE in the Nrf2 gene promoter. Luciferase (Luc) activity of plasmids containing various lengths of Nrf2 gene promoter in (a) NG medium or (b) HG medium ± insulin in IRPTCs. Luciferase activities were normalized by cotransfecting the vector, pRc/RSV plasmid (Invitrogen, Inc.) containing beta-galactosidase cDNA. Control IRPTCs in NG (open bars), IRPTCs in HG (solid black bars), and IRPTCs treated with Ins in HG (horizontal striped bars). (c) Activity of 1 μg of the full-length Nrf2 gene promoter ± deletion of distal putative IRE (N-607 to N-592; 5′-ggggcccgggctccc-3′) or proximal putative IRE (N-463 to N-444 (5′-cgcgccccgcccccgcggga-3″) in IRPTCs in NG medium. (d) Activity of 1 μg of the full-length Nrf2 gene promoter with or without deletion of distal putative IRE or proximal putative IRE transfected with hnRNP F or hnRNP K cDNA or a combination of both in IRPTCs in NG medium. Values are mean ± SEM, n = 3. All experiments were repeated twice. (*P < 0.05; **P < 0.01; ***P < 0.005). (e) EMSA of putative biotinylated proximal IRE with RPTC nuclear proteins with or without excess unlabeled proximal WT IRE or mutated IRE. (f) Supershift EMSA. (i) Rabbit anti–hnRNP F or rabbit IgG and (ii) mouse anti–hnRNP K or mouse IgG was added to the reaction mixture and incubated for 30 minutes on ice before incubation with biotinylated probe. The results are representative of three independent experiments. NS, not significant; RLU, relative luciferase unit; SS, supershift band.
The EMSA showed that the double-strand DNA fragment, N-465 to N-443 (WT), binds to nuclear proteins from IRPTCs and could be displaced by the respective WT DNA fragment, but not by mutated DNA fragments [Fig. 6(e)]. Furthermore, addition of anti-hnRNP F or anti-hnRNP K antibody induced a supershift of the hnRNP F-responsive element (RE) with nuclear proteins [Fig. 6(f), i and ii, respectively].
Oxidative stress and gene expression in hyperinsulinemic-euglycemic mouse kidneys
To investigate whether insulin could influence renal Agt, Nrf2, hnRNP F, and hnRNP K expression independently of its glucose-lowering effect in vivo, we performed hyperinsulinemic-euglycemic clamp experiments on WT mice [Supplemental Fig. 3(a–c)]. DHE staining, ROS generation, Cat, Nox1, Nox2, and Nox4 mRNA expression [Supplemental Fig. 3(d–i)] did not differ from RPTs of saline-infused and hyperinsulinemic mice. In contrast, hyperinsulinemia decreased Agt and increased hnRNP F and hnRNP K immunostaining [Fig. 7(a)]. It also reduced Nrf2 and HO-1 immunostaining without affecting Keap1 compared with saline infusion [Fig. 7(b)]. WB [Fig. 7(c) and 7(d)] and RT-qPCR [Fig. 7(e), i–iv] of their respective protein and mRNA expressions confirmed these findings.
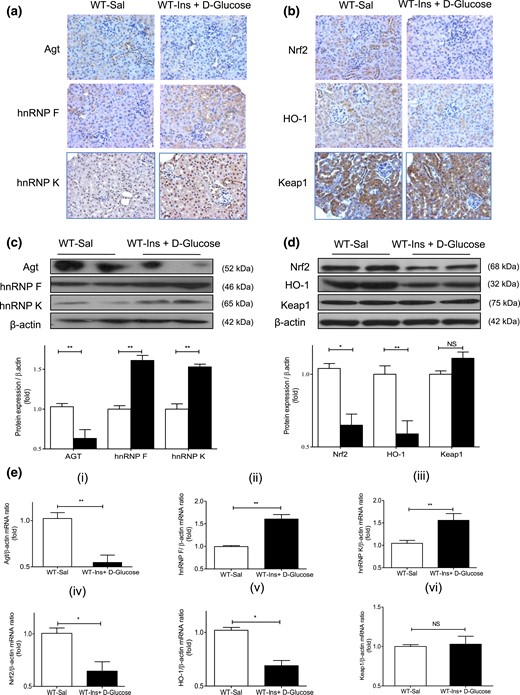
Renal Agt, hnRNP F/K, Nrf2, HO-1, and Keap1 expression in hyperinsulinemic-euglycemic mice. (a) Immunostaining of Agt, hnRNP F, and hnRNP K and (b) Nrf2, HO-1, and Keap1 (magnification ×200). (c) WB of Agt, hnRNP F, and hnRNP K and (d) Nrf2, HO-1, and Keap1 expression in isolated RPTs from WT mice after a 3-hour infusion with saline (Sal) or insulin (Ins) + d-glucose. (e) RT-qPCR of (i) Agt, (ii) hnRNP F, (iii) hnRNP K, (iv) Nrf2, (v) HO-1, and (vi) Keap1 mRNA expression in isolated RPTs from WT mice after a 3-hour infusion with saline (Sal; open bars) or Ins + d-glucose (solid black bars). Values are mean ± SEM, n = 8 per group. *P < 0.05; **P < 0.01. NS, not significant.
Discussion
Our present study identifies an inhibitory action of insulin on renal Nrf2 gene transcription via a putative IRE in the Nrf2 gene promoter that binds hnRNP F/K. Insulin also prevents Nrf2 stimulation of Agt expression via hnRNP F/K expression in diabetes. These insulin-mediated effects largely occur independently of its glucose-lowering effect.
Intensive insulin therapy is critical for preventing the progression of nephropathy in T1D, although the underlying mechanisms remain incompletely understood (31–33). The existence of a local RAS in the kidney is well-established (34, 35). RPTCs express all components of the RAS (29, 36, 37). We demonstrated previously that insulin prevents hypertension and attenuates kidney injury by suppressing renal Agt gene transcription via hnRNP F/K upregulation in Akita mice (23). The current study provides in vivo and in vitro evidence that insulin modulates Agt expression more proximally; it curtails renal Nrf2 gene transcription and prevents Nrf2 stimulation of Agt expression by increasing hnRNP F/K expression, which may be critical for its antihypertensive and renoprotective actions in diabetes.
The Akita mouse, an autosomal-dominant model of spontaneous T1D (insulin2 mutation), develops hypoinsulinemia (60% to 70% lower circulating immunoreactive insulin levels), hyperglycemia, hypertension, cardiac, and renal dysfunction (38, 39) closely resembling changes in T1D patients. We detected markedly increased oxidative stress in RPTCs from Akita compared with non-Akita mice; insulin normalized these changes. Consistently, insulin treatment lowered RPT Nrf2 and Agt expression as well as urinary Agt and Ang II levels in Akita mice vs WT controls. Thus, the Akita mouse is an excellent model of T1D with insulin repletion.
Cat expression and activity, but not Cat mRNA expression, were significantly lower in RPTs from Akita vs WT mice at 16 weeks of age. In contrast, no substantial changes in Cat expression and activity were detected in RPTs of younger Akita mice (4 weeks of age) when compared with WT mice [Supplemental Fig. 4(c–f)], leading us to speculate that the lower Cat expression and activity observed in Akita mice at 16 weeks of age might be due to exhaustion of the scavenging system.
Interestingly, treatment of Akita mice with insulin implants at 20 weeks of age markedly attenuated SBP, fasting blood glucose, KW–body weight ratio and KW/TL, (with the exception of urinary ACR), normalized Nrf2, and Agt mRNA expression and stimulated p44/42 MAPK phosphorylation in RPTs of Akita mice at 24 weeks [Supplemental Table 1 and Supplemental Fig. 5(a–c)]. These findings are consistent with those of Lizotte et al. (40), who reported that insulin treatment was effective in lowering fasting blood glucose, but not urinary ACR in Akita mice when begun at the age of 20 weeks. However, whether insulin is effective in even older Akita mice remains to be investigated.
The insulin level used in vitro (10−7 M or 573 ng/mL) was at least 200-fold higher than the mean circulating insulin level in Akita mice bearing insulin implants (2.3 ± 1.1 ng/mL), similar to those reported (3.4 ± 0.4 ng/mL) by others (41). However, we routinely used insulin at 10−7 M for our in vitro studies because we found that insulin at 10−7 M completely normalized Nrf2 and Agt promoter activity and enhanced hnRNP F/K promoter activity 1.5-fold compared with insulin at 10−9 M in HG [Supplemental Fig. 6(a–d)].
Combining pharmacological inhibitors and gene knockdown with siRNAs, we identified a key role of the p44/42 MAPK pathway mediating insulin suppression of renal Nrf2 and Agt as well as stimulation of hnRNP F/K gene transcription. At present, we do not understand the exact mechanism by which insulin decreases nuclear Nrf2 accumulation in Akita mice. Studies of Zheng et al. (42), which reported that mutation of consensus sites (s215, s408, and s577) for MAPK phosphorylation in Nrf2 by MAPKs had a limited impact in mediating Nrf2 nuclear translocation and activity in HEK293T cells. One possibility is that insulin activates p44/42 MAPK following binding to insulin receptors (23, 43, 44), then phosphorylates Nrf2, thereby modulating or hindering their nuclear translocation and activity. This possibility is supported by our data, which show that insulin treatment attenuates nuclear accumulation of Nrf2 and p-Nrf2 (s-40) without apparent effect on cytoplasmic Nrf2 and p-Nrf2 (s-40) in Akita mice and increases p44/42 MAPK phosphorylation [Supplemental Fig. 4(a) and 4(b), respectively]. During oxidative stress, PKC-δ phosphorylates Nrf2 at serine 40 to enhance its nuclear translocation (45, 46). Another possibility is that p44/42 could directly affect Agt, Nrf2, and hnRNP F/K transcription via binding to the putative MAPK-responsive element(s) in the respective promoters. Hu et al. (47) reported that MAPK1 could act as a transcriptional repressor for interferon gamma-induced genes via binding to a G/C AAA G/C consensus sequence. Clearly, additional studies along these lines are required to elucidate the mechanisms underlying the effects of p44/42 MAPK on Agt, Nrf2, and hnRNP F/K transcription.
Interestingly, Nrf2 overexpression prevented—whereas Nrf2 siRNA enhanced—insulin inhibition of Nrf2 and Agt gene transcription in IRPTCs. These effects could be explained by the presence of Nrf2-RE in both Nrf2 (48) and Agt (11) promoters. Nrf2 may exert a positive auto-feedback on Nrf2 transcription (48).
The precise mechanism by which hnRNP F/K mediate insulin downregulation of renal Nrf2 gene expression in diabetes remains unclear. One possibility is that hnRNP F/K bind to putative DNA-RE (tentatively designated as “IRE”) in Nrf2 gene promoter, subsequently suppressing Nrf2 gene transcription. This possibility is supported by our finding that hnRNP F/K overexpression considerably decreases Nrf2 gene promoter activity, and hnRNP F/K siRNA reverse insulin downregulation of Nrf2 gene transcription. DNA sequence analysis discerned 2 GC-rich regions, nucleotides N-463 to N-444 (5′-cgcgccccgcccccgcggga-3′) and N-607 to N-592 (5′-ggggcccgggctccc-3′), in the Nrf2 gene promoter. Nucleotides N-463 to N-444 contain the core sequence 5′-ccccgcccc-3′, which is homologous to the core sequence of IRE (N-882 to N-855; 5′-cctcccttcccgcccttcactttctagt-3′) of the rat Agt gene promoter (20, 21). Deletion of N-463 to N-444, but not N-607 to N-592, in the Nrf2 gene promoter markedly reduces insulin- and hnRNP F/K-downregulation of Nrf2 gene promoter activity in IRPTCs. Moreover, biotinylated-labeled IRE (N-463 to N-444) specifically binds to RPTC nuclear proteins, and the addition of antihnRNP F or antihnRNP K antibody yields a supershift of biotinylated-labeled IRE binding with nuclear proteins on EMSA. These data demonstrate that hnRNP F/K bind to a putative IRE (N-463 to N-444) and inhibit Nrf2 gene transcription. It is noteworthy that hnRNP F/K are not restricted to Nrf2 gene expression but also affect the expression of Agt (20, 21), Ace2 (30), and other genes (49, 50).
In RPTCs of hyperinsulinemic-euglycemic mice, insulin suppressed Agt, Nrf2, and HO-1 expression and stimulated hnRNP F/K expression. Its effect was rapid (3 hours after hyperinsulinemia) compared with insulin implants in Akita mice (after 4 weeks of insulin implantation). Such rapid transcription is consistent with other studies of upregulated and downregulated genes in muscles and liver within 2 to 4 hours under euglycemic-hyperinsulinemic conditions (14, 15). This would indicate that insulin could directly impact renal Nrf2 and Agt gene expression, in addition to its glucose-lowering action.
Finally, post hoc analysis of bardoxolone methyl failure in the BEACON trial suggests that the adverse effects in treated patients might be mediated through the endothelin 1 pathway (51, 52). It has been noted (53), however, that bardoxolone methyl heightened SBP and worsened albuminuria, whereas selective ET-A antagonists lessened them in the Efficacy and Safety of Pirfenidone in Patients With Idiopathic Pulmonary Fibrosis trial (54). Our study demonstrates that insulin treatment prevents oltipraz and Nrf2 stimulation of Agt gene expression, suggesting that chronic Nrf2 activation by hyperglycemia and/or Nrf2 activator(s) may exaggerate renal dysfunction via activation of the intrarenal RAS, thereby enhancing renal fluid and salt reabsorption.
In summary, our data demonstrate that insulin inhibits Nrf2 gene transcription and prevents Nrf2 stimulation of intrarenal Agt gene expression via hnRNP F/K, indicating that Nrf2 activation may amplify renal dysfunction via intrarenal RAS activation in diabetes. Our study identifies renal hnRNP F/K and Nrf2 as potential targets for the treatment of hypertension and kidney injury in diabetes.
Abbreviations:
- ACR
albumin/creatinine ratio
- Agt
angiotensinogen
- Ang II
angiotensin II
- Cat
catalase
- cDNA
complementary DNA
- DHE
dihydroethidium
- DMEM
Dulbecco’s modified Eagle medium
- EMSA
electrophoretic mobility shift assay
- GFR
glomerular filtration rate
- HG
high glucose
- hnRNP F
heterogeneous nuclear ribonucleoprotein F
- hnRNP K
heterogeneous nuclear ribonucleoprotein K
- HO-1
heme oxygenase-1
- IRE
insulin-responsive element
- IRPTC
immortalized renal proximal tubular cell
- Keap1
Kelch-like ECH-associated protein 1
- KW
kidney weight
- MAPK
mitogen-activated protein kinase
- mRNA
messenger RNA
- NADPH
nicotinamide adenine dinucleotide phosphate
- NG
normal glucose
- Nrf2
nuclear factor erythroid 2–related factor 2
- PCR
polymerase chain reaction
- RAS
renin-angiotensin system
- RE
responsive element
- ROS
reactive oxygen species
- RPT
renal proximal tubule
- RPTC
renal proximal tubular cell
- RT-qPCR
real-time quantitative polymerase chain reaction
- SBP
systolic blood pressure
- SEM
standard error of the mean
- siRNA
small interfering RNA
- T1D
type 1 diabetes
- TL
tibia length
- WB
Western blotting
- WT
wild-type.
Acknowledgments
We thank the rodent metabolic phenotyping core facility of the Centre de recherche du Centre hospitalier de l’Université de Montréal for assistance with the hyperinsulinemic-euglycemic clamp studies. The data from this study were presented, in part, as poster communications at the Annual Meeting of the American Society of Nephrology, Philadelphia, Pennsylvania, November 12–16, 2014, and Chicago, Illinois, November 15–20, 2016.
This work was supported by grants from the Canadian Institutes of Health Research [MOP-84363, MOP-106688, and MOP-142378 (to J.S.D.C.), MOP-86450 (to S.-L.Z.), and MOP-97742 (to J.G.F.)], the Canadian Diabetes Association [NOD_OG-3-14-4472-JC (to J.S.D.C.)], and the National Institutes of Health [HL-48455 (to J.R.I.)]. T.A. was supported by a salary award from Fonds de recherche du Québec - Santé. C.-S.L. was the recipient of a fellowship from the Montreal Diabetes Research Centre of the Centre de recherche du Centre hospitalier de l’Université de Montréal (CRCHUM). Editorial assistance was provided by the CRCHUM Research Support Office and Ovid Da Silva.
Author contributions: J.S.D.C. is the guarantor of this work, has full access to all study data, takes responsibility for data integrity and the accuracy of data analysis, and contributed to study conception and design and drafted and reviewed/edited the final manuscript. A.G., S.A., S.Z., Y.S., C.-S.L., I.C., T.A., and S.-L.Z. performed the in vivo and in vitro experiments and data collection. S.-L.Z., J.G.F., and J.R.I. added to the discussion and reviewed/edited the manuscript. All authors were involved in data analysis and interpretation, and critical manuscript revision, and gave final manuscript approval.
Disclosure Summary: The authors have nothing to disclose.
References
Author notes
These authors contributed equally to this study.
These authors are joint senior authors.
Address all correspondence and requests for reprints to: John S.D. Chan, PhD, Centre de recherche du Centre hospitalier de l’Université de Montréal (CRCHUM), 900 Saint-Denis St., Montreal, Quebec H2X 0A9, Canada. E-mail: [email protected].
