


Abstract
Maternal obesity is a risk factor for offspring obesity. The melanocortin 4 receptor (Mc4r) is one of the mediators of food intake and energy balance. The present study examined the epigenetic mechanisms underlying altered Mc4r levels in the hypothalamic paraventricular nucleus in the offspring of high-fat diet (HFD)-induced obese dams and sought to elucidate the role of thyroid hormones in epigenetic regulation and tagging of their nucleosome at the Mc4r promoter. Female Wistar rats were fed an HFD or standard chow from weaning through gestation and lactation. Epigenetic alterations were analyzed in the offspring on postnatal day 21 at the Mc4r promoter using chromatin immunoprecipitation and bisulfite sequencing. To study the role of triiodothyronine (T3) in Mc4r downregulation, dams received methimazole (MMI), an inhibitor of thyroid hormone production. Offspring of HFD-fed dams had a greater body weight, elevated plasma T3 concentrations, and lower Mc4r messenger RNA levels than controls. At the Mc4r promoter, offspring of HFD-fed mothers demonstrated increased histone 3 lysine 27 acetylation (H3K27ac) with a greater association to thyroid hormone receptor-β (TRβ), an inhibitor of Mc4r transcription. Moreover, TRβ coimmunoprecipitated with H3K27ac, supporting their presence in the same complex. Maternal MMI administration prevented the HFD reduction in Mc4r levels, the increase in TRβ, and the increase in the TRβ-H3K27ac association, providing further support for the role of T3 in downregulating Mc4r levels. These findings demonstrate that a perinatal HFD environment affects Mc4r regulation through a T3 metabolic pathway involving histone acetylation of its promoter.
The offspring of obese mothers are at risk of a high birth weight, an increased fat mass, childhood resistance to insulin or leptin, and a greater tendency to develop obesity and diabetes during their lifetime (1–5). One of the mechanisms underlying obesity, previously described by our laboratory, and others, suggests that maternal nutrition affects epigenetic regulation of the pro-opiomelanocortin (Pomc) promoter, leading to malprogramming of satiety signals (6). POMC and neuropeptide Y/agouti-related protein neurons in the hypothalamic arcuate nucleus are considered “first-order” neurons, primary targets for hormones and metabolites from the periphery of the body (7). A cleavage product of POMC, α-melanocyte–stimulating hormone, activates second-order neurons in the paraventricular nucleus (PVN) and other hypothalamic nuclei through the melanocortin 3 receptor and melanocortin 4 receptor (Mc4r) (7).
Of the five known melanocortin receptors, Mc4r is most closely linked to body weight (BW) regulation (8). In the PVN, Mc4r takes part in feeding regulation, and in other brain areas, it plays a role in energy expenditure (9). Eight weeks of high-fat diet (HFD) consumption decreased hypothalamic Mc4r levels (10), severely disrupting feeding circuit homeostasis. However, the mechanisms underlying these alterations remain poorly understood. We hypothesized that the levels of Mc4r might be determined by an epigenetic code, based on both post-translational modifications of histones and DNA methylation (11, 12). These two types of epigenetic modifications maintain the structure of chromatin, either open or closed, allowing transcriptional activation or repression, respectively.
Triiodothyronine (T3) is the only physiological, high-affinity ligand for the nuclear thyroid hormone receptor (TR) (13). Mc4r levels in mice can be modulated by the binding of different TR isoforms to its binding elements (TREs). One of these TREs, on the Mc4r promoter, has been shown to be important for T3-dependent repression of Mc4r levels (14). To obtain additional insight into this cellular mechanism, we interfered with this pathway using methimazole (MMI), an anti-thyroid drug used for the treatment of hyperthyroidism in pregnant women (15). MMI blocks the synthesis of thyroid hormones by inhibiting thyroid peroxidase, which catalyzes the iodination and coupling of tyrosyl residues on thyroglobulin (16). Our results present a mechanism of gene-expression alteration in the offspring of obese dams involving T3-dependent epigenetic repression of Mc4r in the PVN.
Materials and Methods
Animals
Wistar rats (Envigo, Jerusalem, Israel) were raised at Bar-Ilan University. From postnatal day (PND) 22 to PND 80, female rats received either a HFD or standard chow. They were then mated, and their offspring were studied. Standard chow (Teklad Global rodent diet 2018SCF [18% protein, 6% fat]; Envigo) or the HFD (rodent diet D12492, with 60% fat; Research Diets, Inc., New Brunswick, NJ) was freely available. Food intake was converted to kilocalories as follows: 1 g chow diet equaled 3.1 kcal and 1 g HFD equaled 5.24 kcal. The lights were on a 12:12-hour light/dark cycle. The litter size was adjusted on PND 1 to 8 to 10 pups per litter. Only female offspring were studied. The institutional animal care and use committee approved the research, which adhered to the Guidelines for the Care and Use of Laboratory Animals, 8th edition (2011; available at http://grants.nih.gov/grants/olaw/guide-for-the-care-and-use-of-laboratory-animals.pdf).
MMI treatment
On day 10 of gestation, one-half of the HFD-fed dams and one-half of the chow-fed dams received 0.02% (weight-to-volume ratio) MMI [Sigma-Aldrich, St. Louis, MO; HFD diet subgroup given MMI (HFD–MMI) and control subgroup given MMI (C–MMI), respectively] through their drinking water until pup weaning (PND 21). The MMI protocol was adapted from Hasegawa and Wada (17) and has been used previously in our laboratory (18, 19).
Hormone analysis
Plasma concentrations of T3 and thyroxine (T4) were assessed using radioimmunoassay (RIA) kits (Cisbio Bioassays, Codolet, France), according to the manufacturer’s instructions.
Brain sections
Frozen coronal brain sections of the hypothalamus were cut using a cryostat (−1.3 to −2.12 mm from bregma according to Paxinos and Watson (20). The PVN was extracted using a truncated needle (32-gauge diameter). The PVN punches were either immersed in RNALater (Ambion, Austin, TX) or frozen in dry ice.
RNA isolation and real-time polymerase chain reaction
RNA was isolated and reverse transcribed, as described previously (6). Real-time polymerase chain reaction (PCR) was performed, in duplicates, with 10 ng of complementary DNA, in a model 7000 sequence analysis system (Applied Biosystems, Foster City, CA), with the Absolute Blue SYBR Green ROX Mix (ABgene, Epsom, UK). Dissociation curves were analyzed after each real-time PCR to confirm the presence of only 1 product and the absence of primer dimer formation. The threshold cycle (Ct) for each tested gene (X) was used to quantify the relative abundance of that gene using the formula: 2 _ (Ct gene X _ Ct standard). Hprt1 was used as a reference gene for reverse transcription-quantitative PCR (qPCR), because it is not affected by treatment. The primers were (5′→3′): Mc4r forward, GCACAGTATCGGGCGTTCTT, reverse, GAGGCCATGAGAACCAGCAT; Hprt1 forward, GCGAAAGTGGAAAAGCCAAGT, reverse, GCCACATCAACAGGACTCTTGTAG.
Chromatin immunoprecipitation analysis
Chromatin immunoprecipitation (ChIP) assays were performed using the SimpleChip Chromatin IP Kit (Cell Signaling Technology, Beverly, MA) according to the manufacturer’s instructions, with several modifications. The tissues were crosslinked with 1% formaldehyde for 10 minutes, followed by the addition of 700 µL per sample of sodium dodecyl sulfate lysis buffer (1% sodium dodecyl sulfate, 10 mM EDTA, 50 mM Tris; pH 8.1) and sonication for 7 rounds of 10 pulses each with a Vibracell Sonix (maximal power, 750 W; Sonics and Materials, Newtown, CT), at 30% maximal power to obtain 200- to 1000-bp fragments. Next, 100 µL sheared chromatin sample mixed with 400 µL ChIP buffer was used for immunoprecipitation with antibodies directed against TRβ (1:250; Abcam, Cambridge, UK) or histone 3 lysine 27 acetylation (H3K27ac; 1:250; Millipore, Darmstadt, Germany). For mock immunoprecipitation (background), normal rabbit IgG (3 µg per sample; Cell Signaling Technology) was used. DNA was isolated from each immunoprecipitate and subjected to real-time PCR with primers (5′→3′): Mc4r–TRE, promoter position −570 to −490 upstream of the coding sequence, forward, GGTGCTGCCCTGTAATCAA, reverse, CCTCTGCTTCCTTCTGACCAA; thyrotropin-releasing hormone (TRH)–TRE, promoter position −155 to −65 upstream of the coding sequence, forward, CTTGGCACCCTGGTCGAT, reverse, CCCTTCCCTTTCCCAGAATAA; irrelevant Mc4r, position −3091 to −2996 bp upstream of the coding sequence, forward, TCCCTCACCAAGTAAATCCA, reverse, CGAAATTGCTTGGCACATTA. Immunoprecipitated DNA is presented as a signal relative to 1% of the total amount of input chromatin.
DNA methylation analysis
Total DNA was isolated using TriReagent (Molecular Research Center, Cincinnati, OH) according to the manufacturer’s instructions. DNA samples were converted by bisulfite treatment using the Imprint DNA Modification kit (Sigma-Aldrich). The Mc4r promoter area, −597 to −22 bp upstream of the coding sequence, was amplified with primer pair (5′→3′) forward, TATTTTAGTAGTTTTGGTTATTG, reverse, AGGTTGGATTATTTTAAGGAGGATT. The PCR products were cloned into pGEM-T Easy plasmids (Promega, Madison, WI), followed by transformation into JM109 competent Escherichia coli cells (Promega) and plasmid purification with QIAprep Spin Miniprep kit (Qiagen, Crawley, UK). The Mc4r promoter was analyzed by sequencing (Macrogene Inc., Seoul, Korea), and the percentage of 5-methylcytosine was measured from five to six clones per rat.
Coimmunoprecipitation
PVN samples were homogenized on ice with 500 µL lysis buffer (25 mM Tris-HCl, 150 mM NaCl, 1 mM EDTA, 1% NP-40, 5% glycerol, and protease inhibitor cocktail) and immunoprecipitated with anti-TRβ antibody (5 µg per sample) overnight. For mock immunoprecipitation (background), anti-mouse IgG antibody (3 µg per sample; Millipore) was used. Antigen–antibody complexes were separated using Pierce protein A/G magnetic beads (Pierce Biotechnology, Rockford, IL). Immunoprecipitated samples and their inputs (5% of total amount of protein) were western blotted and probed with anti-H3K27ac antibody overnight. The membranes were washed and then incubated with anti-rabbit IgG horseradish peroxidase-conjugated antibody (Amersham Biosciences, Little Chalfont, UK) at room temperature for 1 hour. The chemiluminescent signal was detected using SuperSignal West Pico chemiluminescent substrate (Pierce Biotechnology) in an Image Master VDS-CL (Amersham Pharmacia Biotech, Uppsala, Sweden). The antibodies used are listed in Table 1.
Antibodies Used
| Peptide/Protein Target | Antigen Sequence (if Known) | Name of Antibody | Manufacturer, Catalog No., and/or Name of Individual Providing Antibody | Species Raised in; Monoclonal or Polyclonal | Dilution Used | RRID |
|---|---|---|---|---|---|---|
| Histone H3 Lys27 | Human histone H3aa 1-100 (acetyl K27) | Anti-acetyl histone H3 Lys27 (H3K27ac) | Abcam, Ab4729 | Rabbit; polyclonal | 1:200 | AB_2118291 |
| β-Actin | N-terminus of human β-actin | β-Actin (ACTB) | Cell Signaling Technology, catalog no. 4967 | Rabbit; polyclonal | 1:2000 | AB_330288 |
| Rabbit IgG | Rabbit IgG, whole antibody | Horseradish peroxidase-linked anti-rabbit IgG | Amersham Biosciences, catalog no. 934 | Donkey | 1:3000 | AB_772211 |
| TRβ | MNYCMPEVHE VCPAASSNCY MQVTDYLAYL EDSPALSGRD VQAVPSSSIY | Anti-thyroid hormone receptor-β | Abcam, Ab104417 | Rabbit; polyclonal | 1:250 | AB_10716599 |
| Histone H3 Lys27 | ARacKSA, in which acK corresponds to acetyl lysine27 of yest histone H3 | Anti-acetyl histone H3 Lys27 (H3K27ac) | Millipore, catalog no. 07-360 | Rabbit; polyclonal | 1:250 | AB_310550 |
| No target | Normal rabbit serum (IgG) | Cell Signaling Technology, catalog no. 2729 | Rabbit | 1:500 | AB_2617119 |
Abbreviation: RRID, Resource Identification.
Statistical analysis
Differences in messenger RNA (mRNA) levels (reverse transcription qPCR) and T3 (RIA) between the HFD and standard chow pups were analyzed using Student’s t test. In addition, we performed Pearson product-moment correlations for Mc4r mRNA levels, TR association in chromatin, and the individual rats’ BWs. Differences in methylation patterns were analyzed using χ2 analysis. For examination of MMI’s effect on BW and hormone and mRNA levels, two-way univariate analysis of variance (ANOVA) was performed, followed by tests for simple effects with least significant difference (LSD) adjustment. The ChIP results were analyzed using one-way ANOVA. Significance was set at P < 0.05, and statistical analyses were performed with SPSS, version 20.0, software (IBM Corp., Armonk, NY).
Results
Levels of Mc4r mRNA are attenuated in offspring of HFD-fed mothers and correlated negatively with BW
We previously reported that the offspring of HFD-fed dams weigh more than the offspring of chow-fed dams at PND 21 (6). This weight difference was reflected in the plasma leptin concentrations. The offspring of HFD dams presented with threefold greater concentrations than age-matched controls (6). In the present study, we found that PVN Mc4r mRNA levels in the HFD pups were lower than those in the chow pups [0.7-fold; t(19) = 2.22; P < 0.05, Fig. 1(A)]. Moreover, an overall negative correlation was found between Mc4r levels and BW [n = 21; r = −0.578; P < 0.0011; Fig. 1(B)].
![Maternal nutrition alters Mc4r mRNA levels in the offspring in correlation with BW. (A) At PND 21, pups from both HFD and chow (control [C]) groups were euthanized, and one side of their PVN was subjected to real-time PCR with Mc4r-specific primers. Relative mRNA levels in the control group were set to 1 (n = 10 to 11 per group). Data are presented as mean ± standard error of the mean; *statistically significant change compared with the control group at P < 0.05. (B) Pearson correlation showed a strong negative correlation between Mc4r mRNA levels and BW (r = −0.66; P < 0.01). White squares indicate control pups; black squares, HFD pups.](https://oup.silverchair-cdn.com/oup/backfile/Content_public/Journal/endo/158/4/10.1210_en.2016-1854/2/m_en.2016-1854f1.jpeg?Expires=1748583037&Signature=GqrS9Z-17Bzv6Bxb3Vgu1CNDf01WdJythBJ9dqMAvZSEibU51WsFb~MCH85tHh6~J7BLbXD2meqLL0iqp~P9uDPYBVcjVOY-eZjQRAyjnpP4WsRuq4U7DcI7EbbfW5h7~2g~LXCiw3Z4Ia8JAQDZQKfwG-5-DxyXk-fKRqNt-KC4X3ClF261hhXrj3RrKg5ahzvj0IPUmV0QTw-SJ~~x7GgHlhg5cL01IiUhAciZotpup0W5oV2IyyoUOVgBhCyt6tT9zxj0PGWi8Pldh8ROYElMsfpJUEsaNQLTLRfS3misduHP~twNsQDpMaU3XjzeT~dlmxbTgBgnSg1wa87KVA__&Key-Pair-Id=APKAIE5G5CRDK6RD3PGA)
Maternal nutrition alters Mc4r mRNA levels in the offspring in correlation with BW. (A) At PND 21, pups from both HFD and chow (control [C]) groups were euthanized, and one side of their PVN was subjected to real-time PCR with Mc4r-specific primers. Relative mRNA levels in the control group were set to 1 (n = 10 to 11 per group). Data are presented as mean ± standard error of the mean; *statistically significant change compared with the control group at P < 0.05. (B) Pearson correlation showed a strong negative correlation between Mc4r mRNA levels and BW (r = −0.66; P < 0.01). White squares indicate control pups; black squares, HFD pups.
A difference in epigenetic marking at the Mc4r promoter between HFD pups and controls was identified in H3K27 acetylation but not in CpG methylation
We investigated whether epigenetic regulation mediates the reduced Mc4r mRNA levels in the HFD pups. The results showed that both groups, HFD and chow, had very low CpG methylation levels at the Mc4r promoter with no substantial difference between them [Fig. 2(A)]. A second possible mechanism for regulation of Mc4r expression is post-translational histone modification. Although all modifications are potentially interesting, we focused on H3K27 acetylation, previously demonstrated to affect Mc4r levels (21). Immunoprecipitation of PVN samples with anti-H3K27ac antibody, followed by qPCR of the Mc4r promoter area, showed higher H3K27ac in the HFD pup samples than in the age-matched controls [ANOVA, F(2,25) = 9.183; P = 0.001; Fig. 2(B)].
![Exploration of epigenetic marks at the Mc4r promoter ruled out DNA 5-methylcytosine methylation but showed increased H3K27 acetylation. (A) DNA methylation at the Mc4r promoter. Methylation was evaluated using sequencing of bisulfite-treated DNA from PVN punches. The total number of methylations in each position was calculated by averaging the total methylations for all the rats in the same group (n = 6 per group, 5 to 6 colonies per rat; P = NS). (B) Evaluation of H3K27ac binding. PVN samples were immunoprecipitated with antibody against H3K27ac and subjected to qPCR with specific primers to the TRE area at position −570 to −490 bp upstream of the Mc4R coding sequence and primers to a control area, −3091 to −2996 bp upstream of the Mc4R coding sequence. Control group PCR abundance was set to 1; IgG was used as a negative control. Chow (control [C]) pups, n = 13; HFD pups, n = 9; IgG, n = 6. Data presented as mean ± standard error of mean; *statistically significant change from chow group at P < 0.05.](https://oup.silverchair-cdn.com/oup/backfile/Content_public/Journal/endo/158/4/10.1210_en.2016-1854/2/m_en.2016-1854f2.jpeg?Expires=1748583037&Signature=syGHXYfo77AOgtp4MS3uVAGROPf8VHcs~E6nyLwti5R~4TeVgLqiSIOB-1JjwWHmw8Dqd~tHGAbP6s2FEfGCcZjW~URmFSIUBwXk-sH6LQ6WJNdI7iPS6~sHEu3o9ZHUv3UrTV23FAI4FTS6Z9iJszkWum6I-R-jSHoGreAGKO9SA1outUyRFZycxR7OPRMQp5eZEHF8gS9nBmAC0QWYqzRZEC-69EYRKqPbhlZsCabtXFLnSOsnsd6C1GOtxxU9s-eQAWNAnVFhWeMh39WyMkU6z740Y8LkR1U2ayR7-a2u5oppKhgClDR2EZn-~UURs~RCGlVBMGDxwK0-HDyRZg__&Key-Pair-Id=APKAIE5G5CRDK6RD3PGA)
Exploration of epigenetic marks at the Mc4r promoter ruled out DNA 5-methylcytosine methylation but showed increased H3K27 acetylation. (A) DNA methylation at the Mc4r promoter. Methylation was evaluated using sequencing of bisulfite-treated DNA from PVN punches. The total number of methylations in each position was calculated by averaging the total methylations for all the rats in the same group (n = 6 per group, 5 to 6 colonies per rat; P = NS). (B) Evaluation of H3K27ac binding. PVN samples were immunoprecipitated with antibody against H3K27ac and subjected to qPCR with specific primers to the TRE area at position −570 to −490 bp upstream of the Mc4R coding sequence and primers to a control area, −3091 to −2996 bp upstream of the Mc4R coding sequence. Control group PCR abundance was set to 1; IgG was used as a negative control. Chow (control [C]) pups, n = 13; HFD pups, n = 9; IgG, n = 6. Data presented as mean ± standard error of mean; *statistically significant change from chow group at P < 0.05.
Elevated T3 concentrations and TRβ association with the Mc4r promoter in HFD pups correlated with Mc4r mRNA expression and BW
Epigenetic alterations might affect the association of some regulators of the Mc4r promoter. In silico analysis of the Mc4r promoter revealed several regulatory elements with potential protein–DNA interactions [Fig. 3(A)]. One of these—the TRE—was previously shown to regulate Mc4r levels in hyper- and hypothyroid animals (22). Using ChIP analysis, we found a significantly greater association of TRβ to the Mc4r promoter in the HFD pups than in the chow pups [ANOVA, F(2,15) = 7.220; P = 0.006; Fig. 3(B)]. In addition, the overall TR association correlated positively with individual BW [n = 12; r = 0.668; P < 0.05; Fig. 3(C)] and negatively with Mc4r levels [n = 12; r = 0.738; P < 0.01; Fig. 2(D)]. The increased TR association did not result from greater TRβ production, because no between-group difference was found in the mRNA levels (data not shown).
![Mc4r mRNA levels of offspring of HFD-fed mothers are determined by TRβ association and H3K27ac. (A) Schematic illustration of the regulatory elements in the Mc4r promoter. (B) PVN samples were immunoprecipitated with antibody against TRβ and subjected to qPCR with specific primers to the TRE area at position −570 to −490 bp upstream of the Mc4R coding sequence (Mc4R–TRE), primers to the TRE area at position −155 to −65 bp upstream of the TRH coding sequence (TRH–TRE; positive signal control), and primers for a distant position −3091 to −2996 bp upstream of the Mc4R coding sequence (control). Immunoprecipitation with normal rabbit IgG was used as a background. Chow (control [C] group) pups, n = 9; HFD pups, n = 5; IgG, n = 4. Data presented as mean ± standard error of mean; *P < 0.05. (C) Correlation between TRβ association and TRE and BW of individuals from both HFD and control pup groups (r = 0.668; P < 0.05). White squares indicate chow (control) pups; black squares, HFD pups. (D) Correlation between TRβ association and TRE and Mc4r mRNA levels in individuals from both HFD and control groups (r = −0.74; P < 0.05). White squares indicate control pups; black squares, HFD pups. (E) Plasma T3 concentrations assessed with RIA kit (control pups, n = 14; HFD pups, n = 15). Data presented as mean ± standard error of mean; *P < 0.05. (F) Correlation between T3 levels and BW (r = 0.834; P < 0.001). White squares indicate control pups; black squares, HFD pups. (G) Coimmunoprecipitation of TRβ with H3K27ac. PVN samples were immunoprecipitated with anti-TRβ antibody followed by western blot using anti-H3k27ac or anti-mouse IgG antibodies. The two independent blots are presented. Each treated group included PVN pooled from two animals. The size of the presented band is 17 kD. CDS, coding sequence; Cont, control; CRE, cAMP response element; HF, high fat, IP-TR, immunoprecipitation of thyroid hormone receptor; nTRE, negative thyroid hormone receptor element; TSS, transcription start site.](https://oup.silverchair-cdn.com/oup/backfile/Content_public/Journal/endo/158/4/10.1210_en.2016-1854/2/m_en.2016-1854f3.jpeg?Expires=1748583037&Signature=UYJMz30rOyzxID4AJ7fm--73-TJkNCWmDZnriakrNiNQ0v0WgaXLVSedLsVWfK8aFeTRE9VcgZTW09Q5Afkb47jL3aHPkSU06pX-ZcyW3ezR2huiPBqTPHv7O3BYY~tX4TFNg7A1ohz0WfgCuuKf0DfkVWJ0c0uc4qrLg-mlCq6G65ho6L3YdHnVKUkj7YR-kkbWoFnVswSJONxe0nA0miLAXgZQ84x45q5sVEfSma8wtZGjrid1XYWZvlSdko~QlRUytI0GzVxCQmZymSEzxnz9ezGjBeNyDnlmiSABEr3ORLj36h-9Kq0bAtF4FF57TDQ9Y0Z1~AXaNLdOoTP4HA__&Key-Pair-Id=APKAIE5G5CRDK6RD3PGA)
Mc4r mRNA levels of offspring of HFD-fed mothers are determined by TRβ association and H3K27ac. (A) Schematic illustration of the regulatory elements in the Mc4r promoter. (B) PVN samples were immunoprecipitated with antibody against TRβ and subjected to qPCR with specific primers to the TRE area at position −570 to −490 bp upstream of the Mc4R coding sequence (Mc4R–TRE), primers to the TRE area at position −155 to −65 bp upstream of the TRH coding sequence (TRH–TRE; positive signal control), and primers for a distant position −3091 to −2996 bp upstream of the Mc4R coding sequence (control). Immunoprecipitation with normal rabbit IgG was used as a background. Chow (control [C] group) pups, n = 9; HFD pups, n = 5; IgG, n = 4. Data presented as mean ± standard error of mean; *P < 0.05. (C) Correlation between TRβ association and TRE and BW of individuals from both HFD and control pup groups (r = 0.668; P < 0.05). White squares indicate chow (control) pups; black squares, HFD pups. (D) Correlation between TRβ association and TRE and Mc4r mRNA levels in individuals from both HFD and control groups (r = −0.74; P < 0.05). White squares indicate control pups; black squares, HFD pups. (E) Plasma T3 concentrations assessed with RIA kit (control pups, n = 14; HFD pups, n = 15). Data presented as mean ± standard error of mean; *P < 0.05. (F) Correlation between T3 levels and BW (r = 0.834; P < 0.001). White squares indicate control pups; black squares, HFD pups. (G) Coimmunoprecipitation of TRβ with H3K27ac. PVN samples were immunoprecipitated with anti-TRβ antibody followed by western blot using anti-H3k27ac or anti-mouse IgG antibodies. The two independent blots are presented. Each treated group included PVN pooled from two animals. The size of the presented band is 17 kD. CDS, coding sequence; Cont, control; CRE, cAMP response element; HF, high fat, IP-TR, immunoprecipitation of thyroid hormone receptor; nTRE, negative thyroid hormone receptor element; TSS, transcription start site.
RIA analysis of TRβ ligands—the thyroid hormones—in the plasma revealed greater T3 concentrations in HFD pups compared with the controls [n = 14 to 15 per group; t(27) = 6.582; P < 0.001; Fig. 3(E)]. Moreover, the T3 concentrations correlated positively with individual BW [n = 29; r = 0.834; P < 0.001; Fig. 3(F)]. The T4 levels were not significantly different between the groups (data not shown).
To demonstrate a direct interaction between TRβ and H3K27ac modification, both components were coprecipitated. PVN samples were precipitated with anti-TRβ antibody and then blotted with anti-H3K27ac antibody. This demonstrated greater interaction between the proteins in the HFD pups. Moreover, the total H3K27ac level (input sample) was also greater in the offspring of obese dams [Fig. 3(G)].
MMI treatment of HFD-fed mothers reversed the obese phenotype in their offspring
To substantiate our hypothesis that T3 regulates Mc4r transcription, we used a pharmacological intervention that decreases the production of T3 and T4. MMI blocks the synthesis of thyroid hormones by inhibiting thyroid peroxidase, the catalyst of iodination and coupling of tyrosyl residues to the thyroglobulin (16). Two-way ANOVA showed that MMI prevents the HFD-induced increase in the T3 concentration in treated animals with a substantial interaction between diet and treatment [F(1,62) = 35.68; P < 0.001]. Overall, HFD significantly increased the plasma T3 concentration [F(1,62) = 22.80; P < 0.001], and MMI significantly reduced it [F(1,62) = 208.28; P < 0.001; Fig. 4(A)]. The plasma T4 concentration was downregulated by MMI treatment [F(1,61) = 981.14; P < 0.001] in both MMI-treated groups [F(1,68) = 981.14; P < 0.0001; Fig. 4(B)].
![MMI treatment of HFD-fed mothers reversed the obese phenotype of their offspring. Female Wistar dams raised with HFD or chow (control [C] group) from weaning to adulthood were mated with a chow-fed male. Ten days after conception until PND 21, one-half of each group of dams received MMI in their drinking water (0.02%), and the other dams continued to drink regular water. At PND 21, all pups were weighed and euthanized, and plasma samples and PVN punches were collected. (A) T3 and (B) T4 assayed with RIA kit; C-pups, n = 14; C–MMI, n = 15 to 16; HFD-pups, n = 15 to 16; HFD–MMI, n = 21. (C) BW, n = 9 to 11 per group. (D) Mc4r mRNA levels measured by qPCR (n = 18 to 20 per group). (E) PVN samples were immunoprecipitated with antibodies to TRβ and then subjected to qPCR with specific primers to the TRE area at position −570 to −490 bp upstream of the Mc4R coding sequence and primers to area −3091 to −2996 bp upstream as a control. Control PCR abundance was set to 1; IgG was used as a negative control; C-pups, n = 8/group; C–MMI, n = 4 to 5 per group; HFD pups, n = 5 per group; HFD–MMI, n = 4 per group; IgG, n = 3 to 4 per group. (F) Samples were immunoprecipitated with antibodies to H3K27ac and treated as in (E); C-pups, n = 12 to 13/group; C–MMI, n = 4 to 5 per group; HFD-pups, n = 9 to 10 per group; HFD–MMI, n = 4 per group; IgG, n = 5 to 8 per group. Data presented as mean ± standard error of mean; *P < 0.05.](https://oup.silverchair-cdn.com/oup/backfile/Content_public/Journal/endo/158/4/10.1210_en.2016-1854/2/m_en.2016-1854f4.jpeg?Expires=1748583037&Signature=Xv2ACQhFChVxLd0DIoWyAweU2YO-V4IqOLzADd3jzc4dlE1ha9NbeGgzXkJgFo0mcvxlPlbULQcnaG-NucXBcDs13I1nJmtB6UnFGP2kEH3k1e7O5yKe~7LgGkHdpY-5Z1lMo4~MeF7UPvUpD5XADdO3j8P6AwvBV5Z3l1IrIS9roW63wMw3oqxR22zFgoaAzi~LDTUlWsngoqq6aXQzgO0nQIRKql0FyK5njQtHDU2m5TO87b3AvwG4MNPk1foiIBABLbcAnWrJ9KbRcN21U~Q9a6aKlZyM0KuO5vpJPyQSlDXbOngl-Kcb08LfdxxIrmtRvOiVfibcjYOw-Rmu6Q__&Key-Pair-Id=APKAIE5G5CRDK6RD3PGA)
MMI treatment of HFD-fed mothers reversed the obese phenotype of their offspring. Female Wistar dams raised with HFD or chow (control [C] group) from weaning to adulthood were mated with a chow-fed male. Ten days after conception until PND 21, one-half of each group of dams received MMI in their drinking water (0.02%), and the other dams continued to drink regular water. At PND 21, all pups were weighed and euthanized, and plasma samples and PVN punches were collected. (A) T3 and (B) T4 assayed with RIA kit; C-pups, n = 14; C–MMI, n = 15 to 16; HFD-pups, n = 15 to 16; HFD–MMI, n = 21. (C) BW, n = 9 to 11 per group. (D) Mc4r mRNA levels measured by qPCR (n = 18 to 20 per group). (E) PVN samples were immunoprecipitated with antibodies to TRβ and then subjected to qPCR with specific primers to the TRE area at position −570 to −490 bp upstream of the Mc4R coding sequence and primers to area −3091 to −2996 bp upstream as a control. Control PCR abundance was set to 1; IgG was used as a negative control; C-pups, n = 8/group; C–MMI, n = 4 to 5 per group; HFD pups, n = 5 per group; HFD–MMI, n = 4 per group; IgG, n = 3 to 4 per group. (F) Samples were immunoprecipitated with antibodies to H3K27ac and treated as in (E); C-pups, n = 12 to 13/group; C–MMI, n = 4 to 5 per group; HFD-pups, n = 9 to 10 per group; HFD–MMI, n = 4 per group; IgG, n = 5 to 8 per group. Data presented as mean ± standard error of mean; *P < 0.05.
In addition, the offspring of MMI-treated dams had a lower BW than their parallel diet counterparts that received water [one-way ANOVA, F(3,63) = 298.05; P < 0.001]. An LSD post hoc test revealed that with the chow diet, MMI reduced the pups’ BW, with a statistically significant difference (24.33 ± 0.62 g; P < 0.001), compared with the water control (41 ± 0.5 g). With the HFD diet, MMI reduced the pups’ BW to that of the chow pups' BW [41 ± 1.16 g; Fig. 4(C)].
Although the MMI effect on BW did not interact with the diet condition (tested with two-way ANOVA), qPCR analysis of Mc4r mRNA levels showed an important interaction between diet and treatment factors [F(1,34) = 4.814; P < 0.05], with the HFD pups that did not receive MMI presenting with significantly lower Mc4r mRNA levels compared with the other groups [Fig. 4(D)].
We used the ChIP assay to determine whether MMI changed the degree of TRβ association with the Mc4r TRE area in the offspring of HFD-fed dams. We found that MMI significantly reduced this association by 72% in the HFD–MMI group compared with the HFD pups [one-way ANOVA; F(4,23) = 4.19; P < 0.05, with post hoc LSD tests, P < 0.05, compared with control pups; Fig. 4(E)]. Furthermore, because we hypothesized that the TRβ association levels would be associated with H3K27ac, we tested the level of this modification at the Mc4r promoter site. MMI treatment reduced the levels of H3K27ac in the control offspring by 60% and reversed the increase in H3K27ac caused by maternal HFD nutrition by almost 50%, back to the level of the control offspring [one-way ANOVA; F(4,32) = 4.80; P < 0.01; with post hoc LSD tests, P < 0.05; Fig. 4(F)]. Immunoprecipitation with IgG antibody served as a background control.
Discussion
Although much attention has been paid to the role of Mc4r function in the development of obesity, the mechanisms underlying Mc4r levels were unknown. In the present study, we found that obesity is accompanied by a reduction in Mc4r mRNA levels, increased plasma T3 concentrations, and elevated TRβ association with H3K27ac at the TRE on the Mc4r promoter. Furthermore, we found that TRβ and H3K27ac are crosslinked when coimmunoprecipitated. Taken together, these data suggest a possible complex that involves recruitment of histone acetyltransferase enzymes by TRβ.
The offspring of HFD-fed mothers had a higher BW than that of the controls at weaning (data not shown). The increased BW might have result from one or several of the following factors: (1) differences in the maternal milk components (23); (2) exposure of the offspring to HFD nutrition, because a few days before the “official” weaning age, the rats start to independently ingest food; and (3) malformation of the hypothalamic metabolic circuits due to the HFD-enriched maternal environment.
In a previously reported cross-fostering study, the offspring of chow-fed dams that were fostered by HFD-fed dams during the lactation period gained more BW and had greater adiposity and impaired leptin signaling than did the HFD pups fostered by chow-fed dams (24). We found a generally similar pattern in cross-fostering studies that used a different model of obesity (25–27). This, with the accumulating evidence for the effects of maternal nutrition on the development of feeding-regulation circuits in offspring (28, 29), suggests that the excessive BW of the offspring in the present study was more likely to have resulted from consumption of high-fat maternal milk during the nursing period resulting from the maternal diet.
Assessment of Mc4r mRNA levels at the weaning age revealed significantly lower levels in HFD pups compared with controls [Fig. 1(A)]. These results are in agreement with another study in which 8 weeks of HFD decreased Mc4r levels in several hypothalamic nuclei (10). Moreover, our results showed that the overall Mc4r levels correlated negatively with BW [Fig. 1(B)], strengthening the association between maternal HFD and Mc4r downregulation in the offspring. The offspring of HFD dams weighed more and presented with a greater concentration of leptin hormone than age-matched controls (6). Leptin signaling in PVN TRH neurons occurs by both direct activation and an indirect pathway involving Mc4r (30, 31). It should be noted that in addition to the PVN, Mc4rs are expressed in other brain areas, such as the nucleus tractus solitarius, where they are also involved in regulating food intake (32). The regulation of its levels in those areas might also involve epigenetic alterations; however, this was not explored in the present study.
Long-term repression of Mc4r levels can be driven by alterations in epigenetic marks. Analysis of the Mc4r promoter showed very low CpG methylation in both HFD and chow pups [Fig. 2(A)]. In contrast, a study previously conducted on 2 mouse strains showed reduced DNA methylation in the Mc4r exon after HFD consumption (33). The contradictory findings can be explained by the different genomic areas that were tested (exon vs promoter), the different spatial location examined in the brain (whole hypothalamus vs PVN), and the different developmental stages of exposure to HFD (maturation vs perinatal). Alteration in Mc4r gene levels can also be explained by local histone posttranslational modifications near the promoter.
The H3K27ac mark has been previously associated with accessible chromatin structures of promoter sites (34). Therefore, we hypothesized that acetylation is involved in opening the regulatory area of Mc4r to allow the association of repressors such as TRβ with the DNA. We found increased association levels of TRβ in the pups of HFD-treated mothers compared with the control group [Fig. 3(B)]. Furthermore, the overall TRβ association levels correlated positively with BW and negatively with Mc4r mRNA levels of the individual rats [Fig. 3(C) and 3(D)] and were found to be linked to H3K27ac modification [Fig. 3(G)]. This mechanism is strengthened by previous reports of TSH’s negative regulation by thyroid hormone in a histone acetylation-associated manner, when T3 treatment triggered the release of a corepressor complex composed of histone deacetylase 3, transducin β-like protein 1, and nuclear receptor corepressor/silencing mediator for retinoic and TR from the TSH promoter (35). Microarray analysis also showed that some of the TR negatively regulated genes with increased histone acetylation marks (35).
The regulation of Mc4r gene levels is probably a concerted result of the activity of several transcription factors. In the present study, we focused on the role of TRβ. It should be noted that in the same promoter’s vicinity, other potentially relevant transcription factor binding sites are present, such as the binding site for cyclic adenosine monophosphate, the cyclic adenosine monophosphate response element-binding protein [Fig. 3(A)]. TRs have been previously shown to inhibit the transcriptional activity of cyclic adenosine monophosphate response element-binding protein and to repress the activation of CRE-containing promoters (36). Further research is needed to investigate whether this is the case in Mc4r regulation. T3 is the only physiological, high-affinity ligand for nuclear TRs (13). The T3 concentration in the circulation of HFD pups was greater than that in the controls [Fig. 3(E)], but the T4 levels were not significantly different between groups. Thus, we suggest that TR recruitment to the TRE in the HFD pups might be the outcome of the greater availability of T3 in the brain, driven from the circulation.
To make a strong case for T3 involvement in the regulation of Mc4r by way of an epigenetic mechanism, a correlative approach is not enough; an interventional approach is needed. Thus, we used a pharmacological inhibitor of thyroid hormone production. MMI and propylthiouracil (PTU) are the standard anti-thyroid drugs used in the treatment of hyperthyroidism in pregnant women. MMI causes a specific pattern of rare teratogenic effects after first-trimester exposure, and PTU therapy can be followed by rare but severe hepatotoxic sequelae. Therefore, PTU has been recommended for treatment of maternal hyperthyroidism during the first trimester of pregnancy, and MMI is recommended for use after the first trimester (37). To determine the medical effect on the offspring, we administered MMI to pregnant dams from the second half of gestation through lactation at a commonly used dose in rats (0.02%) (38, 39).
The pharmacological treatment with MMI lowered T3 and T4 concentrations, as expected [Fig. 4(A) and 4(B)] and reduced the BW in both treated groups. However, the HFD–MMI subjects remained heavier than the C–MMI pups [Fig. 4(C)]. An overdose of MMI treatment can cause developmental delay (40); therefore, the reduction in BW found in the present study, as in others, might represent retarded growth in both C–MMI and HFD–MMI offspring. However, we were interested in the effect of MMI-induced thyroid hormone depletion on the Mc4R levels. A comparison of PVN Mc4r mRNA levels showed that the MMI offspring groups (C–MMI and HFD–MMI) did not differ significantly from those of the control pups [Fig. 4(D)]; therefore, MMI treatment prevented the HFD downregulation effect. Similarly, MMI prevented the upregulation of TRβ binding and the increase in H3K27ac in HFD pups [Fig. 4(E) and 4(F)], confirming our suggested connection between TRβ association and H3K27ac modification.
In conclusion, we suggest a model for the epigenetic downregulation of Mc4r in obese offspring of HFD-fed mothers. Usually, a HFD will signal “overeating” through leptin activation of the ObRb receptor, which, in turn, will activate the expression of POMC as a prehormone of α-melanocyte–stimulating hormone, which binds to the Mc4r, activating its pathway. In the present study, we have demonstrated a possible pathway for obesity driven by upregulation of T3, increased association of TRβ, and elevation of H3K27 acetylation at the Mc4r promoter (Fig. 5). These findings open another avenue for the development of novel potential treatments of childhood obesity by Mc4r regulation by T3, which might prevent, or at least reduce, the risks and complications associated with excessive BW.
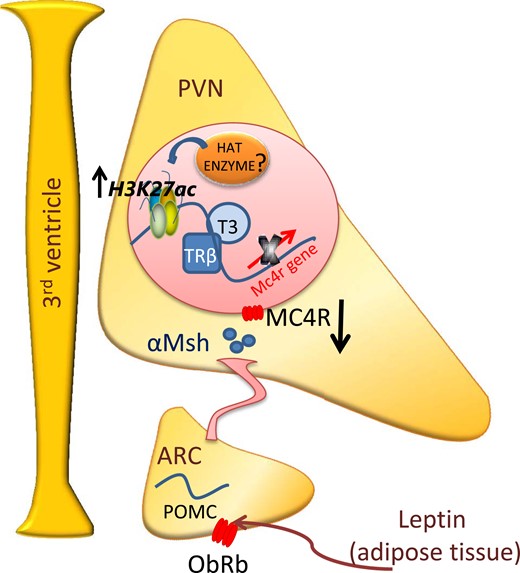
Schematic illustration of the proposed thyroid hormone regulation of Mc4r mRNA levels in offspring of HFD dams. Offspring of HFD dams presented with lower POMC (6) and greater plasma T3 concentrations. On reaching the PVN, T3 is transported into the neurons, inducing the association of its receptor to the Mc4r promoter. This association is accompanied by upregulation of H3K27ac and is involved in the downregulation of Mc4r mRNA levels in the offspring of obese dams. ARC, arcuate nucleus; HAT, histone acetyltransferase; αMsh, α-melanocyte–stimulating hormone.
Abbreviations:
- BW
body weight
- ChIP
chromatin immunoprecipitation
- C–MMI
control subgroup given methimazole
- Ct
threshold cycle
- H3K27ac
histone 3 lysine 27 acetylation
- HFD
high-fat diet
- HFD–MMI
HFD diet subgroup given methimazole
- LSD
least significant difference
- Mc4r
melanocortin 4 receptor
- MMI
methimazole
- mRNA
messenger RNA
- PCR
polymerase chain reaction
- PND
postnatal day
- POMC
pro-opiomelanocortin
- PTU
propylthiouracil
- PVN
paraventricular nucleus
- qPCR
quantitative polymerase chain reaction
- RIA
radioimmunoassay
- T3
triiodothyronine
- T4
thyroxine
- TR
thyroid hormone receptor
- TRE
thyroid hormone receptor binding element
- TRH
thyrotropin-releasing hormone.
Acknowledgments
This research was supported by the Israel Science Foundation (Grant 1781/16) and the Israel Poultry Board (Grant 356065414).
Disclosure Summary: The authors have nothing to disclose.
References
Author notes
Address all correspondence and requests for reprints to: Aron Weller, PhD, Department of Psychology, Bar-Ilan University, Ramat-Gan 5290002, Israel. E-mail: [email protected].
