


Abstract
Pulsatile insulin release is the primary means of blood glucose regulation. The loss of pulsatility is thought to be an early marker and possible factor in developing type 2 diabetes. Another early adaptation in islet function to compensate for obesity is increased glucose sensitivity (left shift) associated with increased basal insulin release. We provide evidence that oscillatory disruptions may be linked with overcompensation (glucose hypersensitivity) in islets from diabetes-prone mice. We isolated islets from male 4- to 5-week-old (prediabetic) and 10- to 12-week-old (diabetic) leptin-receptor-deficient (db/db) mice and age-matched heterozygous controls. After an overnight incubation in media with 11 mM glucose, we measured islet intracellular calcium in 5, 8, 11, or 15 mM glucose. Islets from heterozygous 10- to 12-week-old mice were quiescent in 5 mM glucose and displayed oscillations with increasing amplitude and/or duration in 8, 11, and 15 mM glucose, respectively. Islets from diabetic 10- to 12-week-old mice, in contrast, showed robust oscillations in 5 mM glucose that declined with increasing glucose. Similar trends were observed at 4–5-weeks of age. A progressive left shift in maximal insulin release was also observed in islets as db/db mice aged. Reducing glucokinase activity with 1 mM D-mannoheptulose restored oscillations in 11 mM glucose. Finally, overnight low-dose cytokine exposure negatively impacted oscillations preferentially in high glucose in diabetic islets compared with heterozygous controls. Our findings suggest the following: 1) islets from frankly diabetic mice can produce oscillations, 2) elevated sensitivity to glucose prevents diabetic mouse islets from producing oscillations in normal postprandial (11–15 mM glucose) conditions, and 3) hypersensitivity to glucose may magnify stress effects from inflammation or other sources.
Under normal physiological conditions, pancreatic β-cells release insulin in discrete pulses approximately every 5 minutes, and the amplitude of these pulses increases with increasing blood glucose to maintain energy homeostasis (1–3). This sophisticated system of pulse generation balances energy supply and demand to tightly regulate blood glucose whether fasting, feasting, sleeping, or exercising. Pulsatility is disrupted or absent in type 2 diabetes (T2D) (4–6) and in conditions of obesity (7, 8) and hypertension (9) to a lesser extent. Even close relatives of diabetic patients show disrupted pulsatility, suggesting that the loss of pulsatility may be an early warning sign of metabolic dysfunction (10–12). At the cellular level in vitro, nonpulsatile mouse islets showed reduced glucose-stimulated insulin secretion and disrupted intracellular calcium ([Ca2+]i) handling compared with pulsatile islets (13). Finally, patients with diabetes generally respond more effectively to pulsatile insulin compared with continuous delivery (14) due to enhanced hepatic insulin clearance and hepatic function (15–17). These findings speak to the importance of maintaining pulsatile insulin release and to the loss of pulsatility as a potential early marker of islet dysfunction in T2D.
Another important alteration in the early stages of T2D is a left shifting of glucose sensitivity in pancreatic islets, resulting in elevated insulin release rates during fasting conditions. Relative hyperinsulinemia (an elevated fasting insulin level relative to glucose level) has been observed in several diabetes-prone populations (18, 19), and several lines of evidence suggest that hyperinsulinemia may play a primary pathogenic role in T2D. Hypersecretion of insulin is one of the earliest detectable changes in metabolism in diabetes-prone individuals (20–22), in nonhuman primates that can be more closely monitored (23), and in several rodent models of T2D (24–28). Moreover, in a large study of nondiabetic obese Europeans, elevated basal serum insulin levels were observed more commonly than signs of insulin resistance (29). Another prospective study showed that basal hyperinsulinemia in healthy normoglycemic adults was predictive of T2D in the next 20+ years (21).
Hypersecretion of insulin can be explained by a left shift in glucose sensitivity in the β-cell (30, 31). A new mathematical model suggests that this left shift in glucose sensitivity is a first-line defense in maintaining glucose homeostasis in the face of increased insulin demand (32), as evidenced by recent studies demonstrating a left shift can be stimulated by excess nutrients in the form of intracellular lipids (33) or chronic exposure to high glucose (34) or, alternatively, by reducing secretory capacity after partial pancreatectomy (35, 36). We suggest that in diabetes-prone situations, however, this compensatory response is hypersensitive to the demands, resulting in excess insulin secretion in fasting conditions and significantly impaired responses in postprandial conditions. In the present study, we first show that the ability to produce oscillations is not lost in islets from diabetic mice; however, hypersensitivity to glucose is associated with a left shift in the normal oscillatory range to much lower glucose concentrations. Moreover, in higher acute glucose challenges, calcium levels are elevated but nonoscillatory, and this is associated with impaired insulin secretion. We also demonstrate that reducing rates of glucose metabolism by slightly reducing glucokinase activity restores normal oscillatory function to islets from db/db mice during higher acute glucose challenges. Finally, we show that the greatest impact of proinflammatory cytokines on diabetic islets occurs when islets are acutely exposed to high glucose, suggesting that right-shifting glucose sensitivity by partial glycolytic inhibition could improve tolerance to stressful conditions in islets from diabetic mice. Collectively these data suggest that islets from diabetes-prone environments are more susceptible to disruptions in normal oscillatory activity, which may further contribute to islet dysfunction, reductions in hepatic signaling, and the loss of glucose homeostasis.
Materials and Methods
Mice
Male db/db mice (BKS.Cg-Dock7m−/− Leprdb/J) at 4–12 weeks of age and age-matched heterozygous male mice were used for these studies. The db/db mice harbor a mutation in the leptin receptor, causing these mice to rapidly gain weight and develop hyperglycemia, typically at approximately 6–8 weeks of age. Although the db/db mouse is only one model of T2D and may not fully represent the human form of the disease, the changes in islet function in our mice closely follow the five-stage progression of β-cell decline and failure thought to occur in T2D (22). We chose db/db mice at 4–5 weeks of age because they are generally not yet hyperglycemic or substantially obese and at 10–12 weeks of age when hyperglycemia is fairly well established. Ages 6–9 weeks were not used because of the variability in disease onset. Mice were purchased from Jackson Laboratories and housed in a pathogen-free facility at the University of Virginia or at Ohio University. All protocols used in these studies were approved by the respective institutional animal care and use committees. Blood glucose for these mice was monitored with a One-Touch Ultra glucose monitor and test strips (LifeScan).
Drugs
Mouse cytokines (R&D Systems, Inc) were prepared in PBS (Life Technologies) with 0.1% BSA (Roche Diagnostics). D-mannoheptulose (MH) was purchased from Carbosynth LLC and prepared in 1-M stock solutions in sterile H2O. Unless otherwise stated, all other drugs were purchased from Sigma-Aldrich, prepared in dimethylsulfoxide, and kept at −80°C.
Islet isolation
Pancreatic islets were isolated and cultured as described previously (37). After isolation, islets were placed overnight in RPMI 1640 media (Invitrogen) containing 11 mM glucose, 10% fetal bovine serum, and 1% penicillin/streptomycin. Most experiments were conducted the following day. Overnight MH treatment was given on the day of isolation; overnight cytokine treatment was given the day after isolation to permit further recovery before additional stress. All treatments were given in RPMI 1640, and all experiments were conducted within 1–2 days of isolation.
Intracellular calcium
Islets were loaded with 1 μM Fura-2AM in a mixture of two modified Krebs-Ringer bicarbonate solutions: low-glucose solution composed of 3 mM glucose; 122 mM NaCl; 3 mM CaCl2; 5 mM KCl; 2 mM MgCl2; and 10 mM HEPES (pH 7.4); and high-glucose solution composed of 28 mM glucose, 134.5 mM NaCl; 3 mM CaCl2; 5 mM KCl; 2 mM MgCl2; and 10 mM HEPES (pH 7.4). Mixtures of these two solutions were used to produce loading and recording conditions with Krebs-Ringer bicarbonate solutions containing 5, 8, 11, or 15 mM glucose. Islets were loaded for 30 minutes at 37°C and 5% CO2 and then transferred to the recording chamber for an additional 10 minutes. [Ca2+]i was measured using the ratiometric [Ca2+]i indicator Fura-2 AM as described previously (13, 38).
Pulsatile analysis of [Ca2+]i patterns
Cluster8 analysis software was used to detect peaks and nadirs within [Ca2+]i traces for islets (39). Within Cluster8, parameters were specified to appropriately identify pulses while filtering out random pulse-like noise within the traces. The following Cluster8 parameters were used: 2 points required for each peak or nadir, a t score of 2 to detect an increase or decrease, and a t score of 4 to detect outliers. For experimental data, 3-point moving averages and SD of 0.02 were used to reduce false-positive results due to noise in the data prior to analysis in Cluster8.
Glucose-stimulated insulin secretion
Glucose-stimulated insulin secretion studies were performed by placing approximately 20 size-matched islets/well in 0 mM glucose solutions for 1 hour and then moving the islets to the testing solutions. Testing solutions were 5, 8, 11, and 15 mM glucose concentrations. Islets and media were collected after 1 hour of incubation in the testing condition and stored at −80°C. Once sufficient trials had been completed, insulin secretion was determined through an ELISA as described previously (40). Inter- and intraassay variability was less than 10%.
Data analysis
A Fisher's exact test (2 × 2 contingency) was used to compare the percentages of oscillating vs nonoscillating islets between db/db and heterozygous islets. A two-tailed Student t test was used for all comparisons unless stated otherwise.
Results
Body weight and blood glucose comparisons
We first compared the blood glucose and body weight of each strain of mice in each age group to track the progression of diabetes. Among 4- to 5-week-old mice, the heterozygous and db/db mice differed significantly in weight, although the difference was less than 20%. As the mice age, however, average body weight in the db/db mice was greater than 20 g higher than their healthy counterparts (Figure 1A). Blood glucose shows a similar pattern. By 10–12 weeks of age, the db/db mice had greater than 300 mg/dL higher blood glucose than the heterozygous control mice (Figure 1B).
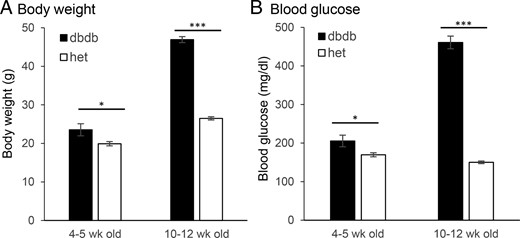
A and B, Comparison of body weight (A) and blood glucose (B) between db/db mice (filled columns) and heterozygous control (het) mice (open columns) at 4–5 weeks of age (prediabetic, n = 12 db/db, and n = 11 heterozygous mice) and 10–12 weeks of age (diabetic, n = 24 db/db, and n = 22 heterozygous mice). *, P < .05; ***, P < .001.
[Ca2+]i oscillations become disrupted in islets from prediabetic db/db mice as glucose increases
We used Fura-2 AM fluorescence to monitor [Ca2+]i within individual islets isolated from 4- to 5-week-old mice. Figure 2 shows example [Ca2+]i traces in 5, 8, 11, and 15 mM glucose for islets from heterozygous and db/db mice. In 5 mM glucose, islets from heterozygous mice showed no activity (Figure 2A). In 8 mM glucose, islets from the heterozygous mice produced small pulses, which increased in size through 11 mM and into the 15 mM glucose (Figure, 2B–D), as previously reported (41–43). In the db/db mice, islets were similarly quiescent in 5 mM glucose (Figure 2E) but displayed strong pulsatility in 8 mM glucose (Figure 2F). Pulses were irregular in 11 mM glucose (Figure 2G) and were even more irregular and smaller in 15 mM glucose (Figure 2H).
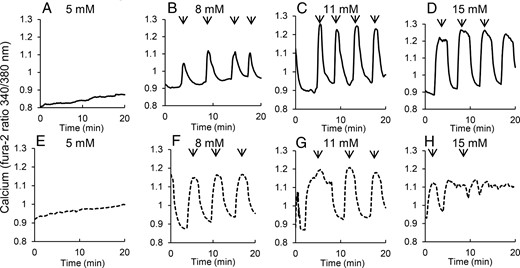
Islets isolated from prediabetic mice show disruptions in pulsatility with increasing glucose. A–D, Islets isolated from 4- to 5-week-old heterozygous control mice show no oscillations in 5 mM glucose (A) and oscillations with increasing amplitude and/or duration in 8 (B), 11 (C), and 15 mM glucose (D), respectively. E–H, Islets isolated from 4- to 5-week-old (prediabetic) db/db mice show no oscillations in 5 mM glucose, robust oscillations in 8 (F), and 11 mM glucose (G) but irregular oscillations with reduced amplitude in 15 mM glucose (H). Arrows indicate peaks of pulses detected by Cluster8 analysis.
Prediabetic db/db mice exhibit a shift to the left in sensitivity to glucose
We next compared several different parameters of the oscillations to identify differences between the db/db and heterozygous mice. As shown in Figure 3A, both db/db and heterozygous islets showed no oscillatory activity in 5 mM glucose, so no additional analysis of 5 mM glucose was performed. In 8 mM glucose, approximately 75% of the islets from db/db mice in 8 mM glucose showed a pulsatile [Ca2+]i response, whereas only approximately 40% of the heterozygous mice responded. As glucose increased, the ability of the db/db mice to produce a pulsatile response actually decreased slightly in 11 and 15 mM glucose. The heterozygous mice, however, responded as expected, with higher glucose stimulating a response in a greater number of islets, and greater than 80% of the islets responded in 15 mM glucose (Figure 3A). The period of the [Ca2+]i oscillations was approximately 4–6 minutes at each glucose concentration for both strains, with only minor differences between strains observed in 8 mM glucose (Figure 3B).
![Analysis of various [Ca2+]i parameters reveals early signs of dysfunction in prediabetic islets. Islets from db/db mice (dashed line) and heterozygous control (het) mice (solid line) were compared for the following parameters: percentage of islets displaying oscillations in 5, 8, 11, and 15 mM glucose (because no oscillations were detected in 5 mM glucose, only 8, 11, and 15 mM glucose were included for the remaining panels) (A), period of oscillations (B), amplitude of oscillations (C), area of oscillations (D), plateau fraction (time spent during peak of oscillation divided by total time between oscillations) (E), mean [Ca2+]i (F), minimum (min) [Ca2+]i (G), and maximum (max) [Ca2+]i (H). *, P < .05, **, P < .01, ***, P < .001 (n = 27, 38, 37, and 41 islets for heterozygous mice in 5, 8, 11, and 15 mM glucose, respectively; n = 22, 39, 41, 50 islets for db/db mice in 5, 8, 11, and 15 mM glucose, respectively).](https://oup.silverchair-cdn.com/oup/backfile/Content_public/Journal/endo/157/5/10.1210_en.2015-1879/3/m_zee9991684270003.jpeg?Expires=1750280557&Signature=4NjlY6ixjkwRJWqz3KMzq-O2BxYEJT5XB8L2HlZlqp7LlFTSKEtmUheeAaj-Eg3LlJLDD3Wdc7aODYQ-ynZGvw1AX7F0b-zfqnzM3ntPcIo5QVr8LMSDDad-0W00BIpemCYU1GjEub3Smukb6KApGzCl-mn~ND3IRV7ky-EyyOJl9fZHNNunlMi28mKGSCtqhbODb6IDALtPgDACRrChLcYavZ3wvLS0sOp06fy3pkiC-SjEjo2iRnD298Xc8mOts72KK5SuXSIoo2mMfuez3CDyKpNou5Qao0p~TnxUuSDPzHeofstUDHf5AvcVvM7XP5ZKxTz-QeUDaSTUn0lJiw__&Key-Pair-Id=APKAIE5G5CRDK6RD3PGA)
Analysis of various [Ca2+]i parameters reveals early signs of dysfunction in prediabetic islets. Islets from db/db mice (dashed line) and heterozygous control (het) mice (solid line) were compared for the following parameters: percentage of islets displaying oscillations in 5, 8, 11, and 15 mM glucose (because no oscillations were detected in 5 mM glucose, only 8, 11, and 15 mM glucose were included for the remaining panels) (A), period of oscillations (B), amplitude of oscillations (C), area of oscillations (D), plateau fraction (time spent during peak of oscillation divided by total time between oscillations) (E), mean [Ca2+]i (F), minimum (min) [Ca2+]i (G), and maximum (max) [Ca2+]i (H). *, P < .05, **, P < .01, ***, P < .001 (n = 27, 38, 37, and 41 islets for heterozygous mice in 5, 8, 11, and 15 mM glucose, respectively; n = 22, 39, 41, 50 islets for db/db mice in 5, 8, 11, and 15 mM glucose, respectively).
The peak height of the pulses, calculated as a percentage increase over basal [Ca2+]i level, differed only between strains in 15 mM glucose (Figure 3C). At this higher glucose concentration, the heterozygous islets continue their upward trend, whereas db/db islets exhibited a substantial decrease from the amplitude shown in 11 mM glucose. This pattern carries over to the area under the curve (AUC), which is typically representative of the amount of insulin released during glucose response. The islets from heterozygous mice have a strong upward trend because the area increases significantly with each step in glucose. The db/db mice, however, showed the lowest area in 15 mM glucose (Figure 3D). In 8 mM glucose, db/db mice produced larger area pulses than their healthy counterparts. These data suggest that islets from db/db mice begin to have problems producing robust pulses in response to high glucose concentrations, even at a young age.
A final element of pulsatility that can be used to compare glucose sensitivity in islets is the plateau fraction, which is altered significantly in the prediabetic state. Plateau fraction represents the amount of time during which the islet is considered active ([Ca2+]i is elevated, which is associated with insulin secretion) vs the time spent in quiescence (low [Ca2+]i, minimal secretion). Plateau fraction is calculated as a percentage of time spent active divided by the total time between oscillations. Again, the islets from the heterozygous mice show a dose-dependent increase in plateau fraction with increasing glucose concentration, but the db/db mice, in contrast, maintain a plateau fraction of approximately 70% in every glucose concentration (Figure 3E). The lack of change in plateau fraction implies that islets from db/db mice are already at maximum responsiveness in glucose concentrations as low as 8 mM. With increasing glucose, the islets are unable to modulate their response to the same extent as the healthy islets, impeding appropriate glucose sensitivity.
We also measured the average mean, minimum, and maximum [Ca2+]i to compare how the islets from each strain respond to different glucose conditions. At all glucose concentrations, mean [Ca2+]i in db/db islets was higher than that of heterozygous islets (Figure 3F), which was due in large part to increases in the minimum [Ca2+]i observed (Figure 3G). This increased basal [Ca2+]i in 15 mM glucose for islets from db/db mice can also be used to explain the decreased amplitude and area because both of these values are calculated with respect to basal (minimum) [Ca2+]i levels. The average maximum [Ca2+]i showed no major differences between the heterozygous and db/db islets (Figure 3H), suggesting that peak responses to glucose stimulation are not yet impaired in islets from db/db mice at this age.
Islet glucose sensitivity becomes more left shifted as db/db mice age
We next examined [Ca2+]i patterns in islets from 10- to 12-week-old mice. At this age, db/db mice are more significantly obese and hyperglycemic compared with heterozygous controls (see Figure 1). At 5 mM glucose, islets from heterozygous controls exhibited no response and simply remained at basal [Ca2+]i (Figure 4A). In 8 mM glucose, pulses with small amplitude and area were observed (Figure 4B), whereas amplitude and area increased markedly with 11 and 15 mM glucose, respectively (Figure 4, C and D). The db/db islets produced a nearly polar opposite pattern of [Ca2+]i activity. In 5 mM glucose, the islets from older db/db mice produced large-amplitude [Ca2+]i oscillations, similar to what is shown in the heterozygous islets at 11 mM glucose (Figure 4E). This finding was surprising because it is generally accepted that islets in vitro are inactive in less than 4–5 mM glucose (24, 44). As glucose increased, however, the oscillations declined in amplitude and became generally less regular. Even in 8 mM glucose, the response was much more irregular and smaller than those in 5 mM glucose (Figure 4F). In 11 mM and 15 mM glucose, detected oscillations were generally jagged bumps in [Ca2+]i due to the rapid fluctuations of [Ca2+]i in the islets (Figure 4, G and H).
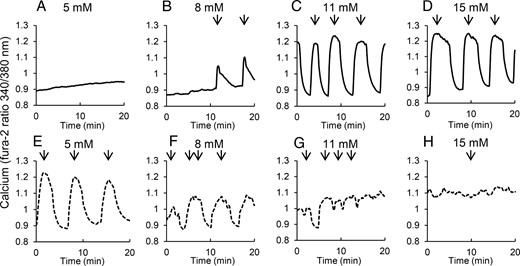
Islets isolated from diabetic mice produce robust oscillations only in low glucose. A–D, Islets isolated from 10- to 12-week-old heterozygous control mice show no oscillations in 5 mM glucose (A), and oscillations with increasing amplitude and/or duration in 8 (B), 11 (C), and 15 mM glucose (D), respectively. E–H, Islets isolated from 10- to 12-week-old db/db mice show large amplitude oscillations in 5 mM glucose but reduced amplitude with increasing glucose to 8 (F) 11 mM glucose (G), and 15 mM glucose (H). Arrows indicate peaks of pulses detected by Cluster8 analysis.
As shown in Figure 5A, nearly 25% of db/db islets in 5 mM glucose produced oscillations, whereas no oscillations were observed for heterozygous controls (Figure 5A) or for db/db islets or heterozygous islets from 4- to 5-week-old mice (see Figure 3A). These data suggest a strong shift in the range of oscillatory activity toward a lower glucose concentration in islets from diabetic mice. In 8 mM glucose, db/db islets peaked at approximately 74% of islets showing at oscillatory activity, and this level of activity was maintained in 11 mM (67%) and 15 mM (71%). The islets from heterozygous mice produced the expected dose response of oscillatory activity with 0% in 5 mM, 24% in 8 mM, 81% in 11 mM, and 87% in 15 mM glucose. Islets from 10- to 12-week-old mice had oscillation periods of approximately 4–5 minutes at all glucose concentrations, with the exception of db/db islets in 5 mM glucose (∼7 min, Figure 5B).
![Analysis of various [Ca2+]i parameters reveals substantial disruptions in the normal glucose dose-response relationship in islets from diabetic mice. Islets from db/db mice (dashed line) and heterozygous control (het) mice (solid line) were compared for the following parameters in 5, 8, 11, and 15 mM glucose: percentage of islets displaying oscillations (A), period of oscillations (B), amplitude of oscillations (C), area of oscillations (D), plateau fraction (E), mean [Ca2+]i (F), minimum (min) [Ca2+]i (G), and maximum (max) [Ca2+]i (H). *, P < .05, **, P < .01, ***, P < .001 (n = 30, 30, 37, and 31 islets for heterozygous mice in 5, 8, 11, and 15 mM glucose, respectively; n = 31, 27, 31, and 24 islets for db/db mice in 5, 8, 11, and 15 mM glucose, respectively).](https://oup.silverchair-cdn.com/oup/backfile/Content_public/Journal/endo/157/5/10.1210_en.2015-1879/3/m_zee9991684270005.jpeg?Expires=1750280557&Signature=AOnNPEkzes6Ii4Obx7VwodX-8g7-JEAag1abjD0kpb60UJYE0y7NJ0MmY1WiXWVsLvBe9eIvhj~HcjfANWlkhYqlt5Xvg-jgPA3lS8PONJdsnU065IpAjWqROnu2~It5nIOtOSR0lrco~e8DcE4MMK2tn2XbZVp7Xmj3ev-s9MflOwr-fDFvTzlXtCaeUCilpiEHT6JfziUc6Clne6GVNv5o-JXuWLnDSfWqXeykNJ-Otmw1YNgwAizMM9qRnH~mZV2OCXd2GJgN4usKziyUcpn8uwYuXpnaxMad5LZ-lZvNUztoKX380Ns0aFlmoIwP2ab3lGAjXdStXdZ7GI7MNA__&Key-Pair-Id=APKAIE5G5CRDK6RD3PGA)
Analysis of various [Ca2+]i parameters reveals substantial disruptions in the normal glucose dose-response relationship in islets from diabetic mice. Islets from db/db mice (dashed line) and heterozygous control (het) mice (solid line) were compared for the following parameters in 5, 8, 11, and 15 mM glucose: percentage of islets displaying oscillations (A), period of oscillations (B), amplitude of oscillations (C), area of oscillations (D), plateau fraction (E), mean [Ca2+]i (F), minimum (min) [Ca2+]i (G), and maximum (max) [Ca2+]i (H). *, P < .05, **, P < .01, ***, P < .001 (n = 30, 30, 37, and 31 islets for heterozygous mice in 5, 8, 11, and 15 mM glucose, respectively; n = 31, 27, 31, and 24 islets for db/db mice in 5, 8, 11, and 15 mM glucose, respectively).
In a similar manner to islet responses in 4- to 5-week-old mice, the amplitude shown in the db/db mice in 8 mM glucose is approximately the same as for heterozygous mice, but in 11 and 15 mM glucose, the amplitude of oscillations significantly declines compared with controls (Figure 5C). The peak amplitude for the db/db mice is in 5 mM glucose, and there is a negative correlation with glucose, exactly the opposite of the outcome from the heterozygous mice. This negative correlation indicates that increasing glucose produces diminished returns in the islets from diabetic mice. The same pattern is observed in the AUC for both het and db/db mice, with db/db mice showing peak area in 5 mM glucose and a downward trend with increasing glucose, whereas islets from heterozygous mice correlate positively with glucose concentration (Figure 5D). The plateau fraction still shows some degree of glucose sensitivity because islets from db/db mice showed an increase from 57% in 5 mM glucose to nearly 80% in 8 mM glucose (Figure 5E), signifying at least some remaining functionality in these islets at low-glucose concentrations. The heterozygous mice responded much like the younger het mice, as expected, with a plateau fraction increasing with every increase in glucose concentration (Figure 5E).
[Ca2+]i levels in islets from older db/db mice are significantly disrupted
The most notable difference at all glucose levels comes from the [Ca2+]i statistics. The mean [Ca2+]i in the db/db islets is significantly higher at all glucose concentrations except 15 mM than that found in the heterozygous mice. The difference in the lower glucose concentrations is notable and likely the result of the increased plateau fraction compared with the heterozygous mice (Figure 5F). The minimum [Ca2+]i level for db/db islets is also significantly higher at all glucose concentrations compared with controls (Figure 5G). Like the younger mice, the heterozygous islets did not show a notable change in minimum [Ca2+]i at any tested glucose concentration, meaning that these islets were able to maintain a consistently low nadir of oscillations across glucose concentrations, whereas islets from db/db mice did not. For maximum [Ca2+]i level, the db/db islets produced a higher value at 5 and 8 mM glucose than the heterozygous mice (Figure 5H) due to left shifting in db/db islets, leading to increased oscillatory activity in these lower glucose conditions. However, in the higher glucose concentrations of 11 and 15 mM, the heterozygous islets produced significantly higher maximum [Ca2+]i values, indicating greater glucose stimulation. The db/db islets in 11 and 15 mM are effectively stuck in the plateau phase unable to return to the nadir of the normal oscillatory cycle, whereas the heterozygous mice are capable of producing pulses with higher peaks and lower nadirs.
Glucose-stimulated insulin secretion follows changes in [Ca2+]i
As a final comparison of glucose responsiveness, we exposed groups of islets to 5, 8, 11, and 15 mM glucose to compare their insulin response. Islets from the 4- to 5-week-old heterozygous mice produced dose-dependent increases in insulin secretion with increasing glucose. For islets from young db/db mice, insulin release increased from 5 to 8 to 11 mM glucose but showed no further increase in 15 mM glucose. The db/db islets secreted more insulin than their heterozygous counterparts in 5 and 8 mM glucose, which is consistent with the observed elevation in mean [Ca2+]i in low glucose in islets from db/db mice and with the changes in oscillatory patterns associated with the left shift in [Ca2+]i response. Recent studies have shown that chronic exposure to high glucose can also produce a left shift in the oscillatory threshold (34, 45); both oscillations and elevated insulin secretion can be eliminated by blocking the voltage-gated calcium channels (45). Conversely, the much lower amplitude and area of [Ca2+]i oscillations (see Figure 3, C and D) in islets from db/db mice in 11 and 15 mM glucose is consistent with the much lower insulin secretion rates in Figure 6A, although the difference is not statistically significant.
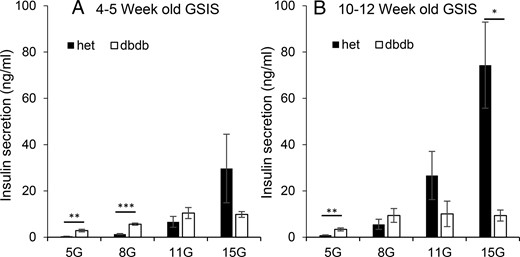
Islets from db/db mice show a progressive left shift in glucose-stimulated insulin secretion (GSIS). A and B, Insulin secretion in 5, 8, 11, and 15 mM glucose from sets of islets isolated from db/db (open columns) mice and heterozygous controls (het; filled columns) at ages 4–5 weeks (A, n = 9 heterozygous and n = 10 db/db sets of islets) and 10–12 weeks (B, n = 8 heterozygous and n = 7 db/db). *, P < .05; **, P < .01; ***, P < .001.
Insulin release shows even further left shifting in the older mice. The db/db islets produced maximal insulin response in 8 mM glucose, down from 11 mM glucose in the younger mice. They also secreted more insulin than the heterozygous islets in 5 mM glucose but significantly less in 15 mM (Figure 6B). Heterozygous islets, in contrast, maintained the appropriate dose-response curve (Figure 6B). The hypersensitivity to glucose in older db/db mice is a trend that begins as young as 4–5 weeks of age, before the manifestation of diabetes, and this condition worsens as the diabetic state of these mice becomes more prevalent.
Reducing glucokinase activity rescues oscillatory activity in 11 mM glucose
We next used the glucokinase inhibitor MH to test whether reducing rates of glycolysis could right shift calcium responses in islets from db/db mice. Islets from 4- to 5-week-old db/db mice were treated overnight with 1 mM MH and then washed and compared with untreated controls. As shown in Figure 7, A–C, untreated heterozygous islets showed normal oscillatory function and db/db islets typically did not, but db/db islets treated overnight with MH showed very robust oscillatory activity. As compared with heterozygous controls, overnight MH treatment fully restored the percentage of oscillatory islets in 11 mM glucose (Figure 7D) as well as the amplitude (Figure 7E) and area (Figure 7F) of oscillations. The mean [Ca2+]i levels were mildly elevated compared with heterozygous islets (Figure 7G), but the minimum [Ca2+]i was brought down completely to heterozygous levels (Figure 7H), with no significant reduction in maximum [Ca2+]i values (Figure 7I). Lastly, islets treated overnight with 10 mM MH showed no oscillatory activity, and the treatment reduced the minimum calcium [Ca2+]i value to 0.839 ± 0.008 (340:380 nm ratio, n = 11), which was lower than the 0.879 ± 0.014 value for untreated het controls (n = 14). These data indicate that full-dose MH inhibits glycolysis and thus the activation of voltage-gated calcium channels, as expected.
![Reducing glucokinase activity can restore oscillations in 11 mM glucose. A–C, Examples of [Ca2+]i traces in 11 mM glucose from untreated heterozygous (het) islets (A), db/db islets (B), and db/db islets treated overnight with 1 mM MH, a glucokinase inhibitor. Islets were isolated from four mice for each strain at 4–5 weeks of age. D–F, Mean values for percentage oscillatory (D), amplitude (E), and AUC (F) for oscillations detected by Cluster8. Mean [Ca2+]i (G), minimum (min) [Ca2+]i (H), and maximum (max) [Ca2+]i (I) are shown. *, P < .05, **, P < .01, ***, P < .001 (n = 14–15 islets/treatment group). Note that MH was not present for the [Ca2+]i recordings.](https://oup.silverchair-cdn.com/oup/backfile/Content_public/Journal/endo/157/5/10.1210_en.2015-1879/3/m_zee9991684270007.jpeg?Expires=1750280558&Signature=GSzSedVGZ6HyTHyaCiOVemZW7BW9gd3QcFBlopVkx78uX1Zu2Y4JQAM8HukjSTpHw6CUyvmEFmXy1jO0WW99yEA-kxPYZf2WeKKgV6MXhCiTHQOC7Q3h0C0qFphNyHTPK0NBehoEOcsVVRHCet7YfJPoaozhHcdxDo-aCWJ9lOsCVexJa~ErIFS1ia7pl-YrGonJSNCVtvTXSwUlwK~q7~NLAVjYMB8qfQiAh6CgjgA4x7Erc0cNYBRsZ6PpPL7i2vHg~mhGkxcIhRX5vvMtVnwkNaNolWuVL4FryELGIti5HPFd5kB78Ek8KRdTCeDRg~q5k9DAba7MmXX64J9hbA__&Key-Pair-Id=APKAIE5G5CRDK6RD3PGA)
Reducing glucokinase activity can restore oscillations in 11 mM glucose. A–C, Examples of [Ca2+]i traces in 11 mM glucose from untreated heterozygous (het) islets (A), db/db islets (B), and db/db islets treated overnight with 1 mM MH, a glucokinase inhibitor. Islets were isolated from four mice for each strain at 4–5 weeks of age. D–F, Mean values for percentage oscillatory (D), amplitude (E), and AUC (F) for oscillations detected by Cluster8. Mean [Ca2+]i (G), minimum (min) [Ca2+]i (H), and maximum (max) [Ca2+]i (I) are shown. *, P < .05, **, P < .01, ***, P < .001 (n = 14–15 islets/treatment group). Note that MH was not present for the [Ca2+]i recordings.
Cytokine effects in islets from db/db mice are more pronounced in high glucose
We next examined whether glucose plays a role in responses to cell stress. Increased circulating levels of proinflammatory cytokines are associated with an increased risk of diabetes (46). We previously showed that db/db mice have elevated serum levels of IL-1B and IL-6 and that these two cytokines can disrupt islet [Ca2+]i responses to glucose stimulation (47). We focus here on the differences between strains for the effects of overnight cytokine exposure (serum levels of IL-1B and IL-6) on steady-state [Ca2+]i patterns. Note that cytokine exposure inhibited glucose-stimulated calcium responses compared with untreated control islets for both strains; untreated control data are included in Figures 2–5.
Among 4- to 5-week-old mice, the number of islets that were capable of producing oscillations after cytokine exposure differed between strains only in 15 mM glucose (Figure 8A). In Figure 8B, although differences were observed in 11 mM glucose due to unusually small variance among trials, the period of oscillations remained within the typical range of 3–5 minutes for both strains for all glucose concentrations. Islets from heterozygous mice maintained the normal glucose dose-response relationship for the amplitude (Figure 8C) and area (Figure 8D) of oscillations after cytokine exposure. Islets from prediabetic db/db mice, however, have lost the expected dose-dependent increase in amplitude and area with increasing glucose (Figure 8, C and D). In addition, both area (Figure 8D) and plateau fraction (Figure 8E) for islets from db/db mice are profoundly diminished by cytokines in 15 mM glucose compared with heterozygous cytokine-treated islets.
![Effects of low-dose cytokine exposure on prediabetic islets. After an overnight exposure to 10 pg/mL IL-1B + 20 pg/mL IL-6, islets from db/db mice (dashed line) and heterozygous control mice (solid line) were compared for the following parameters: percentage of islets displaying oscillations in 5, 8, 11, and 15 mM glucose (because no oscillations were detected in 5 mM glucose, only 8, 11, and 15 mM glucose were included for the remaining panels) (A), period of oscillations (B), amplitude of oscillations (C), area of oscillations (D), plateau fraction (time spent during peak of oscillation divided by total time between oscillations) (E), mean [Ca2+]i (F), minimum (min) [Ca2+]i (G), and maximum (max) [Ca2+]i (H). *, P < .05, **, P < .01, ***, P < .001 (n = 9, 44, 38, and 32 islets for heterozygous mice in 5, 8, 11, and 15 mM glucose, respectively; n = 4, 31, 32, 37 islets for db/db mice in 5, 8, 11, and 15 mM glucose, respectively).](https://oup.silverchair-cdn.com/oup/backfile/Content_public/Journal/endo/157/5/10.1210_en.2015-1879/3/m_zee9991684270008.jpeg?Expires=1750280558&Signature=uyMAJbx8NheV0XsrWmvXJSv12IdVncRSAAIVqjfOIBBMmZ54DpZRvqCVEfTn9137dwoGFTb8JjDXN4X7VZ2olPHOMuPmfUTDTfasSCx~I6RzxwZfTPvSpNqQOgEWeCJo1veflGnGZ0sf~skMUZ8mrsJH8iehtoTJQIhvUgxvSGA-CrWHJrbyW7uVJdWZ3JJ1GWVqIhzU86mVscpL-2xt3E28E~7jq4T556za~PfTLzQCNvGlnI3vQGucu3VOH5~IVAPQaPQESPpmXuWAkWNx-xELWMxFRBt9kxNiGxNLlWuchTP8BILkw8GsA6Q93n--caAMmSun5OqtFVk-JQAmYQ__&Key-Pair-Id=APKAIE5G5CRDK6RD3PGA)
Effects of low-dose cytokine exposure on prediabetic islets. After an overnight exposure to 10 pg/mL IL-1B + 20 pg/mL IL-6, islets from db/db mice (dashed line) and heterozygous control mice (solid line) were compared for the following parameters: percentage of islets displaying oscillations in 5, 8, 11, and 15 mM glucose (because no oscillations were detected in 5 mM glucose, only 8, 11, and 15 mM glucose were included for the remaining panels) (A), period of oscillations (B), amplitude of oscillations (C), area of oscillations (D), plateau fraction (time spent during peak of oscillation divided by total time between oscillations) (E), mean [Ca2+]i (F), minimum (min) [Ca2+]i (G), and maximum (max) [Ca2+]i (H). *, P < .05, **, P < .01, ***, P < .001 (n = 9, 44, 38, and 32 islets for heterozygous mice in 5, 8, 11, and 15 mM glucose, respectively; n = 4, 31, 32, 37 islets for db/db mice in 5, 8, 11, and 15 mM glucose, respectively).
Mean, minimum, and maximum [Ca2+]i (Figure 8, F–H, respectively) showed substantial differences between strains in 5 mM glucose. The elevated [Ca2+]i in low glucose among islets from db/db mice is consistent with our previous report of increased endoplasmic reticulum (ER) stress and decreased ER calcium handling in islets from db/db mice, which is particularly evident in low glucose (47). The other noteworthy finding is that the [Ca2+]i data show a flattening of the glucose dose-response changes in islets from prediabetic db/db mice compared with heterozygous islets.
In the older mice, the impact of cytokines on db/db islets vs heterozygous controls is even more apparent. Only approximately 7% of db/db islets produced oscillations in 8 mM glucose and approximately 15% in 11 mM glucose (Figure 9A). Period, amplitude, area, and plateau fraction of oscillations were not considered due to an insufficient sample size for db/db islets. Mean, minimum, and maximum [Ca2+]i (Figure 9, B–D, respectively), however, indicated major strain differences in cytokine effects on islet response. In 11 and 15 mM glucose, db/db islets had a much lower mean [Ca2+]i value than their heterozygous counterparts, which is the opposite result of every other data set collected in this study and suggests a substantial impairment in [Ca2+]i regulation in db/db islets, particularly when challenged with high glucose levels (Figure 9B). Minimum [Ca2+]i had typical patterns of db/db islets, producing higher minimums in all but 15 mM glucose, again reinforcing the effects of cytokines in high glucose (Figure 9C). The maximum [Ca2+]i response again reinforces the effects shown in mean and minimum [Ca2+]i; db/db islets have a much lower maximum [Ca2+]i response than heterozygous islets in all but 5 mM glucose (Figure 9D). These findings are consistent with another study showing that higher glucose during cytokine exposure leads to increased rates of cell death in INS-1 cells (48).
![Effects of low-dose cytokine exposure on diabetic islets. After an overnight exposure to 10 pg/mL IL-1B + 20 pg/mL IL-6, islets from db/db mice (dashed line) and heterozygous control (het) mice (solid line) were compared for the following parameters: percentage of islets displaying oscillations in 5, 8, 11, and 15 mM glucose (A), mean [Ca2+]i (B), minimum (min) [Ca2+]i (C), and maximum (max) [Ca2+]i (D). *, P < .05, **, P < .01, ***, P < .001 (n = 31, 36, 35, and 28 islets for heterozygous mice in 5, 8, 11, and 15 mM glucose, respectively; n = 31, 33, 36, and 28 islets for db/db mice in 5, 8, 11, and 15 mM glucose, respectively).](https://oup.silverchair-cdn.com/oup/backfile/Content_public/Journal/endo/157/5/10.1210_en.2015-1879/3/m_zee9991684270009.jpeg?Expires=1750280558&Signature=K-EspNDxa~KgILJudI53btHDhQJrjbJ0Iq~Poqwyly75REsqdGFFx75ms617Fq87s7AdipbrByEELUbZGDTfVnO3rvSTH7MhB1rq~-k1t8aqXbw5xv-lNMrCueBBBOGSTWMzn6LLOGr7PVVXnh26e1jX8F0n67EQyvIPNP6-Mog~NgSB0QOb5q5XwP~vyM2xqaqz39s9daG0oTJCjwZmDGbU7SjV3CHYbw7hrCWMVDDdKt7yvItbKNvkR6-oOGfJ51aPEnmZFXn6BLhB8SAt2zgCSk4HcmkaJghYJ16ahAZcpWDODs7f9znyvDadKzcl5zeJ42r0gwz2L2Isktdakw__&Key-Pair-Id=APKAIE5G5CRDK6RD3PGA)
Effects of low-dose cytokine exposure on diabetic islets. After an overnight exposure to 10 pg/mL IL-1B + 20 pg/mL IL-6, islets from db/db mice (dashed line) and heterozygous control (het) mice (solid line) were compared for the following parameters: percentage of islets displaying oscillations in 5, 8, 11, and 15 mM glucose (A), mean [Ca2+]i (B), minimum (min) [Ca2+]i (C), and maximum (max) [Ca2+]i (D). *, P < .05, **, P < .01, ***, P < .001 (n = 31, 36, 35, and 28 islets for heterozygous mice in 5, 8, 11, and 15 mM glucose, respectively; n = 31, 33, 36, and 28 islets for db/db mice in 5, 8, 11, and 15 mM glucose, respectively).
Discussion
The results of this study present the following three key observations regarding islet pulsatility with respect to T2D: 1) contrary to the accepted view, pulsatility is not completely lost in islets from diabetic mice; 2) normal oscillatory function in postprandial (11 and 15 mM glucose) conditions is prevented by a left shift in islet glucose sensitivity; and 3) the left shift in glucose sensitivity also increases susceptibility to cytokine-induced dysfunction in islets from diabetic mice when exposed to particularly high glucose conditions. These findings are discussed in detail as follows.
Islet pulsatility in T2D
Pulsatility is an endogenous function of the β-cell from the individual cells to the coordinated release of insulin from the pancreas into the portal vein, and it is conserved across species from rodents to humans (1, 49). The long-standing observation that pulsatility is disrupted in patients with T2D (4–6) and their close relatives (10–12) has led to the commonly accepted view that the mechanisms of pulsatility are not functional (50–52). We have previously published that oscillatory activity is disrupted or abolished with the onset of T2D in db/db mice (53), and the loss of pulsatility has been reported in other models as well (54–56).
Our data in the present study show that reducing the level of glucose that diabetic islets are exposed to can restore normal pulsatility. Even when islets were isolated from mice at 10–12 weeks of age with mean blood glucose levels approaching 500 mg/dL, robust pulsatility was still observed in approximately 25% of islets in 5 mM glucose. We note that this restoration of oscillatory activity in low glucose did not fully shift back insulin secretion to rates observed in heterozygous controls in 11 mM glucose (compare Figure 5D with Figure 6B). This could be for several reasons including the following: 1) reducing glucose likely down-regulates all parts of the stimulus-secretion pathway instead of targeting the specific part of the pathway that is hyperresponding to glucose; 2) because only some islets from diabetic mice showed oscillatory recovery, only some islets may have shown recovery of insulin secretion; and 3) other factors may be involved in addition to the relationship between pulsatility and insulin secretion. The present study, nevertheless, demonstrates for the first time to our knowledge that the machinery to produce oscillations is very much intact, even within islets isolated from hyperglycemic mice. The issue is that the normal range of glucose concentrations that permits oscillatory activity has shifted to a nonphysiological glucose range (5 mM or lower) among islets from diabetic mice.
Left shift in glucose sensitivity
A left shift in glucose sensitivity has been observed in human populations prone to T2D (20–22) and in a number of model systems of T2D (24–28). At the cellular level, several candidate processes that are somewhat unique to the β-cell could accomplish this. First, an increase in glucose transporter-2 receptor number or activity could account for a relative increase in glucose within the β-cell, which could lead to increased downstream insulin secretion. However, most evidence points to decreased glucose transporter-2 expression in models of T2D (57–59) including the db/db mouse (60). 2) Glycolysis is another key step in the glucose-sensing process that could cause a left shift. If glycolytic enzyme activity is increased in β-cells, this could result in increased rates of glucose metabolism that could cause increased insulin release relative to glucose. Increased glucokinase activity has been linked to basal hypersecretion of insulin from perfused pancreas in the Zucker diabetic fatty rat (26), and others have shown elevated glucokinase expression or activity early in the disease process in rodent models (61, 62). Note that the interest in glucokinase activators to treat T2D stems from the reduced glucokinase levels observed later in the disease process (63, 64). Our findings using the glycolytic inhibitor MH suggest the opposite to be true in the early stages of the disease. And third, ATP-sensitive potassium channels are linked to a number of diabetic phenotypes (65, 66), and inducing β-cell rest by intermittently treating mice with diazoxide on the order of hours has shown therapeutic potential in treating diabetes (66–69). A recent study showed that chronic glucose left shifts the threshold for oscillations, at least in part, by affecting ATP-sensitive potassium channels (34). Changes in calcium channel activity, mitochondrial metabolism, or the exocytotic machinery for insulin are also candidates, but less evidence has been found for their direct involvement in glucose sensing.
Left shift in glucose sensitivity and increased susceptibility to cellular stress
Our findings also suggest that the left shifting of glucose sensitivity might make islets from diabetic mice more susceptible to other environmental stressors. We previously reported that exposure to circulating levels of proinflammatory cytokines IL-1β plus IL-6 had a number of damaging effects on islets from prediabetic mice (age 4–5 wk) including increased signs of ER stress, reduced viability, and decreased calcium influx and insulin release in response to glucose stimulation (47). In the present study, we examined the effects of these same cytokines on [Ca2+]i patterns in steady-state glucose conditions, in which islets are maintained in a single glucose concentration before and during the study (as opposed to raising glucose from 3 mM to 11 mM). Maintaining islets in a steady-state glucose condition promotes endogenous pulsatility. We found that cytokine-induced effects, particularly in 15 mM glucose, diverged strongly between islets from prediabetic mice vs islets from heterozygous controls. In 15 mM glucose, the percentage of oscillatory islets, area (akin to insulin pulse mass), and plateau fraction were all substantially lower in islets from prediabetic mice treated overnight with cytokines compared with cytokine-treated heterozygous controls This effect was found only in 15 mM glucose and not to the same extent in lower glucose concentrations. These data suggest an increased susceptibility to cytokine-induced dysfunction in pulsatility in diabetes-prone islets, when the islets are exposed acutely to a high glucose environment.
These findings are consistent with another study showing that higher glucose during cytokine exposure leads to increased rates of cell death in INS-1 cells (48). Islets from diabetic 10- to 12-week-old mice showed near complete loss of any form of pulsatility at any glucose concentration in response to cytokine exposure, suggesting that any intervention to normalize pulsatile function needs to occur early in the disease process. The increased cytokine-induced dysfunction in high glucose provides additional support for the glucotoxicity hypothesis (70) by adding the possibility that elevated glucose provides increased susceptibility to inflammation and possibly other islet stressors.
Compensation vs hypersensitivity
During revision of this manuscript, a paper by Glynn et al (34) was published on the role of chronic glucose exposure in left shifting the threshold of oscillations in islets and a contravening right shift provided by insulin secretion itself. A companion paper by Ha et al (32) put forth a mathematical model to explain the concept of the left shift in the context of a broader β-cell adaptation to compensate for increased nutrient load and/or insulin resistance. The oscillatory patterns generated by chronic exposure to high glucose in Glynn et al (34) were remarkably similar to our study of islets from db/db mice, suggesting that chronic hyperglycemia could be responsible for our observations as well. However, there are also key differences to note. First, the islets in our studies were not maintained in 16.7 mM hyperglycemic conditions overnight to produce a left shift; islets isolated from db/db mice and heterozygous controls in our study were maintained in standard RPMI 1640 containing 11 mM glucose until [Ca2+]i patterns were measured at various glucose concentrations. Second, the circulating blood glucose levels were 11.4 mM for 4- to 5-week-old db/db mice and 9.4 mM for heterozygous controls (see Figure 1), which is not considered hyperglycemic. Islets from db/db and het mice were then isolated and maintained in 11 mM RPMI 1640 medium overnight before any testing, so the left shift observed in these conditions was due to either an innate hypersensitivity in the islets themselves and/or from a lingering effect of the in vivo environment, an effect on oscillations that can continue in vitro (71). Whereas the 10- to 12-week-old mice were clearly hyperglycemic, additional factors are also at play, such as hyperlipidemia and systemic inflammation. Third, Glynn et al (34) examined the response of normal healthy islets to hyperglycemia, whereas we focused on islets from a model of T2D in which β-cell dysfunction is part of the disease model.
According to Ha et al (32), there are three avenues of β-cell compensation to glucose/nutrient overload that can be engaged: 1) a left shift in glucose sensitivity to increase insulin secretion of the short term, 2) engagement or augmentation of the amplifying pathway for additional insulin release per β-cell, and 3) increasing β-cell mass to provide additional insulin output and reduce the insulin secretory load for each β-cell. According to their model, there is a tipping point at which glucose is too high for β-cells to adequately compensate for blood glucose by all of these adaptations combined without additional therapeutic interventions designed to reduce nutrient intake and/or peripheral insulin resistance. Our data suggest that the left shift of β-cells in diabetes-prone mice may make the β-cells less able to secrete insulin effectively in conditions of elevated glucose, which is aggravated by additional stress brought about by low-grade inflammation (and possibly other stressors). In addition, normal oscillatory activity is restored to db/db islets when glycolytic activity is partially inhibited. Our data thus suggest that islets from db/db mice may be hypersensitive to glucose, rather than compensatory to nutrient excess, although more definitive studies are needed.
Final thoughts on the advantages to restoring pulsatility in T2D
Endogenous insulin pulsatility is conserved across many species, and rhythms in glycolysis are found in organisms as primitive as yeast (72). There are at least two potential benefits to restoring pulsatility with regard to diabetes therapy. First, pulsatility is more effective at downstream signaling. There is now ample evidence that hepatic responses to insulin are optimal under conditions of robust pulsatility. The loss of pulsatility would thus reduce hepatic response and potentially contribute to insulin resistance, causing a vicious cycle of nonpulsatile insulin output and further reduced peripheral response. Restoring pulsatility may promote a virtuous cycle. Second, on/off cycles may help to maintain islet health and viability. There is evidence that intermittent periods of rest provide the β-cell with greater ability to provide normal function during times of heightened activity (13, 69, 73). Perhaps phases of 3-minute active secretion followed by 2-minute inactivity are designed to provide the necessary time to process additional insulin in the ER to reduce ER stress (74) and/or resupply the granule pool (75). Future studies will focus developing approaches to restore pulsatile insulin release in vivo as a therapeutic intervention.
Acknowledgments
Special thanks go to Drs David H. Wasserman and Owen P. McGuinness for their help with the research design and to Drs Leslie S. Satin and Arthur Sherman for their helpful discussions.
This work was supported by the National Institute of Diabetes and Digestive and Kidney Diseases Mouse Metabolic Phenotyping Centers (www.mmpc.org) under the MICROMouse Funding Program Grant DK076169 and by National Institutes of Health Grant R01 DK089182. C.S.N. and C.D.W. were supported by the Arnold and Mabel Beckman Foundation.
Disclosure Summary: The authors have nothing to disclose.
Abbreviations
- AUC
area under the curve
- [Ca2+]i
intracellular calcium
- ER
endoplasmic reticulum
- MH
D-mannoheptulose
- T2D
type 2 diabetes.
References
Author notes
K.L.C. and C.D.W. contributed equally to this work and are presented in alphabetical order.
