


Abstract
Leptin availability in perinatal life critically affects metabolic programming. We tested the hypothesis that uteroplacental insufficiency and intrauterine stress affect perinatal leptin availability in rat offspring. Pregnant rats underwent bilateral uterine vessel ligation (LIG; n = 14), sham operation (SOP; n = 12), or no operation (controls, n = 14). Fetal livers (n = 180), placentas (n = 180), and maternal blood were obtained 4 hours (gestational day [E] 19), 24 hours (E20), and 72 hours (E22) after surgery. In the offspring, we took blood samples on E22 (n = 44), postnatal day (P) 1 (n = 29), P2 (n = 16), P7 (n = 30), and P12 (n = 30). Circulating leptin (ELISA) was significantly reduced in LIG (E22, P1, P2) and SOP offspring (E22). Postnatal leptin surge was delayed in LIG but was accelerated in SOP offspring. Placental leptin gene expression (quantitative RT-PCR) was reduced in LIG (E19, E20, E22) and SOP (E20, E22). Hepatic leptin receptor (Lepr-a, mediating leptin degradation) gene expression was increased in LIG fetuses (E20, E22) only. Surprisingly, hypoxia-inducible factors (Hif; Western blot) were unaltered in placentas and were reduced in the livers of LIG (Hif1a, E20; Hif2a, E19, E22) and SOP (Hif2a, E19) fetuses. Gene expression of prolyl hydroxylase 3, a factor expressed under hypoxic conditions contributing to Hif degradation, was increased in livers of LIG (E19, E20, E22) and SOP (E19) fetuses and in placentas of LIG and SOP (E19). In summary, reduced placental leptin production, increased fetal leptin degradation, and persistent perinatal hypoleptinemia are present in intrauterine growth restriction offspring, especially after uteroplacental insufficiency, and may contribute to perinatal programming of leptin resistance and adiposity in later life.
During the first 1000 days from conception until the age of 2 years, the course of human development has crucial impact on the predisposition for disease in later life (1). The concepts of perinatal programming, early life programming, or developmental origins of health and disease describe the phenomenon that environmental conditions during early life affect unique developmental steps. Permanent alterations of organ morphology and function as well as epigenetic modifications may be the consequence. The presence of adverse conditions during early life increases the incidence and prevalence for noncommunicable diseases in later life (2–4).
Various experimental models have been developed to elucidate the mechanistic links between intrauterine growth restriction (IUGR) and later morbidity. Among these, the rat model of bilateral uterine artery and vein ligation (LIG) has been most widely used (5) to simulate the clinical situation of uteroplacental insufficiency (6), the leading cause of IUGR in the Western world (7). In later life, IUGR children have an increased incidence of cardiovascular disease, adiposity, and the metabolic syndrome (2–4). Although body weight is regulated by many factors, there are some pathophysiological aspects that can be influenced during early ontogenesis. Among these, programming of leptin resistance by perinatal leptin deficiency has been demonstrated. Leptin is an important trophic factor affecting the development of hypothalamic nuclei regulating appetite and energy expenditure (8, 9). There is evidence that intrauterine and neonatal leptin availability could be one of the key mechanisms in programming of metabolic disease after uteroplacental insufficiency (10–14). However, longitudinal studies on intrauterine leptin availability in the human IUGR situation are almost impossible. Therefore, we chose a rat model of uteroplacental insufficiency to obtain mechanistic insights (15).
Our study was designed to analyze the impact of bilateral LIG of the uterine arteries and veins as well as the influence of prenatal stress induced by sham operation (SOP) on perinatal leptin availability in rats. Our hypothesis was that IUGR offspring after LIG experience a period of reduced serum leptin concentrations at a point of time when hypoleptinemia programs leptin resistance (8, 9). This hypothesis was based on the observation that LIG animals show increased adipose tissue mass as well as features of leptin resistance in later life (16). Because SOP also induces IUGR and SOP offspring have a slight increase of adipose tissue mass and circulating leptin concentrations in later life, we hypothesized that SOP may also affect perinatal leptin regulation (16). Furthermore, we studied potential upstream mechanisms involved in fetal and placental leptin regulation, namely hypoxia (17, 18) and tissue damage/inflammation (19). Because the course of time is pivotal in all processes leading to perinatal programming of disease, we put an emphasis on the longitudinal design of our study and covered a time period, which was previously shown to be crucial for leptin-depended metabolic programming in rodents (8, 9, 20).
Materials and Methods
Animals and surgical procedures
All procedures on animals were conducted in accordance with the German regulations and legal requirements. The experimental protocol was approved by the appropriate institutional and governmental review boards.
Virgin female Wistar rats were time mated and supplied to our facilities by the research animal provider (Charles River) at embryonic day (E) 14 or E15 of their first pregnancy (the first day after mating was defined as gestational day E1). Rats were housed individually under air conditioning providing a temperature of 22ºC ± 2ºC; constant relative humidity of 55%; a 12-hour light, 12-hour dark cycle; and free access to standard rat maintenance diet (number 1320; Altromin) and water. The diet included 2844 kcal/kg, 19% protein (soy/grain/corn), 4% fat, 6.4% disaccharides, 30.3% starch, 3.8 mg/kg methionine, and 2.0 mg/kg folate. On pregnancy day E19, the dams were anesthetized by an im injection of midazolam (5 mg/kg) and ketamine (100 mg/kg). After midline laparotomy, both uterine horns were pulled out of the abdomen until exposed completely, and the living fetuses were counted. Subsequently, we either performed a LIG (n = 14 dams) of both uterine arteries and veins at the most caudal point accessible with 6–0 Prolene (Ethicon) or removed the suture material after identical anesthetic and surgical procedures (SOP; n = 12 dams). The rats started drinking and taking food within 4–8 hours after surgery and recovered fully before the beginning of the dark cycle. Offspring of untreated rat dams served as controls (C; n = 14 dams). Dams that showed postinterventional resorption or that carried less than seven fetuses (three LIG, one SOP, three C dams) were excluded from the analysis to reduce the bias by litter size. Included dams carried 7–15 fetuses in total. Fetuses from uterine horns with less than five fetuses were also excluded to reduce the bias by low number of fetuses per uterine horn. In group LIG, all fetuses analyzed originated from uterine horns (n = 17 horns) with five to seven fetuses. Fetuses in groups SOP (n = 16 horns) and C (n = 12 horns) originated from uterine horns with five to nine fetuses.
On day E19 (4 h after surgery in groups LIG and SOP), E20 (24 h after surgery in groups LIG and SOP), or E22 (72 h after surgery in groups LIG and SOP) of pregnancy, dams were anesthetized (midazolam/ketamine) and underwent a cesarean section. We chose the first point of time (4 h after surgery) to evaluate acute consequences, the second point of time (24 h) to evaluate subacute consequences, and the third point of time (72 h) to evaluate delayed consequences of surgery as well as adaptations occurring in preparation of giving birth. From each adequate uterine horn (E19: LIG, n = 5; SOP, n = 6; C, n = 3; E20: LIG, n = 7; SOP, n = 5; C, n = 3; E22: LIG, n = 5; SOP, n = 5; C, n = 6), four placentas and the related fetuses were delivered from four different positions (position 1, most caudal fetus; 2, second most caudal fetus; 3, intermediate; 4, most cranial fetus). Immediately after delivery, the fetoplacental unit was briefly (∼5 sec) placed in prewarmed NaCl 0.9% solution. Placenta and fetus were divided. The fetus was weighed and then decapitated to take a blood sample for leptin measurement, which was possible in most fetuses on E22 only (LIG, n = 7; SOP, n = 15; C, n = 22). On gestational days E19 and E20, leptin could not be measured due to low sample volumes. Subsequently, the entire liver and other fetal organs (designated for other studies) were extracted.
Simultaneously, the amniotic membrane was removed from the placenta by a second researcher. Parts of the liver and placenta were frozen in liquid nitrogen approximately 30 seconds after delivery. A total of 180 fetuses and 180 placentas were included (E19: n = 20 LIG, n = 24 SOP, n = 12 C; E20: n = 28 LIG, n = 20 SOP, n = 12 C; E22: n = 20 LIG, n = 20 SOP, n = 24 C). Maternal blood was withdrawn from all dams by retroorbital puncture immediately before the cesarean section for measurements of circulating leptin and steroids. For postnatal measurements of circulating leptin in offspring, dams (LIG, n = 5–6; SOP, n = 5; C, n = 5–6 for each postnatal day) delivered spontaneously within a time frame of 12 hours on pregnancy day E22.5-E23 (plug day was d E1). On days postnatal day (P) 1 (LIG, n = 10; SOP, n = 9; C, n = 10), P2 (LIG, n = 5; SOP, n = 6; C, n = 5), P7 (LIG, n = 10; SOP, n = 10; C, n = 10) and P12 (LIG, n = 10; SOP, n = 10; C, n = 10), the offspring was decapitated, blood was collected, and leptin was measured.
To reduce the number of laboratory animals, the placentas used in this project were also used for another project not reported here, which had the aim to analyze placental nutrient transporters in our animal model (21).
Quantitative RT-PCR
Total RNA was extracted from placenta samples stored at −80°C using guanidine-thiocyanate acid phenol (TRIzol; Invitrogen GmbH). RNA concentrations were determined spectrophotometrically. One microgram of deoxyribonuclease-treated RNA was reversely transcribed in a volume of 26 μL at 37°C for 60 minutes (chemicals from Promega GmbH; oligonucleotides from Finnzymes).
Quantitative RT-PCR was performed on a 7500 real-time PCR-system (Applied Biosystems). Primers and probes were designed using Primer Express Software (Applied Biosystems). Target probes were labeled with fluorescent reporter dye 6-carboxy-fluorescein. All of the primers and probes (Supplemental Table 1) were purchased from Eurofins MWG GmbH. Commercial reagents (TaqMan reaction kit; Eurogentec) and conditions were applied according to the manufacturer's protocol. Then 2.5 μL of cDNA (reverse transcription mixture), 2.5 μL of 200 μM TaqMan hybridization probe, and 2.5 μL of each primer, respectively (primer concentrations between 300 and 900 μM, optimum concentrations were assessed prior to the measurement) were analyzed in a 25-μL-volume reaction mix. The MgCl concentration was adjusted for each primer pair. The thermocycler parameters were 50°C for 2 minutes and 95°C for 10 minutes, followed by 40 cycles of 95°C for 15 seconds and 60°C for 1 minute. For quantification, the threshold cycle values of the probes were interpolated to an external standard curve constructed by plotting the relative amounts of a serial dilution of a known template vs the corresponding threshold cycle values.
We measured the prenatal expression of placental and fetal hepatic genes, which were assigned to the following categories: housekeeping genes, leptin metabolism, cellular hypoxic response, and inflammation/tissue remodeling. First, we evaluated the normal ontogenesis of both placental and fetal hepatic gene expression in Wistar rats. For this purpose, we compared data from day E19 of pregnancy with data from day E20, representing the ontogenetic regulation at the end of pregnancy without acute influence of delivery. Then we performed a comparison of data from day E20 with data from day E22 to analyze the ontogenetic regulation at the very end of pregnancy with potential influence of beginning delivery. Next, we examined the impact of both placental insufficiency (group LIG compared with group C on each day) and prenatal stress induced by sham operation (group SOP compared with group C on each day) on the ontogenetic transcriptional course.
In detail, the following genes were measured (see Supplemental Table 1 for sequences): 1) housekeeping genes (mitochondrial ribosomal protein L41 [Mrpl41] and ribosomal protein L37a [Rpl37a]); 2) leptin metabolism (leptin [Lep], short leptin receptor [Lepr-a], full length leptin receptor [Lepr-b]); 3) cellular hypoxic response (hypoxia inducible factor-1α [Hif1a], hypoxia-inducible factor-2α [Hif2a, official gene symbol Epas1], prolyl hydroxylase 1 [Phd1, official gene symbol Egln2], prolyl hydroxylase 2 [Phd2, official gene symbol Egln1], prolyl hydroxylase 3 [Phd3, official gene symbol Egln3], hypoxia inducible factor-1α subunit inhibitor [Hif1an], vascular endothelial growth factor [Vegfa]); and 4) inflammation and tissue remodeling (transforming growth factor beta 1 [Tgfb1], plasminogen activator inhibitor 1 [Pai1, official gene symbol Serpine 1], IL-10 [Il10], matrix metalloproteinase 2 [Mmp2], matrix metalloproteinase 9 [Mmp9], tissue inhibitor of metalloproteinase 1 [Timp1], tissue inhibitor of metalloproteinase 2 [Timp2], and proliferating cell nuclear antigen [Pcna]).
Protein isolation, Western blot techniques, and measurement of circulating proteins
Tissue was lysed in protein extraction buffer (10 mM Tris, pH 6.8; 6.65 M urea; 10% glycerol; 1% sodium dodecyl sulfate 10 μL/mL; 0.5 M dithiothreitol; 10 μL/mL 50 mM phenylmethylsulfonyl fluoride), incubated on ice (1 h), and centrifuged (1600 × g, 5 min, 4°C). Subsequently, protein concentration was determined using a commercial kit (BCATM protein assay kit, Thermo Scientific). For protein detection, 80 μg of protein was separated on 10% acrylamide SDS-PAGE under reducing conditions and transferred onto a nitrocellulose membrane for 120 min at 1.2 mÄ/cm2 using a towbin buffer. Membranes were subsequently blocked (5% milk powder, 2% BSA, Tris buffered saline containing 0.05% Tween 20) and probed overnight with the primary antibody at 4°C. Primary antibodies used were anti-α-tubulin mouse antibody number T9026 (Sigma-Aldrich), anti-Hif1a rabbit antibody NB100-449, and anti-Hif2a mouse antibody NB100-132H (both Novus Biologicals) (Table 1). After washing and incubation in horseradish peroxidase (HRP)-conjugated secondary antibody, membranes were developed using Amersham ECL Plus-Solution (GE Healthcare). Secondary antibodies used were antimouse IgG, HRP-linked antibody number 7076 and antirabbit IgG, HRP-linked antibody number 7074 (all Cell Signaling) (Table 1). We performed a rat leptin ELISA (catalog number EZRL-83Km; Millipore Corp) in fetal, neonatal, and maternal serum as well as mass spectrometry for the measurement of maternal serum concentrations of corticosterone and 11-dehydrocorticosterone.
Antibody Table
| Peptide/Protein Target | Antigen Sequence (if Known) | Name of Antibody | Manufacturer, Catalog Number, and/or Name of Individual Providing the Antibody | Species Raised (Monoclonal or Polyclonal) | Dilution Used |
|---|---|---|---|---|---|
| Tubulin | Unknown | Mouse anti-α-tubulin | Sigma-Aldrich, T9026 | Mouse; monoclonal | 1:5000 |
| Hypoxia-inducible factor 1α | Unknown | Rabbit anti-Hif1a | Novus Biologicals, NB100-449 | Rabbit; polyclonal | 1:1000 |
| Hypoxia-inducible factor 2α | Unknown | Mouse anti-Hif2a | Novus Biologicals, NB100-132H | Mouse; monoclonal | 1:500 |
| IgG | Unknown; conjugated to HRP | Antimouse IgG HRP-linked antibody | Cell Signaling, number 7076 | Mouse | 1:2000 |
| IgG | Unknown; conjugated to HRP | Antirabbit IgG HRP-linked antibody | Cell Signaling, number 7074 | Rabbit | 1:2000 |
Sexing of fetuses and offspring
On days E19, E20, and E22, fetuses were sexed by PCR. Total DNA from tissue samples stored at −80°C was extracted using a commercial DNA purification kit (QIAmp DNA minikit; QIAGEN) according to the manufacturer's protocol. For PCR sexing of all fetuses, the following SRY-primers were used: AGCGTGAAGTTGCCTCAACA (forward) and CTTGGAGGACTGGTGTGCAG (reverse). A PCR was performed under standard conditions. At postnatal time points, fetuses were sexed by evaluating the distance between the anus and the urethral orifice.
Statistical analysis
All data were tested for outliers by a Grubb's test, and an outlier was excluded from some data sets. Thereafter all data sets were tested for standard distribution. Statistical analyses of blood concentrations were done by Mann-Whitney tests with a Bonferroni-adjusted significance level of P = .017 because three comparisons were done at each time point. Gene expression data were analyzed either by a one-way ANOVA including Bonferroni posttests for single group comparisons or by a Kruskal-Wallis test including Dunn's posttests for single-group comparisons, respectively. The significance level for the overall P value generated either by the an ANOVA or Kruskal-Wallis test during the analysis of gene expressions was Bonferroni-adjusted to P = .002 because we performed a comparison of 22 genes at each time point (0.05/22 = 0.002). Gene regulations of more than 1.5-fold were classified as relevant, and posttests (single group comparisons) were performed only in case of a difference of more than 1.5-fold between the compared groups. Analysis of protein concentrations (densitometric data from Western blot) was done by either an ANOVA or a Kruskal-Wallis test, again depending on data distribution. Following single-group comparisons were done by a Mann-Whitney test. Comparison of fetal and placental basic data was performed as single-group comparisons by a Mann-Whitney test with a Bonferroni-adjusted significance level of P = .006 because nine comparisons were done for each parameter. Comparison of sex distribution between the groups was done by a χ2 test. Dependency of fetal and placental basic data as well as gene expressions in fetal liver and placenta on fetal sex was analyzed by a Spearman correlation analysis. Dependency of the perinatal leptin concentrations and prenatal protein concentrations measured by Western blots on fetal sex were analyzed by a Mann-Whitney test. All data are shown as mean ± SEM.
Results
Fetal and placental growth arrest was observed after ligation and sham operation, but subsequent prenatal catch-up growth was present after sham operation only
Fetuses of groups LIG and SOP showed a subtotal arrest of weight gain 4 hours (ie, time point to evaluate acute consequences of surgery on gestational day E19) and 24 hours (ie, time point to evaluate subacute consequences of surgery on gestational day E20) after surgery. Body weight was significantly reduced in both groups 4 hours and 24 hours after surgery, compared with the respective C group. Between 24 hours and 72 hours (ie, time point to evaluate medium term consequences of surgery on gestational day E22) after surgery, fetal weight gain of group LIG (on average 1.27 g per 24 h) paralleled the weight gain of group C (1.16 g/ per 4 h), whereas fetuses of group SOP showed catch-up weight gain (1.48 g per 24 h) compared with group C. Placental weight and fetal to placental weight ratio showed a significant reduction 24 hours after surgery in fetuses of groups LIG and SOP compared with group C. In addition, placentas in group LIG showed an almost significantly (P = .019) reduced weight 24 hours after surgery compared with 4 hours after surgery. Fetal sex distribution was similar in all groups at all time points. For fetal and placental basic data, please also refer to Table 2.
Longitudinal Course of Fetal Body Weight, Placental Weight and Fetal to Placental Weight Ratio, and Sex in the Groups LIG, SOP, and C on Gestational Days E19, E20 and E22
| Day | Group | P Value | |||||
|---|---|---|---|---|---|---|---|
| LIG | SOP | C | LIG-C | LIG-SOP | SOP-C | ||
| Body weight, g | E19 | 1.52 ± 0.02 | 1.55 ± 0.02 | 1.69 ± 0.02 | <.001 | .620 | <.001 |
| E20 | 1.74 ± 0.06 | 1.80 ± 0.06 | 2.78 ± 0.12 | <.001 | .324 | <.001 | |
| E22 | 4.27 ± 0.07 | 4.75 ± 0.05 | 5.09 ± 0.10 | <.001 | <.001 | .028 | |
| Placental weight, g | E19 | 0.40 ± 0.01 | 0.40 ± 0.01 | 0.43 ± 0.02 | .130 | .924 | .149 |
| E20 | 0.36 ± 0.01 | 0.37 ± 0.01 | 0.45 ± 0.02 | <.001 | .143 | .002 | |
| E22 | 0.43 ± 0.01 | 0.45 ± 0.02 | 0.46 ± 0.01 | .114 | .310 | .750 | |
| Fetal to placental weight ratio, g/g | E19 | 3.85 ± 0.12 | 3.96 ± 0.12 | 4.00 ± 0.15 | .417 | .504 | .892 |
| E20 | 4.90 ± 0.15 | 4.90 ± 0.20 | 6.21 ± 0.27 | <.001 | .850 | <.001 | |
| E22 | 10.1 ± 0.30 | 10.6 ± 0.42 | 11.1 ± 0.30 | .018 | .301 | .322 | |
| Sex distribution (n male; female) | E19 | 11; 9 | 15; 9 | 6; 6 | 1.000 | .760 | .499 |
| E20 | 8; 20 | 13; 7 | 7; 5 | .091 | .019 | .724 | |
| E22 | 11; 9 | 10; 10 | 12; 12 | .771 | 1.000 | 1.000 | |
LIG-C, LIG-SOP, SOP-C, statistical comparisons of single groups by Mann-Whitney test or χ2 test (for sex); significance level is P < .006 in all tests. Data are shown as mean ± SEM. Bold font highlights values which were significantly different to the C group.
Fetal circulating leptin concentrations were reduced after LIG and SOP at term, but rapid postnatal compensation was observed in SOP offspring only
Interestingly, serum leptin concentrations (Figure 1) were reduced both in LIG and SOP fetuses compared with C fetuses (P < .001) on gestational day E22 (72 h after surgery). On postnatal day P1, leptin was lower in LIG offspring compared with C (P = .006) but no longer in SOP compared with C. On postnatal day P2, LIG offspring showed reduced leptin concentrations compared with both SOP (P = .009) and C (P = .026), and SOP offspring displayed the highest mean value of all three groups. On postnatal day P7, there were no significant differences between the groups. On P12, LIG tended to higher leptin concentrations compared with SOP (P = .063).
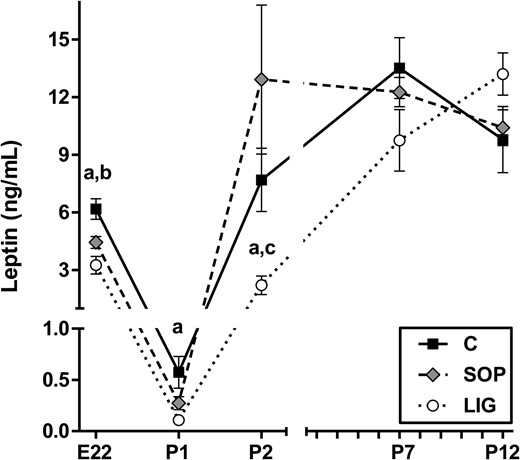
Spontaneous circulating leptin concentrations in fetal serum (gestational d E22) and in neonatal serum (P1, P2, P7, P12) are shown. C, fetuses/offspring of unoperated control dams; LIG, fetuses/offspring of dams with bilateral ligation of uterine arteries and veins; SOP, fetuses/offspring of sham-operated dams. LIG, E22, n = 7; SOP, E22, n = 15; C, E22, n = 22; LIG, P1, n = 10; SOP, P1, n = 9; C, P1, n = 10; LIG, P2, n = 5; SOP, P2, n = 6; C, P2, n = 5; LIG, P7, n = 10; SOP, P7 n = 10; C, P7, n = 10; LIG, P12, n = 10; SOP, P12, n = 10; C, P12 n = 10. Data are shown as mean ± SEM. a, Significant differences (LIG vs C); b, significant differences (SOP vs C); c, significant differences (LIG vs SOP).
Longitudinal data analysis within the different groups revealed a massive reduction of circulating leptin concentrations between gestational day E22 and postnatal day P1 in all groups of offspring (LIG, 30-fold reduction; SOP, 16-fold reduction; C, 11-fold reduction; all P < .001). This was followed by a surge of leptin concentrations between days P1 and P2 in all groups of offspring (P < .001), which was weakest in LIG and strongest in SOP offspring (Figure 1). Between days P2 and P7, a further surge was detected in LIG (P < .001) and C offspring (P = .031) but not in SOP offspring. None of the groups showed significant differences in leptin concentrations between days P7 and P12.
Gene expression data indicated increased hepatic leptin degradation in LIG fetuses only but reduced placental leptin production both in groups LIG and SOP
Lep and Lepr-b (full length leptin receptor) gene expressions were not detectable in fetal liver. We observed a significant and relevant (>1.5-fold) transcriptional induction of Lepr-a (E20, 2.1-fold; E22, 1.8-fold; Table 3) in LIG fetuses compared with fetuses of group C. Moreover, hepatic Phd3 gene expression was increased on all prenatal days analyzed (E19, 3.3-fold; E20, 2.4-fold; E22, 1.8-fold; Table 3), indicating a persisting molecular response to hypoxia. In livers of SOP fetuses, we observed significant and relevant transcriptional inductions of Hif2a (E19, 1.6-fold) and Phd3 (E19, 3.2-fold) exclusively on day E19 (Table 3). Leptin receptor gene expressions were not significantly regulated in SOP fetuses at any time. Further relevant transcriptional inductions could be demonstrated for Pai1 (LIG E19, 3.6-fold; LIG E20, 5.0-fold; SOP E19, 4.6-fold), IL10 (LIG E19, 1.8-fold), and Timp1 (SOP E19, 2.7-fold; Table 4).
Expression of Genes Involved in Leptin Metabolism and Cellular Hypoxic Response in Fetal Liver of the Groups LIG, SOP and C on Gestational Days E19, E20, and E22
| Gene | Day | LIG | SOP | C | ANOVA | LIG-C | LIG-SOP | SOP-C |
|---|---|---|---|---|---|---|---|---|
| Lep | E19 | n.d. | n.d. | n.d. | — | — | — | — |
| E20 | n.d. | n.d. | n.d. | — | — | — | — | |
| E22 | n.d. | n.d. | n.d. | — | — | — | — | |
| Lepr-a | E19 | 6.33 ± 0.63 | 6.08 ± 0.44 | 4.92 ± 0.52 | 0.244 | — | — | — |
| E20 | 3.38 ± 0.47 | 2.26 ± 0.23 | 1.60 ± 0.11 | 0.008 | a | — | — | |
| E22 | 1.80 ± 0.25 | 0.96 ± 0.08 | 1.00 ± 0.10 | <0.001 | b | b | — | |
| Lepr-b | E19 | n.d. | n.d. | n.d. | — | — | — | — |
| E20 | n.d. | n.d. | n.d. | — | — | — | — | |
| E22 | n.d. | n.d. | n.d. | — | — | — | — | |
| Hif1a | E19 | 1.48 ± 0.10 | 1.60 ± 0.08 | 1.59 ± 0.15 | 0.636 | — | — | — |
| E20 | 1.70 ± 0.09 | 1.55 ± 0.12 | 1.78 ± 0.08 | 0.337 | — | — | — | |
| E22 | 1.19 ± 0.04 | 1.18 ± 0.03 | 1.00 ± 0.09 | 0.051 | — | — | — | |
| Hif2a | E19 | 1.06 ± 0.04 | 1.31 ± 0.07 | 0.81 ± 0.03 | <0.001 | — | — | c |
| E20 | 0.90 ± 0.03 | 0.84 ± 0.03 | 0.74 ± 0.03 | 0.007 | — | — | — | |
| E22 | 1.01 ± 0.04 | 0.95 ± 0.03 | 1.00 ± 0.03 | 0.333 | — | — | — | |
| Phd1 | E19 | 0.52 ± 0.03 | 0.68 ± 0.03 | 0.58 ± 0.05 | 0.005 | — | — | — |
| E20 | 0.71 ± 0.04 | 0.81 ± 0.04 | 0.91 ± 0.10 | 0.068 | — | — | — | |
| E22 | 0.93 ± 0.05 | 1.00 ± 0.05 | 1.00 ± 0.06 | 0.437 | — | — | — | |
| Phd2 | E19 | 2.90 ± 0.20 | 3.41 ± 0.15 | 2.53 ± 0.28 | 0.012 | — | — | — |
| E20 | 3.26 ± 0.23 | 2.96 ± 0.10 | 2.40 ± 0.18 | 0.020 | — | — | — | |
| E22 | 1.40 ± 0.06 | 1.23 ± 0.04 | 1.00 ± 0.06 | <0.001 | — | — | — | |
| Phd3 | E19 | 1.66 ± 0.21 | 1.62 ± 0.18 | 0.51 ± 0.07 | <0.001 | c | — | c |
| E20 | 3.09 ± 0.36 | 1.67 ± 0.15 | 1.28 ± 0.22 | <0.001 | c | b | — | |
| E22 | 1.77 ± 0.16 | 1.38 ± 0.09 | 1.00 ± 0.09 | <0.001 | c | — | — | |
| Hif1an | E19 | 2.49 ± 0.10 | 2.84 ± 0.15 | 2.00 ± 0.21 | 0.005 | — | — | — |
| E20 | 3.18 ± 0.26 | 2.98 ± 0.10 | 2.39 ± 0.19 | 0.063 | — | — | — | |
| E22 | 1.34 ± 0.05 | 1.25 ± 0.04 | 1.00 ± 0.07 | <0.001 | — | — | — | |
| Vegfa | E19 | 0.81 ± 0.05 | 0.96 ± 0.07 | 0.71 ± 0.20 | 0.022 | — | — | — |
| E20 | 1.15 ± 0.10 | 1.10 ± 0.11 | 0.95 ± 0.09 | 0.431 | — | — | — | |
| E22 | 0.95 ± 0.05 | 0.92 ± 0.04 | 1.00 ± 0.06 | 0.464 | — | — | — |
Abbreviation: n.d., not determined. For gene abbreviations, see Quantitative RT-PCR in Materials and Methods. Data are displayed as relative units (RU). Expression data of each gene were normalized to the E22 mean value of group C. Overall P value of the one-way ANOVA or Kruskal-Wallis-test is indicated. Dashes indicate that a posttest was not done because of a less than 1.5-fold change. Bold font highlights values which were both changed more than 1.5-fold and significantly different compared to the C group.
Significant posttest (P < .05).
Significant posttest (P < .01).
Significant posttest (P < .001).
Expression of Genes Involved in Inflammation and Tissue Remodeling in Fetal Liver of the Groups LIG, SOP, and C on Gestational Days E19, E20, and E22
| Gene | Day | LIG | SOP | C | ANOVA | LIG-C | LIG-SOP | SOP-C |
|---|---|---|---|---|---|---|---|---|
| Tgfb1 | E19 | 1.85 ± 0.10 | 2.00 ± 0.12 | 1.68 ± 0.16 | 0.226 | — | — | — |
| E20 | 1.50 ± 0.11 | 1.34 ± 0.13 | 1.53 ± 0.10 | 0.470 | — | — | — | |
| E22 | 1.22 ± 0.08 | 1.10 ± 0.08 | 1.00 ± 0.09 | 0.142 | — | — | — | |
| Pai1 | E19 | 0.86 ± 0.09 | 1.10 ± 0.13 | 0.24 ± 0.03 | <0.001 | a | — | a |
| E20 | 1.31 ± 0.23 | 0.45 ± 0.08 | 0.26 ± 0.04 | <0.001 | a | b | ns | |
| E22 | 1.29 ± 0.25 | 0.85 ± 0.11 | 1.00 ± 0.17 | 0.599 | — | — | — | |
| IL10 | E19 | 1.23 ± 0.18 | 0.81 ± 0.04 | 0.69 ± 0.08 | 0.009 | c | c | — |
| E20 | 0.84 ± 0.04 | 0.79 ± 0.04 | 0.74 ± 0.04 | 0.236 | — | — | — | |
| E22 | 1.16 ± 0.07 | 1.15 ± 0.07 | 1.00 ± 0.07 | 0.274 | — | — | — | |
| Mmp2 | E19 | 1.08 ± 0.08 | 1.14 ± 0.10 | 0.99 ± 0.09 | 0.558 | — | — | — |
| E20 | 0.46 ± 0.05 | 0.51 ± 0.07 | 0.64 ± 0.09 | 0.167 | — | — | — | |
| E22 | 1.23 ± 0.08 | 1.26 ± 0.07 | 1.00 ± 0.07 | 0.016 | — | — | — | |
| Mmp9 | E19 | 0.29 ± 0.02 | 0.33 ± 0.03 | 0.32 ± 0.05 | 0.548 | — | — | — |
| E20 | 0.38 ± 0.04 | 0.34 ± 0.05 | 0.34 ± 0.05 | 0.784 | — | — | — | |
| E22 | 1.07 ± 0.10 | 0.87 ± 0.09 | 1.00 ± 0.11 | 0.373 | — | — | — | |
| Timp1 | E19 | 0.82 ± 0.05 | 2.10 ± 0.31 | 0.79 ± 0.06 | <0.001 | — | a | b |
| E20 | 2.79 ± 0.46 | 2.08 ± 0.36 | 2.90 ± 0.34 | 0.349 | — | — | — | |
| E22 | 0.96 ± 0.12 | 1.07 ± 0.17 | 1.00 ± 0.14 | 0.881 | — | — | — | |
| Timp2 | E19 | 0.73 ± 0.07 | 0.87 ± 0.06 | 0.76 ± 0.07 | 0.257 | — | — | — |
| E20 | 0.53 ± 0.05 | 0.60 ± 0.07 | 0.66 ± 0.08 | 0.405 | — | — | — | |
| E22 | 1.10 ± 0.06 | 1.06 ± 0.09 | 1.00 ± 0.10 | 0.745 | — | — | — | |
| Pcna | E19 | 3.90 ± 0.24 | 4.12 ± 0.31 | 3.77 ± 0.28 | 0.709 | — | — | — |
| E20 | 3.59 ± 0.19 | 3.37 ± 0.31 | 2.92 ± 0.30 | 0.237 | — | — | — | |
| E22 | 1.35 ± 0.06 | 1.08 ± 0.11 | 1.00 ± 0.09 | 0.025 | — | — | — |
Abbreviation: ns, not significant. For gene abbreviations see Quantitative RT-PCR in Materials and Methods. Data are displayed as relative units (RU). Expression data of each gene were normalized to the E22 mean value of group C. Overall P value of a one-way ANOVA or Kruskal-Wallis-test is indicated. Dashes indicate that a posttest was not done because of a less than 1.5-fold change. Bold font highlights values which were both changed more than 1.5-fold and significantly different compared to the C group.
Significant posttest (P < .001).
Significant posttest (P < .01).
Significant posttest (P < .05).
In placental tissue of LIG fetuses compared with fetuses of group C, the only significant and relevant (>1.5-fold) transcriptional induction was observed for Phd3 on day E19 (1.6-fold; Table 5). However, we observed significant and relevant transcriptional suppressions for many genes, including Lep (E19, −1.8-fold; E20, −6.3-fold; E22, −2.8-fold), Hif2a (E20, −1.7-fold), and Vegfa (E20, −1.7-fold; Table 5). In placentas of group SOP, we also observed a significant and relevant (>1.5-fold) transcriptional induction of Phd3 (E19, 1.7-fold) and a transcriptional suppression of Lep (E20, −6.3-fold; E22, −1.6-fold; Table 5). Further relevant transcriptional suppressions could be demonstrated for Il10 (LIG E19, −1.9-fold; LIG E20, −2.0-fold; SOP E19, −1.5-fold; SOP E20, −1.5-fold), Timp1 (LIG E20, −1.8-fold; SOP E20, −1.7-fold), and Timp2 (LIG E20, −2.0-fold; SOP E20, −1.6-fold; Table 6).
Expression of Genes Involved in Leptin Metabolism and Cellular Hypoxic Response in Placenta of the Groups LIG, SOP, and C on Gestational Days E19, E20, and E22
| Gene | Day | LIG | SOP | C | ANOVA | LIG-C | LIG-SOP | SOP-C |
|---|---|---|---|---|---|---|---|---|
| Lep | E19 | 0.005 ± 0.001 | 0.006 ± 0.001 | 0.009 ± 0.001 | 0.019 | a | — | ns |
| E20 | 0.04 ± 0.01 | 0.04 ± 0.01 | 0.25 ± 0.03 | <0.001 | b | — | b | |
| E22 | 0.36 ± 0.04 | 0.64 ± 0.07 | 1.00 ± 0.11 | <0.001 | b | ns | c | |
| Lepr-a | E19 | 0.55 ± 0.05 | 0.51 ± 0.03 | 0.47 ± 0.05 | 0.484 | — | — | — |
| E20 | 0.71 ± 0.04 | 0.72 ± 0.05 | 0.96 ± 0.06 | 0.002 | — | — | — | |
| E22 | 0.71 ± 0.06 | 0.83 ± 0.09 | 1.00 ± 0.06 | 0.011 | — | — | — | |
| Lepr-b | E19 | 1.06 ± 0.07 | 0.93 ± 0.06 | 0.74 ± 0.07 | 0.009 | — | — | — |
| E20 | 0.94 ± 0.06 | 0.93 ± 0.06 | 1.16 ± 0.08 | 0.051 | — | — | — | |
| E22 | 0.76 ± 0.06 | 0.78 ± 0.08 | 1.00 ± 0.08 | 0.033 | — | — | — | |
| Hif1a | E19 | 0.52 ± 0.05 | 0.68 ± 0.05 | 0.51 ± 0.05 | 0.036 | — | — | — |
| E20 | 0.81 ± 0.05 | 1.06 ± 0.04 | 1.10 ± 0.03 | <0.001 | — | — | — | |
| E22 | 0.88 ± 0.04 | 0.97 ± 0.05 | 1.00 ± 0.05 | 0.121 | — | — | — | |
| Hif2a | E19 | 0.83 ± 0.10 | 0.81 ± 0.07 | 0.73 ± 0.10 | 0.750 | — | — | — |
| E20 | 0.80 ± 0.06 | 1.00 ± 0.09 | 1.35 ± 0.14 | <0.001 | b | — | — | |
| E22 | 0.69 ± 0.04 | 0.79 ± 0.05 | 1.00 ± 0.04 | <0.001 | b | — | — | |
| Phd1 | E19 | 0.91 ± 0.02 | 0.98 ± 0.02 | 0.94 ± 0.02 | 0.066 | — | — | — |
| E20 | 1.15 ± 0.03 | 1.27 ± 0.04 | 1.25 ± 0.04 | 0.040 | — | — | — | |
| E22 | 0.95 ± 0.03 | 1.00 ± 0.02 | 1.00 ± 0.02 | 0.267 | — | — | — | |
| Phd2 | E19 | 1.01 ± 0.03 | 1.03 ± 0.03 | 0.91 ± 0.03 | 0.063 | — | — | — |
| E20 | 1.20 ± 0.03 | 1.18 ± 0.03 | 1.17 ± 0.05 | 0.780 | — | — | — | |
| E22 | 1.03 ± 0.03 | 1.03 ± 0.03 | 1.00 ± 0.02 | 0.764 | — | — | — | |
| Phd3 | E19 | 0.80 ± 0.05 | 0.88 ± 0.08 | 0.51 ± 0.05 | <0.002 | c | — | c |
| E20 | 1.17 ± 0.08 | 1.21 ± 0.09 | 1.04 ± 0.17 | 0.578 | — | — | — | |
| E22 | 1.47 ± 0.15 | 1.14 ± 0.13 | 1.00 ± 0.08 | 0.020 | — | — | — | |
| Hif1an | E19 | 0.77 ± 0.02 | 0.79 ± 0.02 | 0.86 ± 0.02 | 0.029 | — | — | — |
| E20 | 0.86 ± 0.03 | 1.00 ± 0.02 | 1.05 ± 0.03 | <0.001 | — | — | — | |
| E22 | 0.96 ± 0.02 | 0.90 ± 0.01 | 1.00 ± 0.06 | 0.383 | — | — | — | |
| Vegfa | E19 | 0.75 ± 0.05 | 0.78 ± 0.04 | 0.73 ± 0.06 | 0.731 | — | — | — |
| E20 | 0.63 ± 0.03 | 0.78 ± 0.04 | 1.04 ± 0.05 | <0.001 | b | — | — | |
| E22 | 0.86 ± 0.03 | 1.14 ± 0.04 | 1.00 ± 0.04 | <0.001 | — | — | — |
Abbreviation: ns, not significant. For gene abbreviations, see Quantitative RT-PCR in Materials and Methods. Data are displayed as relative units (RU). Expression data of each gene were normalized to the E22 mean value of group C. Overall P value of one-way ANOVA or Kruskal-Wallis-test is indicated. Dashes indicate a posttest was not done because of a less than 1.5-fold change. Bold font highlights values which were both changed more than 1.5-fold and significantly different compared to the C group.
Significant posttest (P < .05).
Significant posttest (P < .001).
Significant posttest (P < .01).
Expression of Genes Involved in Inflammation and Tissue Remodeling in Placenta of the Groups LIG, SO, P and C on Gestational Days E19, E20, and E22
| Gene | Day | LIG | SOP | C | ANOVA | LIG-C | LIG-SOP | SOP-C |
|---|---|---|---|---|---|---|---|---|
| Tgfb1 | E19 | 0.76 ± 0.05 | 0.80 ± 0.05 | 0.88 ± 0.06 | 0.385 | — | — | — |
| E20 | 0.85 ± 0.04 | 0.87 ± 0.05 | 1.19 ± 0.09 | <0.001 | — | — | — | |
| E22 | 0.87 ± 0.07 | 1.04 ± 0.08 | 1.00 ± 0.06 | 0.217 | — | — | — | |
| Pai1 | E19 | 1.00 ± 0.16 | 1.01 ± 0.09 | 1.18 ± 0.18 | 0.666 | — | — | — |
| E20 | 0.84 ± 0.09 | 1.16 ± 0.17 | 1.32 ± 0.17 | 0.059 | ns | — | — | |
| E22 | 1.47 ± 0.14 | 1.36 ± 0.16 | 1.00 ± 0.15 | 0.074 | — | — | — | |
| IL10 | E19 | 0.74 ± 0.06 | 0.92 ± 0.05 | 1.42 ± 0.09 | <0.001 | a | — | a |
| E20 | 0.80 ± 0.12 | 1.03 ± 0.10 | 1.56 ± 0.17 | 0.001 | a | — | b | |
| E22 | 0.87 ± 0.09 | 1.12 ± 0.08 | 1.00 ± 0.10 | 0.198 | — | — | — | |
| Mmp2 | E19 | 0.43 ± 0.08 | 0.51 ± 0.05 | 0.34 ± 0.06 | 0.218 | — | — | — |
| E20 | 0.63 ± 0.09 | 0.64 ± 0.09 | 0.95 ± 0.15 | 0.102 | — | — | — | |
| E22 | 1.05 ± 0.12 | 1.37 ± 0.20 | 1.00 ± 0.08 | 0.627 | — | — | — | |
| Mmp9 | E19 | 1.08 ± 0.16 | 1.30 ± 0.14 | 1.02 ± 0.17 | 0.415 | — | — | — |
| E20 | 1.38 ± 0.16 | 1.32 ± 0.14 | 1.13 ± 0.21 | 0.607 | — | — | — | |
| E22 | 1.10 ± 0.15 | 0.76 ± 0.06 | 1.00 ± 0.10 | 0.098 | — | — | — | |
| Timp1 | E19 | 0.55 ± 0.06 | 0.62 ± 0.04 | 0.56 ± 0.07 | 0.551 | — | — | — |
| E20 | 0.79 ± 0.07 | 0.84 ± 0.10 | 1.44 ± 0.14 | <0.001 | a | — | a | |
| E22 | 0.71 ± 0.06 | 0.86 ± 0.07 | 1.00 ± 0.07 | 0.024 | — | — | — | |
| Timp2 | E19 | 0.85 ± 0.10 | 0.86 ± 0.09 | 0.78 ± 0.13 | 0.874 | — | — | — |
| E20 | 0.62 ± 0.05 | 0.77 ± 0.05 | 1.23 ± 0.12 | <0.001 | a | — | a | |
| E22 | 0.70 ± 0.06 | 1.02 ± 0.08 | 1.00 ± 0.06 | 0.002 | — | — | — | |
| Pcna | E19 | 0.72 ± 0.06 | 0.80 ± 0.05 | 0.87 ± 0.06 | 0.212 | — | — | — |
| E20 | 0.90 ± 0.04 | 1.09 ± 0.05 | 1.07 ± 0.08 | 0.020 | — | — | — | |
| E22 | 0.99 ± 0.04 | 1.07 ± 0.03 | 1.00 ± 0.04 | 0.347 | — | — | — |
Abbreviation: ns, not significant. For gene abbreviations, see Quantitative RT-PCR in Materials and Methods. Data are displayed as relative units (RU). Expression data of each gene were normalized to the E22 mean value of group C. Overall P value of one-way ANOVA or Kruskal-Wallis-test is indicated. Dashes indicate a posttest was not done because of a less than 1.5-fold change. Bold font highlights values which were both changed more than 1.5-fold and significantly different compared to the C group.
Significant posttest (P < .001).
Significant posttest (P < .05).
With the aim to get insights into the physiological ontogenetic regulation of gene expression in fetal livers and placental tissue, we also evaluated normal ontogenesis of gene expression in control animals (see Supplemental Table 2 for a summary). In fetal livers, we observed a significant, −4.9-fold ontogenetic transcriptional regulation of the short leptin receptor (Lepr-a; Table 3). Moreover, we observed a significant and relevant regulations of Hif1a (−1.8-fold), Phd1 (1.7-fold), Phd2 (−2.5-fold), and Hif1an (−3.4-fold; all Table 3) as well as Tgfb1 (−1.7-fold), Pai1 (4.2-fold), Mmp9 (3.1-fold), and Pcna (−3.8-fold; all Table 4). In placental tissue, leptin (Lep) gene expression showed a 111-fold increase between day E19 and E22 (28-fold between E19 and E20 and a further 4-fold between E20 and E22; Table 5) in control animals, indicating strongly increasing placental leptin production with ongoing pregnancy. Other placental genes significantly regulated during ontogenesis more than 1.5-fold were short leptin receptor (Lepr-a, 2.1-fold), Hif1a (2.2-fold), Hif2a (1.8-fold), and Phd3 (2.0-fold; all Table 5) as well as Mmp2 (2.9-fold) and Timp1 (2.6-fold; both Table 6).
Intrauterine position affects Hif1a protein expression in liver of LIG fetuses
Especially in liver tissue of LIG fetuses located in an intrauterine position near to the ligation (positions 1 and 2), a Western blot analysis revealed increased Hif1a protein stabilization compared with fetuses in positions 3 (intermediate position) and 4 (far from the ligation) on days E19 (Supplemental Figure 1A) and E22 (Supplemental Figure 1C). In placentas of the LIG group located either in position 1 or 2, there was no clearly increased Hif1a stabilization on days E19, E20, and E22 (Supplemental Figures 1, D–F,) compared with the other positions. Due to the positional dependency of Hif1a protein in fetal liver, we decided to exclusively use tissue from intrauterine position 2 for all analyses of Hif1a or Hif2a tissue protein concentrations between the different groups.
Hif1a and Hif2a protein expressions were reduced in livers of LIG fetuses
Surprisingly, densitometric ratios of Hif1a to tubulin proteins in fetal liver tissue were significantly reduced in LIG fetuses compared with C fetuses on gestational day E20 (24 h after surgery, P = .017, Figure 2B and Supplemental Figure 2B). Moreover, densitometric ratios of Hif2a to tubulin proteins in fetal liver tissue were significantly reduced in LIG fetuses compared with C fetuses on day E19 (4 h after surgery, P = .009, Figure 3A and Supplemental Figure 3A) and E22 (72 h after surgery, P = .009, Figure 3C and Supplemental Figure 3C) after surgery. On days E19 and E22, fetal hepatic Hif1a protein concentrations were similar in all groups (Figure 2, A and C, and Supplemental Figure 2, A and C), as was fetal hepatic Hif2a concentration on day E20 (Figure 3B and Supplemental Figure 3B). In placental tissue, densitometric ratios of both Hif1a to tubulin and Hif2a to tubulin proteins were similar on gestational days E19, E20, and E22 (see Supplemental Figures 4 and 5). Thus, we did not find the expected increase of Hifs in LIG placentas and livers but a decrease of either Hif1a or Hif2a in livers of LIG fetuses at all prenatal time points.
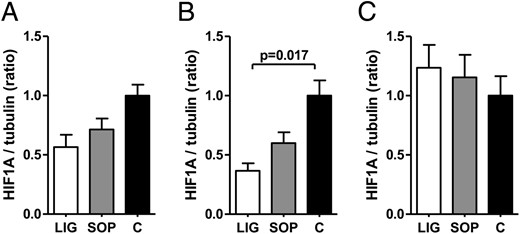
Densitometric ratios of HIF-1α (HIF1A) protein expression and tubulin protein expression (tubulin served as loading control) in fetal liver of groups LIG, SOP, and C on gestational day E19 (A), E20 (B), and E22 (C). Tissue samples were derived from the livers of fetuses in uterine position 2 (second most caudal position). C, fetuses of unoperated control dams; LIG, fetuses of dams with bilateral ligation of uterine arteries and veins; SOP, fetuses of sham-operated dams. LIG, E19, n = 5; SOP, E19, n = 6; C, E19, n = 3; LIG, E20, n = 7; SOP, E20, n = 5; C, E20, n = 3; LIG, E22, n = 5; SOP, E22, n = 5; C, E22, n = 6. Data are shown as mean ± SEM. Significant differences are indicated by the P value. For Western blots see Supplemental Figure 2.
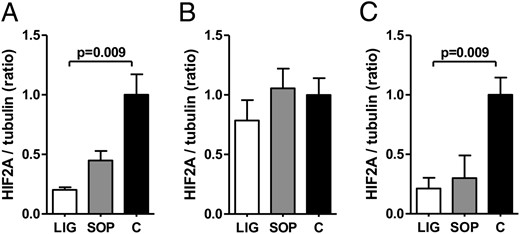
Densitometric ratios of HIF-2α (HIF2A) protein expression and tubulin protein expression (tubulin served as loading control) in the fetal liver of groups LIG, SOP, and C on gestational day E19 (A), E20 (B), and E22 (C). Tissue samples were derived from the livers of fetuses in uterine position 2 (second most caudal position). C, fetuses of unoperated control dams; LIG, fetuses of dams with bilateral ligation of uterine arteries and veins; SOP, fetuses of sham-operated dams. LIG, E19, n = 5; SOP, E19, n = 6; C, E19, n = 3; LIG, E20, n = 7; SOP, E20, n = 5; C, E20, n = 3; LIG, E22, n = 5; SOP, E22, n = 5; C, E22, n = 6. Data are shown as mean ± SEM. Significant differences are indicated by the P value. One outlier was identified by Grubb's test in group SOP on day E22 (C) and excluded. For Western blots, see Supplemental Figure 3.
No correlation of sex with fetal and placental basic data or gene expressions
We did not observe any significant effect of fetal sex on our data, including gene expressions in fetal liver and placenta, fetal body weight, placental weight, fetal to placental weight ratio, intrauterine position, perinatal leptin concentrations, and placental as well as fetal protein concentrations measured by Western blot.
Maternal circulating leptin concentrations were significantly affected neither by ligation nor by sham operation
Maternal circulating leptin concentrations on days E19, E20, and E22 were similar in all three groups of LIG, SOP, and C (Figure 4A). LIG and SOP dams only had slightly increased leptin concentrations 24 hours after surgery (day E20; P > .1 in all comparisons). Leptin concentrations rapidly decreased in all groups between day E20 and day E22 (ie, 72 h after surgery in LIG and SOP dams) and LIG and SOP dams showed slightly decreased leptin concentrations compared with C on E22 (P > .1 in all comparisons; Figure 4A). Thus, we did not find clear evidence for altered maternal leptin availability in any of the groups at any time point. Fetal to maternal ratios of leptin concentration on day E22 tended to be reduced in LIG (2.00 ± 0.29 mg/mL) compared with both SOP (3.32 ± 0.48 mg/mL; P = .087) and C (3.12 ± 0.32 mg/mL; P = .064).
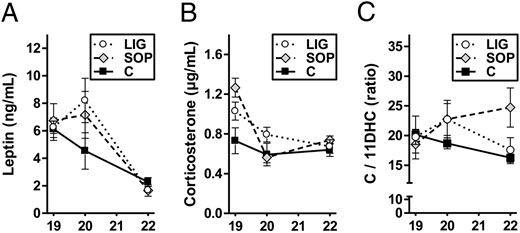
Spontaneous circulating leptin concentrations (A) and corticosterone concentrations (B) as well as the ratio of corticosterone (C) to 11-dehydrocorticosterone (11DHC; panel C) concentrations in dams of the groups LIG, SOP, and C on gestational days E19 (4 h after surgery in groups LIG and SOP), E20 (24 h after surgery in groups LIG and SOP), and E22 (72 h after surgery in groups LIG and SOP) are displayed. LIG, E19, n = 4; SOP, E19, n = 4; C, E19, n = 4; LIG, E20, n = 6; SOP, E20, n = 4; C, E20, n = 4; LIG, E22, n = 4; SOP, E22, n = 3; C, E22, n = 6. One leptin outlier was identified by Grubb's test in group C on day E22 and excluded. For group legends see the picture. Data are shown as mean ± SEM.
Maternal corticosterone concentrations (Figure 4B) on day E19 (ie, 4 h after surgery in groups LIG and SOP) tended to be elevated in SOP dams (P = .057 compared with C dams), indicating a stress response as expected, which normalized on day E20. On day E22, group SOP tended to show an elevated corticosterone to 11-dehydrocorticosterone ratio (P = .095 compared with C dams), indicating less efficient overall corticosterone degradation (Figure 4C).
Discussion
Fetal leptin availability during perinatal development is of high interest because it affects both short-term development and long-term health and disease (8–16). There is accumulating evidence that dysregulation of leptin could be one of the key mechanisms of fetal metabolic programming. This study was designed to further elucidate regulatory mechanisms of perinatal leptin availability in rat fetuses affected by IUGR at the end of pregnancy. IUGR was either induced by experimental uteroplacental insufficiency due to bilateral LIG of the uterine arteries and veins or by stress during pregnancy due to SOP. Both experimental groups were compared with the healthy C fetuses and among one another.
Basically, fetal leptin can originate from the maternal circulation, the placenta, or fetal tissues. In humans, the ex vivo-perfused term placenta secretes approximately 30% of its leptin production to the fetal side, and approximately 70% to the maternal side (22). Moreover, placental leptin production increases with increasing fetal to placental weight ratio (22). Given that the term placenta produces a similar amount of leptin as the maternal adipose tissue (23) and that fetal weight at term is approximately 5%–10% of maternal weight, the human placenta secretes a high amount of leptin to the fetus.
In rats, leptin expression by the placenta is first detectable on gestational day E13 (24). The gene expression constantly increases during pregnancy until term (gestational day E22.5), when the placenta expresses leptin mRNA at similar levels as maternal adipose tissue (25). In contrast, fetal leptin expression is present in rodents in various fetal tissues (heart, bone, liver, and lung) but at low levels only. Fetal adipose tissue mass is very low (24). Thus, fetal leptin production does not sufficiently contribute to circulating fetal leptin. However, leptin protein is detectable in serum of third-trimester fetal rats in significant amounts and shows a peak at term (26). Thus, most circulating fetal leptin originates either from placental leptin secretion to the rat fetus or transplacental leptin supply. However, the fetus has the possibility to regulate leptin concentrations by degradation of leptin via internalization into cells. The C-terminally truncated (short) isoform of the leptin receptor (Lepr-a) is thought to be a main mediator of leptin internalization and degradation (27). In the placenta, this receptor may be primarily responsible for transplacental leptin transport (28).
We demonstrate significantly decreased availability of circulating leptin not only in LIG fetuses but also in SOP fetuses shortly before term (on gestational day E22; term is E22.5). Maternal circulating leptin concentrations may not provide a sufficient explanation for this finding because they are only slightly but not significantly different between the groups on all gestational days analyzed in our study (E19, E20, and E22). Thus, placental or fetal mechanisms seem to be of particular importance for alterations of fetal leptin availability in our model. By calculating the fetal to maternal circulating leptin ratio, we demonstrate that all fetuses have a 2- to 3-fold higher leptin concentrations than the dams on day E22. This suggests either an active maternal-fetal leptin transport under the control of the placenta or direct placental leptin secretion to the fetuses in all of our groups. In addition, LIG fetuses display an almost significantly decreased fetal to maternal circulating leptin ratio compared with SOP and C, indicating reduced placental leptin production, reduced transplacental leptin transport, and/or increased fetal leptin degradation, especially in LIG fetuses. Indeed, we show a strong reduction of placental leptin gene expression in groups LIG and SOP, which is even more pronounced in LIG. The hepatic gene expression of the short leptin receptor (Lepr-a) was increased in LIG fetuses only. The placental gene expression of Lepr-a was slightly, but not significantly, decreased in the groups LIG and SOP on gestational days E20 and E22. In summary, we provide evidence that reduced placental leptin production probably contributes to reduce leptin availability in both LIG and, less pronounced, also in SOP fetuses. Increased fetal leptin degradation may aggravate the leptin reduction in LIG fetuses. Slightly decreased transplacental leptin transport to the fetuses may also contribute to decreased leptin availability in LIG and SOP fetuses.
The postnatal course of circulating leptin in the offspring gives further interesting insights. On P1, all groups show a massive reduction of leptin concentrations compared with E22. This is in line with the conclusion that leptin derived from the placenta or delivered to the fetus by transplacental transport and not leptin originating from fetal tissues determines leptin concentrations in fetal rats before term. After birth, we show persisting hypoleptinemia in LIG offspring but rapid compensation of prenatal hypoleptinemia in SOP offspring. Thus, persisting postnatal hypoleptinemia is exclusively present in offspring after uteroplacental insufficiency. Because the postnatal period is critical for the programming of leptin sensitivity (8, 9, 20), this finding offers a mechanistic explanation for the perinatal origin of leptin resistance in adult LIG offspring (16).
In an attempt to further elucidate the molecular upstream mechanisms leading to altered gene expressions of placental leptin as well as placental and fetal hepatic Lepr-a after experimental uteroplacental insufficiency or stress, we focused on mechanisms known to be involved in leptin regulation, namely hypoxia (17, 18) and tissue damage/inflammation (19).
In case of pronounced hypoxia, the transcription factors Hif1 and Hif2 are activated after an initial stabilization of their alpha subunits (Hif1a, Hif2a) (29, 30). The leptin gene can be transactivated by Hif1 and Hif2 (30, 31). Thus, oxygen may be a critical up-regulator of leptin expression (32), but the exact coherencies remain unclear. In former clinical studies, our group showed increased leptin gene expression in placental tissue, which was potentially exposed to acute or chronic hypoxia, but we did not quantify expressions of Hifs or prolyl hydroxylases in the studies (33, 34). In preeclampsia, concomitantly elevated placental leptin and Hif1a expressions were demonstrated on a gene and protein level (35), but a causal relationship has not been proven. Fetal hyperleptinemia was described in IUGR pregnancies, but it is not known whether increased placental leptin production originates from relatively hypoxic or even from hyperoxic placental areas (36). Moreover, placental leptin gene expression was decreased at term in our rat model of experimental uteroplacental insufficiency (37). Likewise, short-term hypoxia and short-term carbon monoxide inhalation induced decreased leptin synthesis in adipose tissue of adult rats (38). In primary human trophoblasts in vitro, we also observed suppressed placental leptin production under hypoxic conditions (39). In line with these findings, a reduction of uteroplacental blood flow by partial clipping of the abdominal aorta and the ovarian arteries (reduced uterine perfusion pressure procedure) results in a significant decrease of circulating maternal leptin concentrations (40). In summary, it remains unclear how hypoxia exactly interacts with leptin expression.
In placentas, our present study shows neither clearly increased Hif1a protein near to the ligation site nor significant differences of HIF1a or HIF2a between the groups LIG, SOP, and C. However, we demonstrate a rapid induction of prolyl hydroxylase 3 (Phd3) gene expression in LIG and SOP placentas, which is present on gestational day E19 only. This indicates a rapid, effective but short response to placental hypoxia. Hif1a and Hif2a may be quickly brought back to normal by Phd3 or other counterregulatory mechanisms not analyzed (40, 41). Concomitantly, we show a persisting reduction of placental leptin gene expression in both LIG and SOP placentas from day E19/20 until day E22. We conclude that the decrease in placental leptin gene expression may be either induced by molecules involved in a late response to hypoxia or caused by further mechanisms not analyzed, like metabolic adaptations (40). In fetuses, an interesting aspect of our study is that factors activated in response to hypoxia seem to reduce Hifs. In fetal liver tissue, prolonged induction of Phd3 as well as reduced concentrations of either Hif1a or Hif2a until 72 hours after surgery (d E22) were exclusively detected in LIG fetuses but not in SOP fetuses. The persisting hypoxia-associated response in LIG fetuses may be driven by persistently reduced blood flow to LIG placentas or from further adaptations affecting oxygen homeostasis (40).
With respect to molecular regulation of leptin expression by factors relevant in tissue damage or inflammation (19), we provide data about a strong up-regulation of plasminogen activator inhibitor-1 (Pai1) gene expression, especially in fetal livers of LIG, but also SOP fetuses, as well as tissue inhibitor of metalloproteinase (Timp)-1 in livers of SOP fetuses and a down-regulation of Timp1 and Timp2 in LIG and SOP placentas. Data on the interaction between Pai1 and leptin are scarce. Leptin administration to young women did not affect Pai1 concentrations (42). However, Pai1 may be a marker of hypoxia (43), inflammation, or coagulation processes (44) in our model. Tissue inhibitor of metalloproteinase 1 (Timp-1) gene expression is increased by administration of leptin to rat liver cells (45). Timp-2-deficient mice show a tendency for hyperleptinemia and are leptin resistant (46). Thus, leptin and Timps may affect each other, and our finding of concomitant reduction of placental Lep and Timps in livers of LIG and SOP fetuses may support this hypothesis.
Lastly, we show a strong ontogenetic down-regulation of Lepr-a in the fetal livers of healthy controls as well as an up-regulation of Lepr-a in placenta and the well-known massive ontogenetic up-regulation of placental leptin production toward the end of gestation (24). These findings support the conclusion that fetal leptin demand increases toward term in rats and that leptin plays an important role during the perinatal developmental window (20).
In summary, we provide evidence that reduced placental leptin production and increased fetal leptin degradation contribute to reduced leptin availability in IUGR offspring during and after uteroplacental insufficiency. Hypoxia-associated regulative mechanisms may aggravate perinatal leptin deficiency. Because the degree of perinatal leptin reduction resembles the severity of leptin resistance in adult SOP and LIG offspring (16), our findings support the conclusion that decreased leptin availability during the perinatal developmental window may play an important role for metabolic programming of leptin resistance and adiposity in IUGR offspring.
Acknowledgments
This work was funded by the German Research Foundation (Deutsche Forschungsgemeinschaft) Grants NU-137/3-1 (to K.-D.N. and E.N.) and DO682/3-4 (to J.D., H.S., and K.-D.N.).
Disclosure Summary: The authors have nothing to disclose.
Abbreviations
- C
control
- E
gestational day
- Hif
hypoxia-inducible factor
- HRP
horseradish peroxidase
- IUGR
intrauterine growth restriction
- LIG
ligation
- P
postnatal day
- SOP
sham operation
- Timp
tissue inhibitor of metalloproteinase
- VEGF
vascular endothelial growth factor.
