


Abstract
Although disease and infection is associated with attenuated growth, the molecular pathways involved are poorly characterized. We postulated that the IGF axis, a central governor of vertebrate growth, is repressed during infection to promote resource reallocation towards immunity. This hypothesis was tested in rainbow trout (Oncorhynchus mykiss) challenged by Aeromonas salmonicida (AS), a Gram-negative bacterial pathogen, or viral hemorrhagic septicemia virus (VHSv) at hatch, first feeding, and 3 weeks after first feeding. Quantitative transcriptional profiling was performed for genes encoding both IGF hormones, 19 salmonid IGF binding proteins (IGFBPs) and a panel of marker genes for growth and immune status. There were major differences in the developmental response of the IGF axis to AS and VHSv, with the VHSv challenge causing strong down-regulation of many genes. Despite this, IGFBP-1A1 and IGFBP-6A2 subtypes, each negative regulators of IGF signaling, were highly induced by AS and VHSv in striking correlation with host defense genes regulated by cytokine pathways. Follow-up experiments demonstrated a highly significant coregulation of IGFBP-1A1 and IGFBP-6A2 with proinflammatory cytokine genes in primary immune tissues (spleen and head kidney) when trout were challenged by a different Gram-negative bacterium, Yersinia ruckeri. Based on our findings, we propose a model where certain IGFBP subtypes are directly regulated by cytokine signaling pathways, allowing immediate modulation of growth and/or immune system phenotypes according to the level of activation of immunity. Our findings provide new and comprehensive insights into cross talk between conserved pathways regulating teleost growth, development, and immunity.
Vertebrates typically have access to a finite set of energetic resources that must be effectively allocated to different physiological systems at different times of life to maximize survival and reproductive success. Immunological competence and growth are each important determinants of fitness that are both energetically costly and therefore expected to be traded-off (1–4). However, if, for example, an immune response requires reallocation of resources away from growth, this must be supported by appropriate mechanisms at the molecular level. In this respect, because growth and immunity are separately governed by signaling pathways initiated by conserved endocrine factors (ie, hormones and cytokines), cross talk may have evolved between such pathways, allowing resource allocation to be regulated according to immune and growth status.
As a central governor of vertebrate growth and metabolism, the IGF axis is a prime candidate to be targeted during energetic reallocation, for example to mount an effective immune response. The core vertebrate system comprises 2 circulating hormones (IGF-1 and IGF-2), their cell receptor (IGF-1 receptor [IGF-1R]) and a family of 6 high-affinity IGF binding proteins (IGFBPs) (IGFBP-1–IGFBP-6) (reviewed in Refs. 5, 6) that have been expanded in teleost fishes through a history of whole-genome duplication events (7–9). The binding of IGFs to IGF-1Rs on target cells leads to intracellular signal transduction via several canonical pathways (reviewed in Ref. 10), promoting cellular growth, survival, proliferation, and differentiation (5, 6). The extent of IGF signaling under distinct physiological contexts depends on the composition of functionally distinct IGFBP subtypes present, which largely restrict but can also promote the availability of IGFs to the IGF-1R (11, 12). Therefore, an increase in the levels of IGFBP subtypes that limit the availability of IGF to IGF-1R is expected to repress IGF signaling (eg, Ref. 9) and this represents a key hypothesized mechanism to promote energetic reallocation away from growth during an immune response.
Intriguingly, there already exists limited data linking the IGF axis, especially IGFBP genes, to classic vertebrate immune pathways (see reviews by Refs. 13, 14). Components of the IGF axis are expressed in cells of the immune system and are considered important for their development, differentiation or function (14). Furthermore, the IGFBP family member genes IGFBP-1 and IGFBP-6 were up-regulated in response to treatment by recombinant proinflammatory cytokines (including IL-1α, IL-1β, and TNF-α) in teleost and mammalian species (15, 16). Because these IGFBP family members are generally considered inhibitors of IGF signaling across vertebrate taxa (11, 17–21), such data point towards regulation of IGF signaling through pathways initiated by proinflammatory cytokines (13). However, there is currently a lack of evidence to support this notion, including any work documenting the in vivo regulation of IGFBP genes during responses to actual pathogens.
Therefore, the aim of this study was to test the hypothesis that IGF axis gene expression is regulated by bacterial and viral infection during ontogeny, consistent with a role in energetic reallocation. As our core experimental model, we exposed rainbow trout to bacterial and viral infections at early stages of development, where mature immunity is becoming established (22) in parallel to complex growth regulation (7). We documented the transcriptional regulation of the complete IGF-IGFBP system and embedded this data within a wider network of genes involved in host defense and muscle growth/development. As a secondary objective, we systematically investigated the diversification of IGFBP expression associated with 2 whole-genome duplication events in salmonid fish evolutionary history (23, 24), which expanded 6 core vertebrate IGFBP subtypes into 19 unique salmonid genes (9). Together our findings offer insights into a potentially important role for the IGF-IGFBP system in linking host defense to growth phenotypes, with implications for understanding resource allocation across different physiological systems.
Materials and Methods
Aeromonas salmonicida (AS) and viral hemorrhagic septicemia virus (VHSv) challenges during rainbow trout development
Animal experiments performed at Institut National de la Recherche Agronomique were done in accordance with good practice defined by European Union guidelines for the handling of laboratory animals and by the Regional Paris South Ethics committee. The work was approved by the Direction of the Veterinary Services of Versailles (authorization number 78–28). Rainbow trout from a previously described strain (25) were reared at the Experimental Fish Facility in Jouy-en-Josas, France. Fish were maintained at 10°C–12°C in a recirculating UV-treated freshwater system and sampled at: 1) hatching (H) (370° d); 2) first feeding (FF) (560° d); and 3) 3 weeks after FF (3wFF) (770° d), after first being injected with either 1 μL of AS (106 colony-forming units per mL−1), the causative agent of furunculosis, 1 μL of VHSv (108 plaque-forming units mL−1) or 1 μL of PBS (control). The animals used were sexually immature and sex was not recorded. Fry were killed by overexposure to 1% 2-phenoxyethanol 3 days after each treatment and stored in RNAlater (Life Technologies) at 4°C for 24 hours and then transferred to −80°C until RNA extraction.
RNA extraction and reverse transcription
Total RNA was extracted from whole fry (n = 5 per stage described above) using TRI Reagent (Sigma-Aldrich). Samples were homogenized using Tungsten Carbide Beads (3 mm; QIAGEN) and a TissueLyser II (QIAGEN), following the manufacturer's instructions, with the exception that 4 separate washes of each RNA pellet was performed with 70% ethanol. RNA concentration was quantified using a NanoDrop 1000 Spectrophotometer (Thermo Scientific). The integrity of RNA was assessed using an Agilent 2100 Bioanalyzer and RNA 6000 Nano kit (Agilent Technologies). First-strand cDNA was synthesized from total RNA (1 μg) using a QuantiTech Reverse Transcription kit (QIAGEN), with an integrated genomic DNA elimination step, as per the manufacturer's guidelines. First strand cDNA samples were diluted 100-fold (working stock) with nuclease-free grade water (Sigma-Aldrich) and stored at −80°C until use.
Primer design
Details about all primer pairs used for quantitative PCR (qPCR) (next section) are provided in Supplemental Table 1. Some of these primers have been verified previously and some were designed newly for this study. For 17 out of 19 characterized IGFBP family member genes, characterized primer pairs from Atlantic salmon (Salmo salar) were suitable for use in rainbow trout (9). However, in 2 cases, new primers were designed to correct for mismatches with primers designed for Atlantic salmon. In these cases, new primers were designed to bind divergent regions among salmonid-specific paralogue pairs (9). For genes used as markers to gauge muscle growth status or confirm immune responses, the aim was to design primers to regions conserved across putative identified salmonid-specific paralogues, ie, to recapture an overall response pattern, rather than distinguish paralogue differences. Design of new primers was facilitated using NetPrimer (PREMIER Biosoft). Primers were predicted to produce no self- or cross-dimers and to either span an exon-exon boundary or be positioned in different exons.
qPCR analyses
qPCR analyses were performed using an Mx3005P qPCR System (Agilent Technologies) with SYBR Green I dye chemistry. Each 15-μL reaction contained 5 μL of 1:100-diluted cDNA (corresponding to 2.5 ng of reverse-transcribed total RNA), 500nM sense/antisense primers and 7.5-μL Brilliant III Ultra-Fast SYBR Green (Agilent Technologies). The thermal cycling conditions were 1 cycle of 95°C for 3 minutes, followed by 40 cycles of 95°C for 20 seconds and 64°C for 20 seconds. A dissociation analysis (thermal gradient from 55°C to 95°C) was performed in all assays to confirm the amplification of a single product. Assays were performed in technical duplicate within 96-well plates such that all samples were included on each plate for each separate gene. Each plate also included no-template controls in duplicate (cDNA replaced with water).
The efficiency of each qPCR assay was determined using LinRegPCR following the author's recommendations (26). Baseline corrected cycle threshold values (threshold standardized across plates) were imported into GenEx (MultiD Analyses AB) and corrected for differences in efficiency. Within Genex, NormFinder (27) and geNorm (28) were used to analyze the stability and suitability of RpL4, RpS13, RpS29, ACTB, and EF1A as reference genes (Supplemental Table 1). geNorm identified RpL4 and EF1A as the most stable pair of reference genes across all samples (M value, 0.28). These same genes were also the most stably expressed genes overall according to NormFinder (combined SD of RpL4 and EF1A, 0.16). Using NormFinder to consider variation in expression due to treatment again suggested that RpL4 and EF1A were the optimal pair of reference genes (combined SD, 0.05). Hence, RpL4 and EF1A were used to normalize corrected cycle threshold values of each experimental gene, which were finally converted to a scale of expression that was relatively quantitative across different genes within an experiment.
Statistical analysis
Statistical modeling of qPCR data was performed in Minitab v. 17 (Minitab, Inc). One-way ANOVA was used to test the effect of developmental stage (with H, FF, and 3wFF as fixed factors) on gene transcript levels in control animals. Bonferroni correction was used as a conservative measure to avoid type-I errors associated with multiple comparisons of different genes. When a significant effect of developmental stage was identified after Bonferroni correction, Tukey's test was used to identify significant differences between groups employing a familywise error rate of 5%. Two-way ANOVA was used to establish the effect of bacterial and viral challenges at different stages of rainbow trout development, testing for an effect of treatment, developmental stage and a treatment*stage interaction. Bonferroni correction was again used to avoid type-I errors. Two-way ANOVA was also used to test for differences in transcript expression between salmonid-specific IGFBP paralogue pairs, testing for an effect of paralogue-pair, developmental stage and a paralogue-pair*stage interaction.
For all ANOVA tests, the assumptions of normality and homoscedasticity were evaluated on model residuals using the Anderson-Darling and Levene's tests, respectively. When data did not conform to these expectations, transformations were tested, including the Box-Cox, natural logarithm, square root, and double square root. Data that deviated strongly from normality and homoscedasticity after trialling multiple transformations were analyzed using a nonparametric Kruskal-Wallis test.
Multivariate analyses of qPCR data
We performed hierarchical clustering and seriation analyses using PermutMatrix (29) to organize qPCR expression data with respect to similarities in regulation across the tested genes. This was done using Euclidean distances as the index of dissimilarity for clustering and seriation, the Unweighted Pair Group Method with Arithmetic Mean approach for hierarchical clustering and a multiple-fragment heuristic as the seriation approach, employing Z-score normalization of data in rows (ie, the different genes). We also performed Spearman's correlation in Minitab v. 17 (Minitab, Inc) to establish the statistical relevance of coexpression among gene pairs of interest identified from the clustering and seriation analyses.
Follow-up experiments: tissue-context of immune-responsive IGFBP expression
In response to experimental findings (obtained using the methods described above), we quantified the expression of IGFBP-1A1 and IGFBP-6A2 along with the 5 aforementioned reference genes and 2 proinflammatory cytokine genes (as markers of the intended immune response) (after Ref. 22; see Supplemental Table 1) in an additional disease challenge model. The aim was to provide a tissue-specific context for the transcriptional up-regulation of IGFBP-1A1 and IGFBP-6A2 detected in whole trout fry in response to AS and VHSv (see Results). A challenge experiment was done with rainbow trout using the bacterial species, Yersinia ruckeri, the causative agent of enteric redmouth disease. This work was performed at the Institute of Environmental and Biological Sciences (University of Aberdeen) in accordance with United Kingdom legislation on scientific procedures on living animals. The protocol was approved by the ethics committee at University of Aberdeen and was carried out under United Kingdom home office project license number PPL 60/4013. A pathogenic strain of Y. ruckeri (MT3072) was prepared and injected ip to immature rainbow trout held in freshwater (body size ∼210 g, sex unrecorded) as described elsewhere (30). Size-matched animals were challenged either by a dose of 0.5-mL bacteria per fish (at 1 × 10⁶ colony-forming units/mL) or with 0.5 mL of PBS as a control. Preliminary tests of this dose led to disease symptoms 3 days after treatment. Therefore, 4 animals per group were sampled 2 days after treatment. Spleen and head kidney were collected, homogenized in TRI Reagent (Sigma-Aldrich) and stored at −80°C until RNA extraction and cDNA synthesis (performed using standard protocols described elsewhere; 30). The cDNA samples were analyzed using approaches described in the above methods section on qPCR analyses, ie, in terms of qPCR, reference gene normalization, the calculation/correction of efficiency and relative scaling of expression data. One-way ANOVA was performed with the resultant expression data for IGFBP-1A1 and IGFBP-6A2 and host immune genes, testing for an effect of Y. ruckeri treatment (treatment and controls: fixed factors), as described in the above methods section on statistical analysis.
Results
Developmental regulation of the IGF axis
We first quantified the transcript expression of IGF axis genes in rainbow trout at 3 early stages of development (using control animals) (Figure 1, A–G, and Table 1). To gain contextual data on the status of striated muscle development, we measured the expression of muscle-growth markers, including genes for protein turnover (FBXO32, an E3-ubiquitin ligase) (31), protein synthesis (the sarcomeric proteins TNNI2 and MYL1) and myogenic differentiation (MYOG and MyoD1a) (Figure 1, H and I, and Table 1) (32, 33).
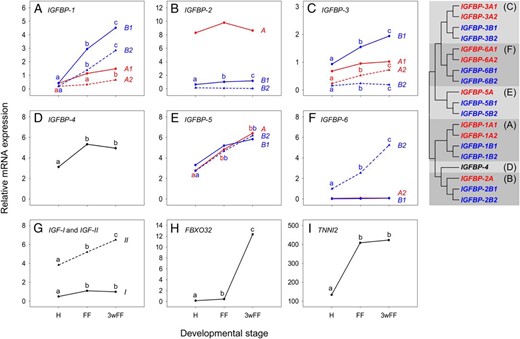
Expression of the complete IGF-IGFBP system in the control rainbow trout at the 3 developmental stages. A–F. Data for all characterized salmonid-specific IGFBP paralogues; each vertebrate IGFBP subtype has its own panel. A tree of IGFBP relationships is provided (adapted from Ref. 9) with different vertebrate IGFBP family members highlighted by different shading patterns and any teleost-specific paralogue pairs present being highlighted by different color font. Equivalent data are shown for genes coding the IGF-I and IGF-II hormones (G), the E3-ubiquitin ligase FBXO32 (H) and the fast muscle-specific structural protein TNNI2 (I). Different letters indicate significant differences between the 3 stages of development (n = 5) for each gene (letters are not valid for comparisons among different genes within the same panel). Accompanying details on statistics, including for other genes, is presented in Table 1.
One-Way ANOVA Testing the Effect of Developmental Stage on Expression of the IGF-IGFBP System and Muscle Growth Genes in Rainbow Trout
| Gene | F Value | P Value | H Transcript Level (SD) | FF Transcript Level (SD) | 3wFF Transcript Level (SD) |
|---|---|---|---|---|---|
| FBXO32d | 245.81 | <.0001 | 0.15 (0.02)a | 0.44 (0.18)b | 12.35 (3.95)c |
| IGFBP-1B2d | 99.03 | <.0001 | 0.20 (0.09)a | 1.38 (0.33)b | 2.84 (0.64)c |
| IGFBP-6B2 | 96.09 | <.0001 | 0.99 (0.31)a | 2.54 (0.52)b | 5.25 (0.60)c |
| IGFBP-5Ad | 63.99 | <.0001 | 2.77 (0.21)a | 4.83 (0.280b | 6.40 (1.14)c |
| IGFBP-5B2d | 44.51 | <.0001 | 2.73 (0.54)a | 4.67 (0.10)b | 6.17 (0.93)c |
| IGF-I | 36.93 | <.0001 | 0.50 (0.08)a | 1.10 (0.07)b | 1.00 (0.18)b |
| IGFBP-1A2 | 32.66 | <.0001 | 0.18 (0.05)a | 0.31 (0.13)a | 0.66 (0.09)b |
| TNNI2 | 30.04 | <.0001 | 133.91 (20.50)a | 408.90 (80.41)b | 423.29 (79.95)b |
| IGFBP-1B1 | 24.53 | <.0001 | 0.42 (0.40)a | 2.94 (1.20)b | 4.52 (1.01)c |
| IGFBP-4 | 17.05 | <.0001 | 3.12 (0.39)a | 5.33 (0.62)b | 4.95 (0.83)b |
| IGFBP-3A2 | 16.38 | <.0001 | 0.23 (0.10)a | 0.52 (0.03)b | 0.72 (0.21)b |
| IGF-II | 16.13 | <.0001 | 3.83 (0.43)a | 5.20 (0.32)b | 6.50 (1.17)c |
| IGFBP-3B1 | 13.43 | .001 | 0.93 (0.33)a | 1.55 (0.19)b | 1.94 (0.38)b |
| IGFBP-3B2 | 11.85 | .001 | 0.15 (0.02)a | 0.24 (0.03)b | 0.19 (0.03)a |
| IGFBP-2B1 | 11.22 | .002 | 0.63 (0.11)a | 1.03 (0.13)b | 1.17 (0.27)b |
| MYOGd | 11.48 | .002 | 4.17 (0.64)a | 2.56 (0.44)b | 4.36 (0.99)a |
| MYL1 | 8.37 | .01f | 257.29 (34.76) | 362.44 (57.78) | 367.9 (49.16) |
| IGFBP-3A1 | 4.97 | .03f | 0.68 (0.06) | 0.95 (0.09) | 1.02 (0.30) |
| IGFBP-2B2 | 4.09 | .04f | 0.15 (0.05) | 0.09 (0.08) | 0.05 (0.01) |
| IGFBP-5B1 | N/A | .01f | 3.30 (1.01) | 5.20 (0.29) | 5.82 (1.40) |
| IGFBP-2A | 3.38 | .07 | 8.29 (0.97) | 9.79 (1.26) | 8.63 (0.46) |
| IGFBP-6B1e | 3.37 | .07 | 0.02 (0.00) | 0.04 (0.02) | 0.08 (0.05) |
| IGFBP-1A1 | 3.19 | .08 | 0.40 (0.31) | 1.14 (0.76) | 1.48 (0.86) |
| IGFBP-6A2 | 1.28 | .31 | 0.06 (0.03) | 0.09 (0.02) | 0.09 (0.040) |
| MyoD1a | 0.17 | .85 | 3.54 (0.43) | 3.28 (0.88) | 3.33 (0.89) |
| IGFBP-6A1 | ND | ND | ND | ND | ND |
ND, no expression detected; N/A, no F value, as statistics done with Kruskal-Wallis test.
Significant differences in transcript levels between the 3 stages of development.
Data transformed by natural logarithm.
Data transformed by square root.
Nonsignificant differences after Bonferroni correction.
Transcripts for 18 out of 19 rainbow trout IGFBP genes were detected (Figure 1, A–F, and Table 1). Considering the gene family as a whole, a dynamic pattern of expression was observed, both in terms of developmental regulation and differences in transcript levels (Figure 1, A–F). Ten of the IGFBP genes increased significantly in transcript level during development, although the magnitude and profile of the changes observed was variable (Table 1). Most strikingly, IGFBP-1B1 and IGFBP-6B2 increased in expression by approximately 10-fold and approximately 5-fold, respectively, between the H and 3wFF stage (Figure 1, A and F, and Table 1). IGFBP-2A was expressed constitutively at all stages and at a higher level than the other IGFBPs (Figure 1B and Table 1).
Transcript levels for IGF-I and IGF-II increased significantly by approximately 2-fold between H and 3wFF (Figure 1G and Table 1). IGF-II transcripts were present at much higher levels than IGF-I for all stages profiled (Figure 1G and Table 1). The expression of FBXO32 increased by approximately 3-fold between H and FF, before increasing dramatically by approximately 30-fold by 3wFF (Figure 1H and Table 1). TNNI2 mRNA expression increased significantly by approximately 3-fold between H and FF stages and then remained unchanged between FF and 3wFF (Figure 1I and Table 1). The selected markers for myogenic differentiation were comparatively stable across development (Table 1).
Divergent regulation of salmonid-specific IGFBP paralogues during development
Using an ANOVA framework, we tested for statistically relevant differences in gene expression among IGFBP gene paralogue pairs derived from a whole-genome duplication event in the common salmonid ancestor approximately 95 Ma (23, 24) (Supplemental Table 2). For IGFBP-1A1 vs IGFBP-1A2, IGFBP-1B1 vs IGFBP-1B2, IGFBP-3A1 vs IGFBP-3A2, and IGFBP-3B1 vs IGFBP-3B2, our data suggested a highly significant overall difference in the magnitude of expression of salmonid-specific paralogue pairs, without differences in the responses of individual paralogues across developmental stages (Supplemental Table 2; significant effect of paralogue pair and nonsignificant paralogue*stage interaction). Alternatively, for IGFBP-2B1 vs IGFBP-2B2 and IGFBP-6B1 vs IGFBP-6B2, our data suggested a highly significant overall difference in expression of salmonid-specific paralogue pairs along with significant differences in the responses of individual paralogues across developmental stages (Supplemental Table 2; significant effect of paralogue pair and a significant paralogue*stage interaction). Finally, among all tested genes, only the developmental expression of IGFBP-5B paralogues was not significantly different (Supplemental Table 2).
Validation of host immune responses
Using the samples employed within this study, we recently verified the intended host defense responses to AS and VHSv infection across the different trout developmental stages (22). Briefly, large increases in pathogen load were confirmed by qPCR for AS and VHSv at each stage, coupled to a strong and highly significant transcriptional induction of host defense genes, specifically TNF-α, IL-1β, IL-8, SAA, and HAMP for AS and IFN-a, γ-IP, Mx, LMP2, and RSAD2 for VHSv (22).
Regulation of the IGF axis during AS challenge
We characterized the transcriptional response of IGF axis genes to AS at the 3 developmental stages. We used an ANOVA framework to identify genes, including the markers of muscle growth, where expression was significantly altered by AS or where there was a treatment*stage interaction (Table 2). There was a significant effect of AS on IGFBP-1A1, IGFBP-6A2, IGFBP-6B1, and MYL1 expression, and for IGFBP-6A2 a significant treatment* stage interaction (Table 2). Expression data for these AS-responsive genes is shown in Figure 2, A–D. An induction of IGFBP-1A1, IGFBP-6A2, and IGFBP-6B1 in response to AS was evident at all stages, with the largest effect at H (Figure 2, A–C). Interestingly, in control animals, IGFBP-6A2 was among the least transcriptionally abundant of all the IGFBP family members (Table 1), whereas AS treatment led to it becoming one of the most highly expressed (Table 2). In contrast, salmonid-specific paralogues of IGFBP-1A1 (IGFBP-1A2), IGFBP-6A2 (IGFBP-6A1), and IGFBP-6B1 (IGFBP-6B2) were unaffected by AS (Table 2).
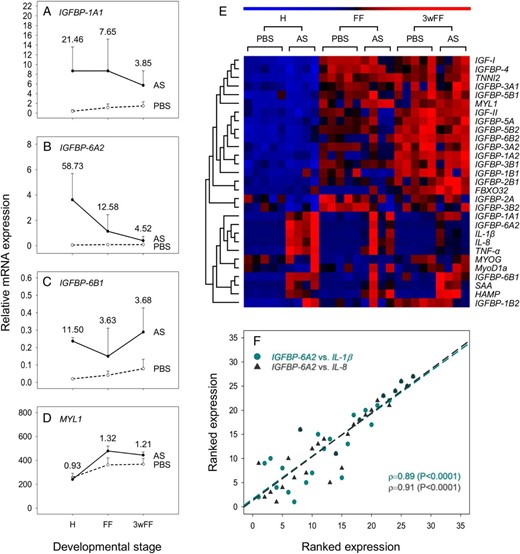
Effect of AS infection on the expression of genes from the IGF-IGFBP system at 3 stages of rainbow trout development, contextualized by data for genes involved in muscle growth and host defense. A–D, Genes that were significantly regulated in response to AS: IGFBP-1A1 (A), IGFBP-6A2 (B), IGFBP-6B1 (C), and MYL1 (D). For all these graphs, mean transcript levels + SD are provided on a scale allowing comparison across genes (n = 4 for treatments, n = 5 for PBS controls). Numbers provided next to data points are fold change differences (treatment/control). Accompanying details on statistics including other genes is presented in Table 2. E, Heatmap depicting results of seriation and hierarchical clustering analysis on all tested genes. F, Scatterplot of ranked expression data showing the striking coregulation of IGFBP-6A2 expression with proinflammatory host defense genes in control and AS-infected fish.
Two-Way ANOVA Testing the Effect of AS Challenge on Expression of the IGF-IGFBP System and Muscle Growth Genes in Rainbow Trout at Different Developmental Stages
| Gene | P Value Treatment | P Value Treatment* Stage | H Transcript Level (SD) | Fold Change | FF Transcript Level (SD) | Fold Change | 3wFF Transcript Level (SD) | Fold Change |
|---|---|---|---|---|---|---|---|---|
| IGFBP-6A2a | <.0001 | .001 | 3.63 (2.06) | 58.73 | 1.14 (1.30) | 12.58 | 0.41 (0.33) | 4.52 |
| IGFBP-1A1a | <.0001 | .03c | 8.70 (4.9) | 21.46 | 8.68 (6.54) | 7.65 | 5.71 (3.00) | 3.85 |
| IGFBP-6B1b | <.0001 | .35 | 0.24 (0.02) | 11.50 | 0.15 (0.16) | 3.63 | 0.29 (0.14) | 3.68 |
| MYL1 | .002 | .01c | 239.97 (19.70) | 0.93 | 478.25 (41.33) | 1.32 | 443.90 (26.49) | 1.21 |
| IGFBP-3B2 | .01c | .32 | 0.10 (0.05) | 0.16 (0.07) | 0.18 (0.06) | |||
| IGFBP-2A | .02c | .23 | 6.90 (0.67) | 8.44 (1.12) | 8.66 (1.02) | |||
| IGFBP-3A2 | .02c | .53 | 0.17 (0.03) | 0.40 (0.05) | 0.52 (0.18) | |||
| IGFBP-1B1 | .03c | .02c | 1.22 (1.31) | 0.38 (0.32) | 3.27 (1.94) | |||
| IGF-II | .03c | .57 | 3.35 (0.65) | 4.15 (0.96) | 6.12 (0.27) | |||
| FBXO32 | .03c | N/A | 4.14 (4.55) | 5.04 (5.90) | 25.26 (10.50) | |||
| IGFBP-2B2 | .05 | .19 | 0.06 (0.04) | 0.06 (0.03) | 0.05 (0.03) | |||
| IGFBP-3A1a | .17 | .05 | 0.46 (0.11) | 0.89 (0.07) | 1.15 (0.40) | |||
| MyoD1a | .22 | .99 | 4.40 (4.30) | 4.21 (2.08) | 4.45 (1.60) | |||
| IGF-I | .23 | .65 | 0.43 (0.08) | 0.95 (0.22) | 0.99 (0.23) | |||
| IGFBP-1A2 | .24 | .84 | 0.20 (0.10) | 0.36 (0.04) | 0.74 (0.19) | |||
| IGFBP-4 | .34 | .43 | 2.28 (1.02) | 5.46 (0.92) | 4.77 (0.88) | |||
| TNNI2 | .50 | .83 | 94.92 (28.60) | 409.83 (56.77) | 406.54 (107.26) | |||
| IGFBP-2B1a | .53 | .02c | 0.54 (0.19) | 0.92 (0.19) | 2.02 (0.65) | |||
| IGFBP-3B1 | .54 | .44 | 0.63 (0.27) | 1.59 (0.10) | 1.97 (0.50) | |||
| IGFBP-1B2 | .59 | N/A | 2.56 (2.53) | 1.41 (1.73) | 2.10 (1.05) | |||
| MYOGb | .69 | .47 | 6.22 (4.40) | 2.82 (0.26) | 3.82 (1.02) | |||
| IGFBP-5B2a | .78 | .13 | 3.25 (0.77) | 4.36 (0.69) | 5.36 (1.01) | |||
| IGFBP-5Aa | .85 | .52 | 3.12 (0.66) | 4.54 (1.52) | 6.73 (1.74) | |||
| IGFBP-6B2 | .88 | N/A | 1.57 (0.87) | 3.07 (1.27) | 4.71 (0.47) | |||
| IGFBP-5B1 | .96 | N/A | 3.29 (0.55) | 5.80 (2.02) | 5.93 (0.96) | |||
| IGFBP-6A1 | ND | ND | ND | ND | ND |
Transcript levels shown are for infected animals. N/A, no treatment*stage interaction tested, as statistics done with Kruskal-Wallis test on treatment effect only; ND, no expression detected; fold change, mean transcript level at AS challenge/control.
Data transformed by natural logarithm.
Data transformed by Box-Cox.
Nonsignificant differences after Bonferroni correction.
To understand the networks regulating IGFBP family regulation during host responses to AS, we used seriation and hierarchical clustering to organize the expression data for all IGFBP genes, along with equivalent data for IGF hormones, muscle marker genes and immune markers of the proinflammatory/acute-phase response (Figure 2E). The analysis revealed 2 major gene clusters, the first recapturing a progressive increase in expression across developmental stages, along with a general lack of response to AS challenge (Figure 2E). All the muscle marker genes were included in this cluster, along with 13 out of the 18 expressed IGFBPs and both IGF hormones. The second major cluster included the host defense genes (22), along with the 3 IGFBP genes (IGFBP-1A1, IGFBP-6A2, and IGFBP-6B1) increased by AS according to the ANOVA (Figure 2, A–C). Across the whole AS treatment model, IGFBP-1A1, IGFBP-6A2, and IGFBP-6B1 were correlated with TNF-α, IL-1β, IL-8, SAA, and HAMP with Spearman's ρ values ranging between 0.70 and 0.90 (all P < .0001). An example plot is shown to visually demonstrate the striking correlation in mRNA levels of IGFBP-6A2 and 2 of the proinflammatory cytokines (Figure 2F).
Our clustering approach also highlighted the general lack of conservation in transcriptional regulation among several salmonid-specific IGFBP paralogues (Figure 2E).
Regulation of the IGF axis during VHSv challenge
Two-way ANOVA revealed a systematic impact of VHSv on the expression of most tested genes, including significant treatment effects for 15 out of 18 expressed IGFBPs, both the IGF hormones and several muscle marker genes (Table 3). For almost all these genes, VHSv led to a down-regulation in expression (Table 3; examples shown in Figure 3, A and B). Further, a strong treatment* stage interaction was evident for many of these down-regulated genes, evidently due to differences in the magnitude of expression at different developmental stages (Table 3; eg, IGF-II and IGFBP1-A2) (Figure 3, A and B). The single IGFBP gene that was significantly induced by VHSv was IGFBP-6A2, which was also significantly induced by AS (Table 2); here, a significant treatment*stage interaction was also observed (Table 3 and Figure 3C). The level of IGFBP-6A2 induction by VHSv was large, particularly at the FF stage (Figure 3C). IGFBP-1A1 (which was significantly induced by AS) (Table 2) was also induced by VHSv at FF and 3wFF, but the effect was not significant (Figure 3D). The expression of FBXO32 was significantly induced by VHSv (Table 3).
Two-Way ANOVA Testing the Effect of VHSv Challenge on Expression of the IGF-IGFBP System and Muscle Growth Genes in Rainbow Trout at Different Developmental Stages
| Gene | P Value Treatment | P Value Treatment* Stage | H Transcript Level (SD) | Fold Change | FF Transcript Level (SD) | Fold Change | 3wFF Transcript Level (SD) | Fold Change |
|---|---|---|---|---|---|---|---|---|
| IGF-II | <.0001 | <.0001 | 1.56 (0.59) | 0.41 | 1.35 (0.45) | 0.26 | 1.46 (0.52) | 0.23 |
| IGFBP-1A2 | <.0001 | <.0001 | 0.13 (0.03) | 0.75 | 0.21 (0.05) | 0.66 | 0.15 (0.06) | 0.23 |
| IGFBP-1B2a | <.0001 | <.0001 | 0.04 (0.02) | 0.18 | 0.05 (0.03) | 0.04 | 0.09 (0.11) | 0.03 |
| IGFBP-2B2b | <.0001 | <.0001 | 0.04 (0.02) | 0.26 | 1.63E-03 (0.00) | 0.02 | 0.04 (0.02) | 0.82 |
| IGFBP-3B1 | <.0001 | <.0001 | 0.92 (0.29) | 0.98 | 0.91 (0.33) | 0.59 | 0.58 (0.16) | 0.30 |
| IGFBP-1B1a | <.0001 | <.0001 | 0.06 (0.05) | 0.14 | 0.05 (0.05) | 0.02 | 0.09 (0.08) | 0.02 |
| IGFBP-6B2 | <.0001 | <.0001 | 0.48 (0.09) | 0.48 | 0.98 (0.13) | 0.39 | 1.91 (0.61) | 0.36 |
| IGFBP-3B2b | <.0001 | .002 | 0.11 (0.03) | 0.68 | 0.14 (0.02) | 0.61 | 0.06 (0.02) | 0.33 |
| IGFBP-6A2c | <.0001 | .002 | 0.85 (0.70) | 13.76 | 5.86 (2.81) | 64.36 | 0.74 (0.83) | 8.25 |
| MyoD1a | <.0001 | .03d | 1.63 (0.91) | 0.46 | 0.79 (0.30) | 0.24 | 3.01 (1.02) | 0.90 |
| IGFBP-2B1 | <.0001 | .04d | 0.46 (0.06) | 0.72 | 0.36 (0.15) | 0.35 | 0.64 (0.30) | 0.55 |
| IGF-I | <.0001 | .04d | 0.37 (0.11) | 0.74 | 0.65 (0.11) | 0.59 | 0.69 (0.16) | 0.69 |
| IGFBP-4 | <.0001 | .10 | 2.17 (0.51) | 0.70 | 3.38 (0.82) | 0.63 | 2.79 (0.60) | 0.56 |
| IGFBP-3A1 | <.0001 | .13 | 0.48 (0.14) | 0.70 | 0.70 (0.11) | 0.74 | 0.54 (0.05) | 0.53 |
| IGFBP-5Ab | <.0001 | .23 | 2.01 (0.32) | 0.73 | 2.81 (0.37) | 0.58 | 3.77 (0.71) | 0.59 |
| MYOG | <.0001 | .58 | 3.01 (1.29) | 0.72 | 1.08 (0.31) | 0.42 | 2.40 (0.88) | 0.55 |
| IGFBP-2A | <.0001 | .75 | 6.36 (1.02) | 0.77 | 8.21 (1.48) | 0.84 | 6.27 (1.23) | 0.73 |
| IGFBP-3A2b | <.0001 | .75 | 0.09 (0.04) | 0.38 | 0.25 (0.02) | 0.49 | 0.34 (0.09) | 0.47 |
| FBXO32b | .001 | .10 | 0.17 (0.04) | 1.16 | 1.08 (0.30) | 2.48 | 25.39 (13.35) | 2.06 |
| IGFBP-5B1b | .004d | .10 | 2.09 (0.45) | 4.11 (0.73) | 5.47 (0.51) | |||
| IGFBP-5B2 | .01d | .20 | 2.38 (0.74) | 4.06 (0.60) | 4.66 (0.99) | |||
| IGFBP-1A1b | .04d | .54 | 0.66 (0.55) | 3.11 (0.72) | 3.22 (2.51) | |||
| MYL1 | .17 | .01d | 241.13 (37.48) | 474.44 (15.23) | 348.03 (59.98) | |||
| TNNI2b | .25 | .72 | 139.76 (26.72) | 507.56 (38.03) | 498.94 (283.79) | |||
| IGFBP-6B1a | .65 | .57 | 0.02 (0.02) | 0.04 (0.02) | 0.10 (0.04) | |||
| IGFBP-6A1 | ND | ND | ND | ND | ND |
Transcript levels shown are for infected animals. ND, no expression detected; fold change, mean transcript level at VHSv challenge/control.
Data transformed by square root.
Data transformed by natural logarithm.
Data transformed by double square root.
Nonsignificant differences after Bonferroni correction.
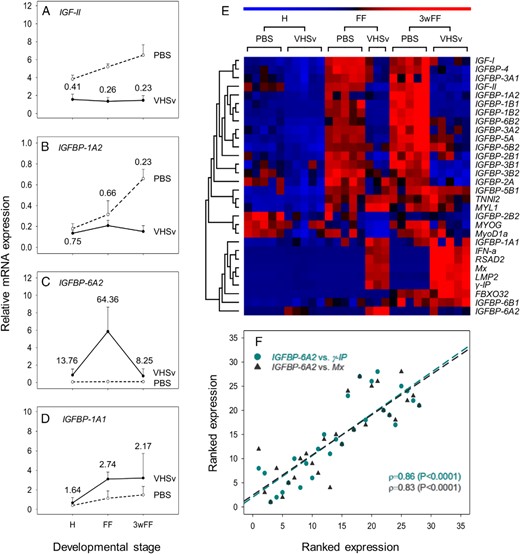
Effect of VHSv infection on the expression of genes from the IGF-IGFBP system at 3 stages of rainbow trout development, contextualized by data for genes involved in muscle growth and host defense. A–D, Examples of genes significantly regulated in response to VHSv, including those down-regulated: IGF-II (A) and IGFBP-1A2 (B) and up-regulated: IGFBP-6A2 (C) and IGFBP-1A1 (D) (not significant, see text). For all these graphs, mean transcript levels + SD are provided on a scale allowing comparison across genes (n = 3–5 for treatments, n = 5 for PBS controls). Numbers provided next to data points are the fold change differences (treatment/control). Accompanying details on statistics including other genes is presented in Table 3. E, Heatmap depicting results of seriation and hierarchical clustering analysis on all tested genes. F, Scatterplot of ranked expression data showing the striking coregulation of IGFBP-6A2 expression with antiviral host defense genes in control and VHSv-infected fish.
Seriation and hierarchical clustering of the VHSv data revealed 2 major gene clusters (Figure 3E). The first included genes identified by the ANOVA (Table 3) as being highly down-regulated in response to VHSv. However, the heatmap emphasized an increase in magnitude of this down-regulation between H and FF/3wFF, revealing a small group of genes (including IGFBP-2B2 and the myogenic differentiation markers) that were already down-regulated at H (Figure 3E); however, no significant effects of treatment were observed for these genes (Table 3). The systematic down-regulation in expression of many IGF-IGFBP genes was coupled to an increasing magnitude of the type I interferon defense response (22), as recaptured by a second cluster of genes including all the immune marker genes (Figure 3E). This second cluster included IGFBP-1A1 and IGFBP-6A2 (Figure 3E). As for the AS treatment, there was a striking correlation between the antiviral genes and IGFBP genes induced by VHSv. For example, IGFBP-6A2 showed Spearman's ρ values of 0.70–0.86 with γ-IP, Mx, RSAD2, and IFN-a (all P < .0001) (Figure 3F).
The clustering approach with the VHSv model again highlighted a lack of tight regulation between several salmonid-specific IGFBP paralogues (Figure 3E).
Tissue context for immune-responsive IGFBP induction
In the above analyses, whole rainbow trout fry were used, limiting conclusions on the source of immune-responsive IGFBP expression. Therefore, we established the expression of IGFBP-1A1 and IGFBP-6A2 in parallel to immune marker genes for the proinflammatory cytokine response (22) in an additional disease challenge model where 2 distinct immune tissues were sampled (Figure 4). Infection of rainbow trout with the bacterium Y. ruckeri led to a large and significant up-regulation of both IGFBP genes in spleen and head kidney, along with IL-1β and IL-8 (Figure 4, A and B, and Supplemental Table 3). Remarkably, the observed approximately 200-fold up-regulation of IGFBP-6A2 in both tissues was actually larger than that observed for the tested proinflammatory cytokines (Figure 4, A and B). Similar to the situation in whole trout fry infected with AS or VHSv, control spleen and head kidney samples had extremely low levels of IGFBP-6A2 (Supplemental Table 3). Conversely, IGFBP-1A1 was still expressed at notable levels in the control spleen and head kidney samples (Supplemental Table 3).
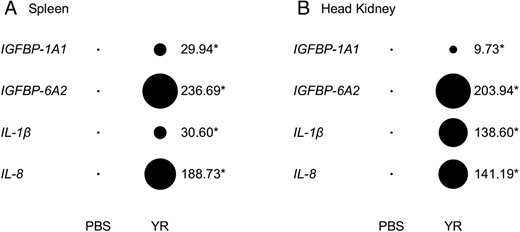
Evidence for immune-responsive induction of IGFBP-1A1 and IGFBP-6A2 along with selected host-defense genes in spleen (A) and head kidney (B) after infection with the bacterium Y. ruckeri. Transcript expression levels were derived from qPCR and are presented in the style of a Northern-dot blot, scaled to be relative across genes. The area of the bubbles is proportional to the mean mRNA abundance (n = 4 for all bubbles). Fold change (treatment/control) values are provided next to bubbles, along with asterisks denoting a significant effect of treatment (see full details in Supplemental Table 3).
Discussion
Because immune responses and growth are each energetically costly, physiological mechanisms are likely to have evolved that facilitate appropriate allocation of resources into each system at different stages of ontogeny and under distinct environmental challenges. In order to achieve such regulation, we envisaged the existence of cross talk between endocrine pathways that are separately essential for growth and immunity. We therefore tested and gained support for the hypothesis that genes from the IGF axis, essential to vertebrate growth, are modulated during infection, potentially attenuating IGF signaling and freeing up resources for an effective immune response.
Cross talk between the IGF axis and conserved immune pathways
Using rainbow trout as a model, we gained evidence for potential mechanisms modulating IGF signaling during infection that depended on the nature of the pathogen and developmental stage. For both AS and VHSv, we observed a consistent respective up-regulation of IGFBP-1A1 and IGFBP-6A2, or just IGFBP-6A2, in striking correlation with host defense marker genes. Even though the direction of this response was consistent, its magnitude varied dramatically with stage and pathogen. In response to AS, the strongest responses of both IGFBP-1A1 and IGFBP-6A2 occurred at H, when a complex immune response was present according to a recent transcriptome-wide analysis (22), before decreasing in magnitude at later stages. Conversely, in response to VHSv, the induction of IGFBP-6A2 was by far the highest at FF, corresponding with the onset of a type I interferon (IFN-a) response in the same samples, but also to high expression of IL-1β (22). In this sense, it is notable that IGFBP-6A2 was still induced at H, where there was little evidence for a mature IFN response (22). This may provide clues as to the type of pathways governing the expression of these IGFBPs during infection. In this respect, the marker genes selected to confirm host responses to AS and VHSv (22), which were coregulated with IGFBP-1A1 and/or IGFBP-6A2 expression, are controlled by signaling pathways initiated by distinct cytokines. Although the up-regulation of proinflammatory cytokines and acute phase proteins during AS infection likely occurs primarily through receptors for interleukins and TNF (34, 35), up-regulation of IGF-α, γ-IP, and Mx genes during VHSv infection is a hallmark of signaling through the type I IFN receptor (36, 37).
To further probe our discovery of immune-responsive IGFBP expression, we demonstrated that IGFBP-1A1 and IGFBP-6A2 were strongly and significantly induced in the spleen and head kidney of adult trout challenged by a different bacterium. Thus, the transcriptional induction of these IGFBP genes during disease challenge may arise directly from immune cells, which are highly enriched in both these tissues, or potentially from other resident cell types being stimulated by the actions of immune cells. However, in terms of downstream functions, it is currently unclear whether the induction of each IGFBP subtype serves a paracrine or autocrine role within these immune tissues, or leads to an increase of IGFBP levels within the circulation, perhaps serving to modify IGF availability to the IGF-1R. In this respect, both suggestions are plausible and perhaps nonexclusive, as past work has shown that IGFBP-6, via an undetermined mechanism, is crucial for B cell development in humans (38), whereas IGFBP-1A subtypes are abundant in salmonid circulation (39) where they bind IGFs and inhibit IGF signaling (eg, Ref. 40). It is also important to remember that the induction of IGFBP-6A2 within immune tissues, as well as that detected within whole trout fry, was from a baseline state of zero or extremely low expression. This suggests an “all or nothing” response that would be unfavorable in animals that are not being challenged by infection.
Overall, the highly immune-responsive pattern of IGFBP-1A1 and IGFBP-6A2 expressioņ along with their remarkable coregulation with immune molecules can be parsimoniously explained by the presence of regulatory elements (eg, within these genes promoter sequences) directly controlled by cytokine signaling pathways (Figure 5), potentially of several classes. Under this model, the up-regulation of IGFBP-6A2 in response to VHSv before the mature IFN-response (at H) and later increase in the magnitude of IGFBP-6A2 expression (at FF) after the IFN-response has been established, indicates control by multiple cytokine pathways. Whatever the precise mechanism, IGFBP-1A1 and IGFBP-6A2 up-regulation might be viewed as an inherent component of the immune response. A model of cytokine-induced down-regulation of IGF signaling by up-regulation of IGFBPs is supported by past studies where IGFBP-6 was up-regulated by recombinant IL-1β in primary muscle culture from a related salmonid species (16). Past work in rodents has similarly revealed that IL-1β, TNF-α, and IL-6 (15, 41–43), along with LPS (41), strongly induce the expression of IGFBP-1 mRNA and protein. This may point towards a wider applicability for our model across taxa, in terms of IGFBP-1, although as far as we are aware the strong induction of IGFBP-6 during disease challenge has only been reported in teleosts, potentially reflecting the different regulation of energy metabolism between ectothermic fish and endothermic mammals, or differences in the regulation of the immune system by the IGF axis. In this sense, it is notable that IGFBP-6 binds more strongly to IGF-2 than IGF-1, as least in mammals (44). In our study, IGF-II was always more abundant than IGF-I at the transcript level, both in control animals (Figure 1G) and even after its significant down-regulation during VHSv treatment (Table 3). Therefore, assuming that IGFBP-6A2 binds efficiently to IGF-2 in trout, the strong IGFBP-6A2 induction would be expected to have marked physiological effects on signaling regulated by IGF-2 in particular. Another possibility that cannot be ruled out is that the up-regulation of IGFBP-6A2 is for a function unrelated to IGF-binding. For example, it is known that mammalian IGFBP-6 has roles in the nucleus, where it inhibits growth by regulating cell survival and apoptosis via interactions with proteins involved in DNA repair (45). For a recent review on IGF-independent functions of IGFBP-6, see Ref. 46
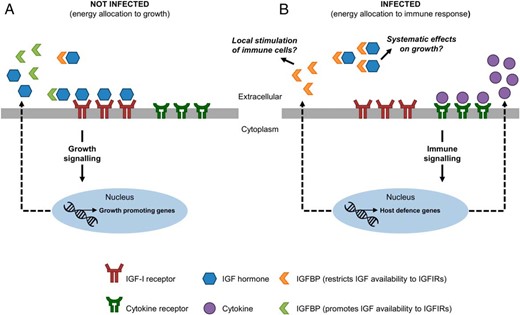
General model for cross talk between endocrine pathways regulating growth and immunity via transcriptional regulation of specific IGFBP subtypes. A, In uninfected fish that are actively growing and not nutritionally restricted, IGF is available to IGF-1Rs present on target cell membranes, potentially facilitated by the presence of IGFBP subtypes that potentiate IGF signaling. B, Upon infection, increased production of cytokines drives the transcriptional up-regulation of host defense genes, including IGFBP-6A2 and IGFBP-1A1, through various possible signaling pathways, which may act to either suppress IGF-dependent growth signaling pathways and/or promote the development of immune cells.
Differences in expression responses to viral and bacterial infection
In contrast to IGFBP1-A1 and IGFBP-6A2, AS infection did not significantly alter the expression of other components of the IGF axis. Conversely, VHSv challenge led to a systematic down-regulation of many other IGFBPs, along with both the IGF hormones and 2 master transcription factors involved in muscle development and differentiation. In terms of the IGFBP genes down-regulated by VHSv, this included members of the IGFBP-1, IGFBP-2, IGFBP-3, IGFBP-4, and IGFBP-6 subtypes, which are functionally diverse and together can act to both inhibit and stimulate IGF signaling (9, 11, 12, 47). Thus, considering the functional diversity of genes affected, it is difficult to interpret the implications of this finding beyond a major remodeling of growth. However, one plausible hypothesis for an underlying mechanism is a nontargeted down-regulation of cellular transcripts, given that host-cell mRNA transcription has previously been reported to be generally inactivated during infection by the same family of viruses as VHSv (48). It is also notable that VHSv, but not AS, induced a significant up-regulation of FBXO32, which is involved in muscle breakdown and turnover (7, 31), suggesting potential differences in scope for energetic reallocation from muscle stores under bacterial or viral infection.
Developmental regulation of the IGF axis
Our results also provide insights into the regulation of the IGF axis during early salmonid development, including comprehensive data on the complete family of 19 IGFBP genes. Our data suggests a progressive increase in the complexity of growth regulation, with many tested genes being up-regulated from H to FF, including both IGF hormones and diverse IGFBP subtype genes likely to both facilitate and inhibit IGF-dependent growth (Table 1). This period coincides with the absorption of the yolk-sac, which in Atlantic salmon is preceded by a major increase in the complexity of digestive organs in preparation for acquisition of external food resources (49). To provide a specific tissue context to our data, we included several muscle-growth markers in our analysis, including 2 structural proteins, both of which increased markedly from H to FF, coinciding with a shift in the expression of genes coding muscle sarcomeric proteins (50). Interestingly, a further strong induction of FBXO32 occurred from FF to 3wFF; this gene codes a muscle-specific protein that governs striated remodeling in vertebrates, acting to target sarcomeric proteins for degradation by the ubiquitination pathway (7, 51). Its increased expression presumably recaptures an increased need to turnover muscle proteins, potentially for routine energetic reallocation to other systems.
Divergence in IGFBP paralogue expression during salmonid evolution
Our analyses also revealed both highly divergent and conserved regulation of several salmonid-specific IGFBP paralogues, either during development and/or infection, pointing towards respective evolutionary divergence and conservation in transcriptional regulation since their origin by whole-genome duplication approximately 95 Ma (24). Most notable is the demonstration that the immune-responsive up-regulation of IGFBP-1A and -6A subtypes is restricted to only one member in a salmonid-specific paralogue pair, suggesting this function has most likely been partitioned during evolution or plausibly even arisen de novo in salmonids. Although these data are novel for the salmonid IGFBP system and warrant further investigation, similar findings have been reported before in diverse physiological contexts (eg, Refs. 52–54), including a recent genome-wide analysis (23). Therefore, our results reinforce the need to identify and distinguish the expression of paralogues found in salmonid genomes, so as to comprehensively understand physiological systems of interest and avoid erroneous conclusions (see Ref. 7).
Conclusions
Our main discovery was the striking transcriptional induction of IGFBP-1 and IGFBP-6 subtypes during immune responses to viral and bacterial pathogens, with a contribution in expression coming from primary immune tissues. We provide evidence that these responses represent a direct transcriptional output of conserved signaling networks initiated by various cytokines. Our work also demonstrates that viral but not bacterial infection has a striking effect on the expression of genes from the IGF axis, as well as those governing muscle development, consistent with a role in energetic reallocation and remodeling of the growth phenotype. Additional work will be necessary to clarify the mechanisms linking genes from the vertebrate IGF axis to the plethora of pathways involved in host defense, including within muscle tissue, which is a major store of energy that can be reallocated during immune responses. Finally, it will be important to determine whether the induction of specific IGFBP subtypes during immune responses are present in other vertebrate taxa and thus represent a conserved mechanism facilitating cross talk between growth and immunity.
Acknowledgments
This work was supported by the European Community's Seventh Framework Program (FP7/2007–13) under Grant 442 Agreements 222719 (LIFECYCLE) and 311993 (TARGETFISH) and by institutional grants from the University of Aberdeen and Institut National de la Recherche Agronomique. A.A. was supported by a PhD studentship from Kuwait University.
Disclosure Summary: The authors have nothing to disclose.
Abbreviations
- AS
Aeromonas salmonicida
- FF
first feeding
- H
hatching
- IGFBP
IGF binding protein
- IGF-1R
IGF-1 receptor
- qPCR
quantitative PCR
- VHSv
viral hemorrhagic septicemia virus
- 3wFF
3 weeks after FF.
References
Author notes
Author contributions: S.A.M.M., C.J.S., D.J.M., and P.B. designed research; R.C., S.A.M.M., P.B., and T.W. performed animal experiments and sampling; A.A. and T.W. performed qPCR and molecular biology; A.A. and D.J.M. analyzed qPCR data; and A.A. and D.J.M. performed statistics. The manuscript, including table and figures, was drafted by D.J.M., A.A., and S.A.M.M. and completed with input from all authors.
D.J.M. and S.A.M.M. contributed equally to this work.
