


Abstract
Granulosa cells (GCs) are the major cellular component in a follicular microenvironment and play an indispensable role in ovarian function. This study was conducted to investigate the effects of ethanol exposure on the cellular and transcriptional changes of ovarian GCs.
For this purpose, bovine GCs were exposed to different concentrations of ethanol (0, 50, 100, 200, 500 and 1000) to mimic the effects of alcohol in in vitro. Subsequently, 100 and 1000 mM concentrations were discarded from further experiments, as 100 mM was not different from 50 mM, and 1000 mM was supertoxic to the cells.
The results showed that there was a gradual loss of cell viability with the increase of the ethanol concentration, i.e. lowest viability was observed at the highest concentration (1000 mM), which is further supported by cell proliferation assay. Mitochondrial activity decreased significantly at higher concentrations. The expression of NRF2 decreased significantly (P < 0.05) in ethanol-exposed cells compared with the cells in the control group at the 6-h time point, whereas the expression was increased in 500 mM concentration at the 24-h time point. The expression of antioxidant genes, downstream to Nrf2-pathway activation, showed that overall expression pattern similar to NRF2.
The result of this study prompted us to postulate that ethanol exposure decreases the ability of GCs to handle stress by downregulating the expression of genes involved in Nrf2-pathway.
INTRODUCTION
Continuous and prolonged exposure to ethanol, the active ingredient of alcoholic beverages, is negatively correlated with physical and mental health. Upon consumption of alcohol, it increases the production of reactive oxygen species (ROS) in the cells that cause oxidative stress and subsequent cellular damage (Barcia et al., 2017). It is interesting noting that the administration of antioxidants has been shown to be helpful to prevent or alter the toxic effects of alcohol (Liu et al., 2019) that reinforces the presence of alcohol-induced oxidative stress. Oxidative stress is an imbalanced situation where the production of prooxidants, i.e. ROS, overwhelmingly exceeds the cellular antioxidant capacity. In a homeostatic condition, our body consistently produces ROS as a byproduct of metabolic activities that are neutralized by cellular antioxidants. An elevated level of ROS signals the activation of different cellular pathways including the Nrf2–ARE signaling pathway to produce a battery of antioxidant enzymes to restore homeostasis and failure to do so results in cellular damages and subsequent cell death (Ma, 2013).
Many alcohol-related studies are focused on heart diseases (Larsson et al., 2018), liver failure (Logge et al., 2019), pancreatitis (Jeon et al., 2019) and gastric cancer (Wang et al., 2018) because these organs come under direct contact with alcohol. Although reproductive organs may not be directly exposed to ethanol, plenty of studies showed that alcohol consumption is linked to unexplained infertility. Exposure to ethanol results in lower ovarian weight, suboptimal follicular growth and development and decreased levels of serum estradiol (E2) (Van Thiel et al., 1978; Dees et al., 2017). Ethanol has also been shown to suppress serum E2 levels in prepubertal girls (Rachdaoui and Sarkar, 2017) and female rhesus monkeys (Dees et al., 2000). This action may be the result of direct effects of ethanol on the ovarian function as well as altered secretion of pituitary gonadotropins that regulate ovarian follicular development and ovulation.
Follicular development is a complex and dynamic process and is believed to be modulated by an orchestrated action of different hormones, local ovarian factors and spatiotemporal expression of several genes and microRNAs (miRNAs) (Sohel and Cinar, 2015). Among the cellular constituents, granulosa cells (GCs) are the major cellular fraction and these support oocytes during follicular growth and steroid production (Yada et al., 1999). Therefore, the integrity and function of GCs appear to be crucial in the follicular development and oocyte competence. We previously showed that oxidative stress induced by hydrogen peroxide is extremely cytotoxic to bovine granulosa cells (bGCs) (Sohel et al., 2016) and use of indirect antioxidant such as sulforaphane could activate the Nrf2–ARE pathway (Sohel et al., 2017) and subsequently protects the GCs from oxidative stress (Sohel et al., 2018). However, the effects of prolonged ethanol exposure in inducing and/or suppressing the activation of the Nrf2–ARE pathway in GCs remain to be investigated. The current study was conducted to investigate the molecular and cellular adaptation made by bGC under a high concentration of ethanol-induced stress in vitro. For this, we used GCs from the bovine origin and exposed them to different concentrations of ethanol in vitro.
MATERIALS AND METHODS
Collection of ovaries and GCs
bGCs were collected and cultured according to the protocol mentioned elsewhere (Sohel et al., 2013; Sohel, 2019). Briefly, ovaries were transported in a 0.9% saline solution at 38°C within 2 h of collection from a local slaughterhouse. After two additional wash with phosphate buffered saline (PBS), ovaries were dipped into 70% ethanol for 30 sec. Following several washes with warm PBS, the follicular materials (follicular fluid containing GCs) were aspirated from growing follicles (4–8 mm in diameter) by an 18-gauge needle attached to a 5-ml syringe. After the collection of follicular materials from all samples, tubes were shaken gently and left for 15 min at 38°C to allow the oocyte cumulus complex and cellular debris to be settled down at the bottom. The upper liquid containing GCs was collected in a 50-ml tube and centrifuged at 500 × g for 5 min to obtain the GCs in the form of pellets.
Culture and treatment of GCs
bGC pellets were washed once in calcium–magnesium-free PBS followed by centrifugation at 500 × g for 5 min and resuspended in 1 ml of red blood cell lysis buffer for 1 min to remove erythrocytes. After two additional washes with complete culture media, ~1 × 10⁶/ml viable cells were seeded in each well of a 6-well culture plate and cultured in Dulbecco’s modified Eagle’s medium/F-12 medium supplemented with 10% fetal bovine serum, penicillin (100 U/ml) and streptomycin (100 μg/ml) at 38°C in a humidified atmosphere of 5% CO2 until 40–50% confluence. bGCs were exposed to different concentrations of ethanol (0, 50, 100, 200, 500 and 1000 mM) for 6 and 24 h under optimum culture conditions. These concentrations of ethanol are physiologically relevant based on previous studies (Ku et al., 2007; Do et al., 2013). A constant concentration of ethanol in the media was maintained by sealing the culture plate with a sterile layer of enzyme-linked immunosorbent assay (ELISA) plate sealing film and changing the media at every 6-h time point. The same environmental condition was also maintained for the control cells. Following the treatment, cells were either investigated for different morphological evaluation or harvested using trypsin ethylenediaminetetraacetic acid and stored at −80°C for further analysis. It is important to note that for the detection of apoptosis, gene expression, ROS accumulation and mitochondrial activity, we only used four concentrations of ethanol (0, 50, 200 and 500 mM).
Cell morphology and viability
bGCs from control and different treatment groups were routinely observed under an inverted microscope (Nikon Eclipse TS100 microscope, Nikon, Tokyo, Japan) for confluence and changes in the morphology. The viability of cells was determined as previously described (Sohel et al., 2017). Briefly, after the treatment period, both adherent and floating cells were collected and resuspended in 1 ml of the complete medium by gentle pipetting. Following that, 100 μl of cell suspension and 100 μl of 0.4% trypan blue were mixed into a microcentrifuge tube and allowed to incubate for 1–2 min at room temperature. In total, 10 μl of cell mixture/trypan blue was applied to a hemocytometer and placed under a microscope for counting live and dead cells. The percentage of viable cells was calculated as follows: percentage of cell viability = (number of unstained cells/numbers of total cells) × 100.
Cell proliferation assay
Cell Proliferation Reagent WST-1 (Roche Diagnostics GmbH, Mannheim, Germany) kit was used to determine the level of cytotoxicity induced by different concentrations of ethanol on bGCs according to the protocol mentioned elsewhere (Sohel et al., 2019). Briefly, 1 × 10⁴ viable bGCs were plated in each well of 96-well microplate (Clear, Flat Bottom TC-Treated, Corning Incorporated) containing 100 μl/well culture medium and continue culturing until 50% confluence. Cells were treated according to the experimental plan. Following the culture period, 10 μl WST-1 reagent was added to each well of the microplate and incubated for 5 h at 38°C in presence of 5% CO2. After that, the microplate was shaken for 1 min and absorbance was measured using a microplate (ELISA) reader (Glomax Multi Detection System, Promega BioSystems Sunnyvale, CA) at a wavelength of 460 nm.
Extraction of total RNA and cDNA synthesis
Total RNA was extracted from GCs using the miRNeasy mini kit (Qiagen, Hilden, Germany) according to the manufacturer’s instruction. An on-column DNase digestion step using RNase-Free DNase set (Cat no. 79254, Qiagen, Hilden, Germany) was performed during total RNA isolation. The purity and concentration of total RNA were determined by a BioSpec-nano spectrophotometer (Shimadzu Biotech, Japan). The RNA was then reverse transcribed to complementary (DNA) cDNA using miScript® II RT Kit (Cat. No. 218191, Qiagen, Hilden, Germany) according to the manufacturers’ instruction. The cDNA synthesis reaction consists of 5× HiSpec Buffer (4 μl), 10× miScript Nucleics Mix (2 μl), miScript Reverse Transcriptase Mix (2 μl), water (variable) and template RNA (400 ng). First, the cDNA synthesis reaction was incubated at 37°C for 60 min followed by 95°C for 5-min incubation. The resulting cDNA was diluted according to the manufacturer’s instructions for further use.
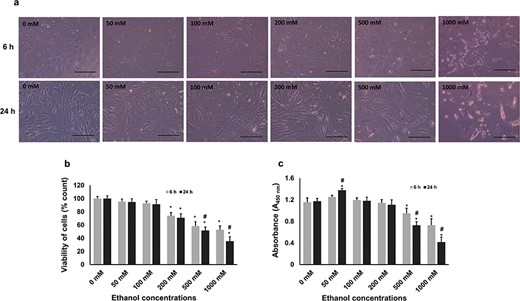
Effects of different concentrations of ethanol exposure on cellular morphology, viability and proliferation. bGCs were grown in cell culture plates under standard culture conditions until 50–60% confluence. Cells were treated with different concentrations of ethanol for 6 and 24 h. (a) Representative micrographs of GCs in different ethanol concentrations at two time points (n = 3), scale bar 200 μm. (b) The viability of GCs under different treatment conditions was determined using the trypan blue exclusion test. Cells were subjected to a staining procedure and were counted using a hemocytometer under a microscope. The bar diagrams representing the number of viable cells in percentage. (c) Cytotoxic effects of ethanol exposure were determined WST-1 kit in an ELISA reader. Data are represented as mean ± SD of three different independent experiments. Different asterisks representing the significant differences (P ≤ 0.05) where * = significantly different in different treatments compared with the control group and # = significantly different in two time points.
Real-time quantitative PCR
All the target genes were quantified from the resulting cDNA samples using a Roche Light cycler 480 real-time polymerase chain reaction (PCR) machine (Roche Life Science, Penzberg, Germany) where GAPDH was used as an endogenous control. The quantitative reverse transcription polymerase chain reaction (qRT-PCR) was set up using a 2 μl first-strand cDNA template, 7.4 μl deionized H2O, 0.3 μM of forward and reverse gene specific primers and 10 μl 1× Power SYBR Green I (Bio-Rad) master mix with carboxy-X-rhodamine (ROX) as a reference dye. The thermal cycling conditions were 3 min at 95°C followed by 40 cycles of 15 sec at 95°C and 1 min at 60°C. Relative expressions of each mRNA were analyzed using a comparative CT (2−ΔΔCT) method. A total of eight genes namely BAX, Caspase 3 (CASP3), NRF2, KEAP1, catalase (CAT), heme oxygenase 1 (HO-1), superoxide dismutase-1 (SOD1) and peroxiredoxin-1 (PRDX1) were investigated using sequence-specific primers. Primer3web (version 4.1.0) was used to design the primers and sequences are listed in the Supplementary Table S1.
Detection of apoptosis by TUNEL assay
Terminal deoxynucleotidyl transferase (TdT) dUTP nick-end labeling (TUNEL) assay (Life Technologies, Inc., Carlsbad, CA) was used to detect apoptosis in GCs (n = 3) according to the protocol described elsewhere (Sohel et al., 2017). In brief, 50 μl of TdT reaction mixture was added to each well of 96-well plates after the treatment period and incubated for 1 h at 37°C followed by the addition of Alexa Fluor® 594 dye (red fluorescence) and incubated for 30 min. Cells were then stained using 5 ng/ml 4′,6-diamidino-2-phenylindole (DAPI) (ThermoFisher Scientific) in PBS for 5 min to detect the nucleus and observed under a fluorescence microscope (Nikon Eclipse Ti-S microscope, Nikon Instruments Inc., Tokyo, Japan; ×20 magnification) using red and blue fluorescence filters. TUNEL-positive and TUNEL-negative nuclei were counted from five non-overlapping fields per replicate and converted to percentages by comparing the total number of nuclei with TUNEL-positive nuclei.
Accumulation of intracellular ROS
The fluorescent dye 2′7′-dichlorodihydrofluorescein diacetate (H2DCFDA; Molecular Probes, Eugene, OR) was used to investigate the accumulation of intracellular ROS in ethanol-treated and untreated (0.05% dimethyl sulfoxide-treated) bGCs. Briefly, bGCs were first washed twice with Dulbecco's phosphate-buffered saline (DPBS), and then 400 μl of 15 μM H2DCFDA was added to each well of 24-well culture plate and incubated for 30 min in dark at 38°C. Following the incubation, cells were washed two times in PBS, and images were captured immediately under a fluorescence microscope (Nikon Eclipse Ti-S microscope, Nikon Instruments Inc., Tokyo, Japan) using a green-fluorescence filter. The mean fluorescence intensity of five non-overlapping fields per well was measured using ImageJ software.
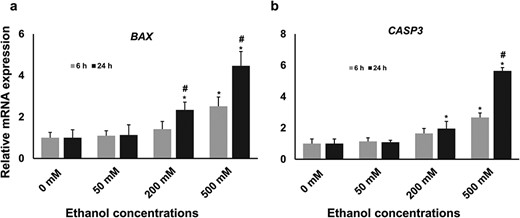
The expression level of BAX and CASP3 mRNA in different treatment groups. The relative abundance of BAX (a) and CASPS3 (b) mRNA was measured in a real-time qPCR platform where GAPDH was used as the housekeeping gene. The result showed that the expression of both genes was significantly increased in 200 and 500 mM concentrations compared with the untreated control group. Statistically significant effects (P ≤ 0.05) of different treatments on gene expression are marked with asterisks, where * = significantly different in different ethanol treatments compared with the control group and # = significantly different in two time points.
Mitochondrial activity
MitoTracker1 Red CMXRos (M7512; Life Technologies, Oregon) was used to examine the mitochondrial activity (n = 3) using the manufacturer’s protocol. bGCs were washed twice with DPBS followed by the addition of 100 nM Mito Tracker red dye and incubated for 45 min. bGCs were washed two times with DPBS and fixed overnight with 4% formaldehyde. On the next day, fixed cells were mounted with a mounting medium containing DAPI (H-1200, Vector Laboratories, Inc., California). Images were captured immediately using a fluorescence microscope (Nikon Eclipse Ti-S microscope, Nikon Instruments Inc., Tokyo, Japan). The mean fluorescence intensity of five non-overlapping fields in each well was measured using ImageJ software.
Statistical analysis
All experiments have been performed a minimum of three times. When two groups were compared, a Student’s t-test was used to detect differences between treatment groups. A P-value of ≤0.05 was considered to be significant. Data are expressed as mean ± standard deviation (SD) of replicates.
RESULTS
Cell morphology and viability
The purity of the isolated GCs was confirmed by analyzing the expression of FSHR and CYP17A1 genes as previously described (Sohel, 2019) (data not shown). Cells were observed for their phenotypic changes in response to ethanol exposure in both 6- and 24-h time points. The microscopic observations revealed that in lower concentrations, particularly in 50–200 mM in both 6- and 24-h time points, the cell morphology appeared normal and there were not many dead cells (Fig. 1a). However, at higher ethanol concentrations, GCs were facing stress as marked by shrinkage in the cell structure and a higher number of floating dead cells (Fig. 1a).
The cell viability test demonstrated that there was an increasingly reduced GC viability as the concentration progressed except at 50- and 100-mM concentrations. Compared with the control group, a significantly (P < 0.05) reduced viability was observed in 200–1000 mM concentrations in both 6- and 24-h time points (Fig. 1b). Although a trend of reduced cell viability was observed in each concentration at 24-h time point compared with 6-h time point, a significant reduction of viability was observed only at 500 and 1000 mM concentrations (Fig. 1b).
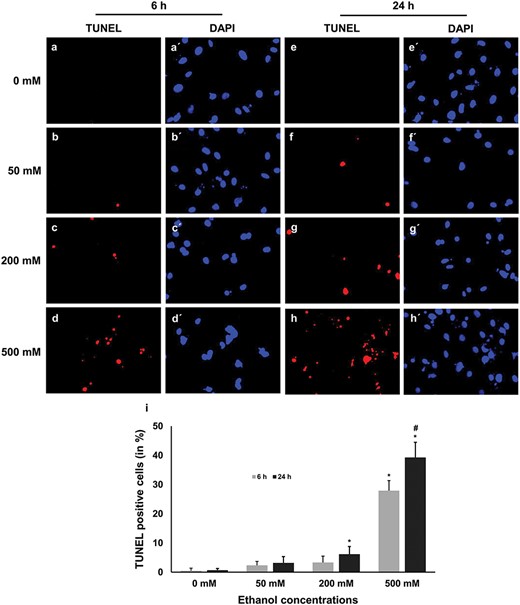
Detection of damaged DNA using TUNEL assay. The fragmented DNA was stained as red, whereas the nucleus was stained as blue. Fragmented DNA was counted from five non-overlapping fields and converted into percentage by comparing the TUNEL-positive nuclei with the total number of nuclei. The results showed that significantly (P ≤ 0.05) higher number of TUNEL-positive apoptotic nuclei are in 500 mM concentration group when compared with the untreated control group. Upper panel: representative micrographs of double staining of TUNEL (red fluorescent) and DAPI (blue), scale bar 100 μm; Lower panel: quantitative data analysis of TUNEL-positive cells, where * = significantly different in different treatments compared with the control group and # = significantly different in two time points.
Effects of ethanol on the GC proliferation
The results showed that the cell proliferation was not significantly different in 50–200 mM concentrations compared with control in both time points except one case where exposure to 50 mM ethanol for 24 h resulted in a significant increase in the GC proliferation in comparison to both 24-h control and 6-h 50 mM concentration. However, the rate of cell proliferation was significantly decreased in 500 and 1000 mM concentration compared with control at both time points where 24-h exposure resulted in a significant reduction in cell proliferation compared with 6-h exposure (Fig. 1c).
Expression of genes related to apoptosis
After the evaluation of morphometric and phenotypic results, we discarded 100- and 1000-mM concentrations from further experiments as there was no significant difference between 100 and 200 mM concentrations and extremely few cells were alive after 1000-mM exposure. To evaluate the effect of ethanol exposure on the induction of apoptosis in bGCs, the expression of two major genes, namely BAX and CAPS3, was investigated. The result showed that the expression of BAX was significantly increased at 6-h time point only at 500 mM concentrations compared with control, whereas at 24-h time point there was a significant increase in both 200 and 500 mM concentrations (Fig. 2a). A similar expression pattern was also observed in the case of CASP3 (Fig. 2b). Compared with control, no significant changes in the expression of BAX and CASP3 was observed at 50 mM concentration at both time points. In addition, prolonged exposure (24 h) to 200 and 500 mM significantly enhanced the expression of BAX and CASP3 compared with shorter exposure (6 h).
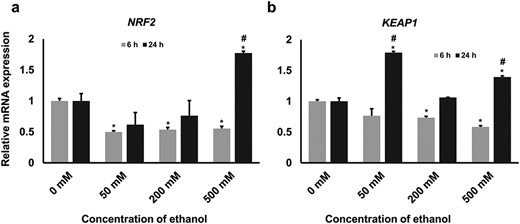
The expression level of NRF2 and KEAP1 mRNA. To understand the role of ethanol in activating/suppressing the Nrf2 pathway, we investigated the central genes of this pathway, namely (a) NRF2 and (b) KEAP1, using real-time quantitative PCR platform. The results showed that the expression of both genes was decreased in higher concentrations of ethanol at the 6-h time point. However, an aberrant expression pattern was observed at 24-h time point. The statistical significance effect (P < 0.05) of different treatments on gene expression is marked with asterisks (* = significantly different in different treatments compared with untreated control and # = significantly different in time points).
Higher concentrations and longer exposure lead to bGCs apoptosis
The result showed that there were only a few TUNEL-positive cells when the cells were exposed to 50 mM ethanol in both 6- and 24-h time points. However, exposure to 200 mM ethanol resulted in a significant increase in the TUNEL-positive cells at a 24-h time point compared with those of the control group, although no significant increase was observed at 6-h time point (Fig. 3c, g and i). The highest number of apoptotic cells was detected in 500 mM concentration at both time points (Fig. 3d, h and i). A significantly higher number of apoptotic cells were observed at 500 mM concentration at 24-h time point compared with those of 6-h time point (Fig. 3i).
Prolonged ethanol exposure alters the expression of NRF2 and KEAP1 genes
Next, we investigated two central genes (NRF2 and KEAP1) of the Nrf2-mediated stress response pathway in bGCs under such conditions. Expression analysis using qRT-PCR revealed a significant downregulation of NRF2 in all the concentrations at the 6-h time point. Although a decrease (not significant) in the expression of NRF2 was observed at 50 and 200 mM concentrations, the expression was significantly increased at 500 mM concentration at 24-h time point compared with those of the control group (Fig. 4a). There was a significant decrease in the expression of KEAP1 in 200 and 500 mM concentrations at 6-h time point compared with the control group; however, an erratic expression pattern was observed at 24-h time point. The expression KEAP1 at 24-h time point was significantly increased at 50 mM concentration, then decreased to the level of control at 200 mM concentration and again significantly increased at 500 mM concentration (Fig. 4b).
Expression of genes downstream to the Nrf2–ARE pathway
Next, we investigated the expression of selected antioxidant genes, namely CAT, HO-1, SOD and PRDX1, downstream to the NRF2-signaling pathway. The expression of all these antioxidant genes was decreased significantly in all treatment groups compared with those of the control at 6-h time point (Fig. 5a–d). However, there was a trend of increased expression of all genes that was observed at 24-h time point compared with those of control. The highest expression of these genes was observed in the cells exposed to 500 mM concentration at 24-h time point (Fig. 5a–d). Furthermore, in all the concentrations, these genes were highly expressed at 24-h time point compared with the 6-h time point (Fig. 5a–d).
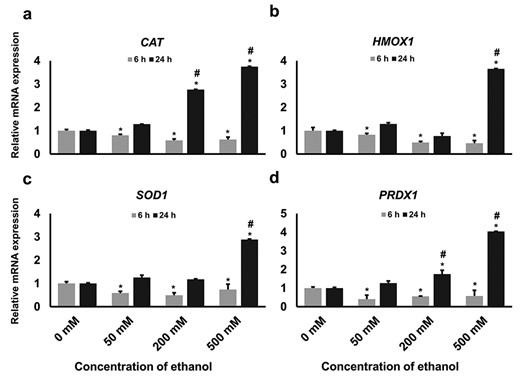
Relative expression of selected antioxidant genes downstream to NRF2 activation. GCs were treated with different concentrations of ethanol according to the experimental design and the expression of (a) CAT, (b) HO-1, (c) SOD1 and (d) PRDX1 genes at mRNA level was measured by real-time qPCR. Data are presented as means ± SD of three different independent experiments. Different asterisks represent statistically significant differences (P ≤ 0.05), where * = significantly different compared with the control group and # = significantly different in two time points.
The higher concentration of ethanol increases the ROS accumulation
Exposure to ethanol resulted in the accumulation of ROS in bGCs in a concentration-dependent manner in both time points. No differences were observed between 0 and 50 mM ethanol treatment. However, there was a significant increase in the ROS accumulation in 200 and 500 mM concentrations in both time points (Fig. 6c, d, g and h). The highest accumulation of ROS was observed in the cells exposed to 500 mM ethanol for 24 h (Fig. 6h).
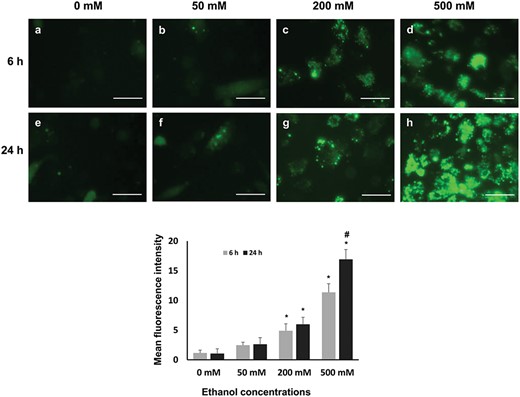
ROS accumulation in GCs after treatment with different concentration of ethanol at two time points. (a–h) After the treatment GCs were visualized under a fluorescent microscope, scale bar 100 μm Mean fluorescence intensity was quantified by ImageJ software or from three non-overlapping fields per well, experiments were performed in triplicates; data are presented as mean ± SD. Statistically significant effects (P ≤ 0.05) of different treatments on ROS accumulation are marked with asterisks, where * = significantly different in various treatments compared with those of control group and # = significantly different in two time points.
Higher dosages of ethanol reduce the mitochondrial activity
To estimate the effect of ethanol exposure on the mitochondrial function, the activity of mitochondria was investigated using MitoTracker1 Red CMXRos that stains the active mitochondria. The mitochondrial activity at 50 mM concentration at both the time points was similar to the control group as shown in Figure 7a, b, e and f. However, the activity was significantly decreased at 200 and 500 mM concentrations compared with those of controls at both time points as evidenced by lower fluorescence activity (Fig. 7c, d, g and h). When two time points were compared, a significant reduction of mitochondrial activity was observed at 500 mM concentration at 24-h time point (Fig. 7i).
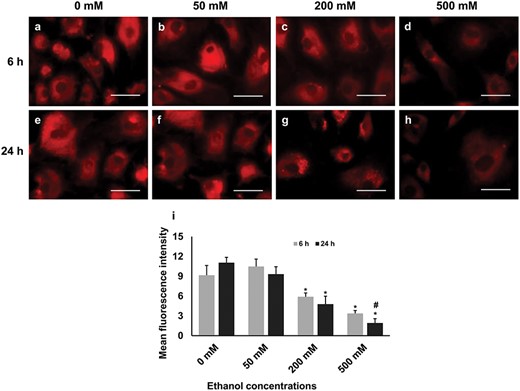
The activity of mitochondria in GCs under different treatment conditions. Higher panel: labels a–h show active mitochondria in red, scale bars, 50 μm. Lower panel: quantitative analysis of mean fluorescence intensity performed using ImageJ; experiments were performed in triplicates; data are presented as mean ± SD. Statistically significant effects (P ≤ 0.05) of different treatments on mitochondrial activity are marked with asterisks, where * = significantly different in various treatments compared with those of control group and # = significantly different in two time points.
DISCUSSION
In the current study, we aimed to investigate the cellular and molecular adaptation strategies of GCs against ethanol-induced stress. We chose to work with GCs from the bovine origin as it is easier to obtain samples from a local slaughterhouse. The major challenge in the current study was to find out appropriate concentrations of ethanol for GCs due to the lack of previous studies. Therefore, we employed a wide range of ethanol concentrations (50–1000 mM). Based on viability and cell proliferation results, we have eliminated 100 mM and 1000 mM concentrations from further experimentations as there were no differences between 100 and 200 mM concentrations and at 1000 mM concentration a few cells were alive after ethanol exposure. The concentration of 500 mM ethanol may seem higher for other cells; however, at this concentration GCs lost ~ 50% viability. Therefore, we choose this concentration as the highest concentration. We have observed that 6-h exposure time was comparatively lower cytotoxic than a 24-h exposure period as evidenced by cell viability and proliferation test (Fig. 1b, c). No significant loss of cell viability was observed at lower concentrations (50–100 mM) for both exposure time points; however, a dose-dependent decrease in the viability was observed in the concentration >200 mM. A similar trend of cell viability was reported on a fibroblastic cell line derived from mouse connective tissue by Mikami and colleagues where they observed that there was no significant loss of cell viability when the cells were exposed to ethanol (12.5–200 mM) for 6 h (Mikami et al., 1997). However, in contrast to our results, Liu et al. reported a significant loss of rat GC viability at relatively lower concentrations (75 mM) and shorter exposure time (3 h). The variation of results could be due to the difference in the origin of GCs and the experimental setup. After treatment with ethanol for 6 and 24 h, the viability of GCs was significantly reduced in concentrations 200 mM or higher indicating that ethanol may exert toxicity in the female reproductive system via inducing GC apoptosis in a concentration-dependent manner.
In ovarian GCs, like many other mammalian cells, apoptosis is a tightly controlled mechanism where both BAX and CASP3 play a central role. A time and dose-dependent increase in the expression of BAX and CASP3 was observed in the bGCs exposed to ethanol. Importantly, the highest expression of both genes was observed at 24-h time point when the cells were exposed to the highest concentration of ethanol suggesting that prolonged exposure with higher concentrations of ethanol might induce the activation of apoptotic pathways in GCs. In agreement with our findings, Liu and colleagues reported a time- and concentration-dependent increase in the expression of BAX and CASP3 in rat ovarian GCs (Liu et al., 2018). The results of the TUNEL assay have further validated that higher concentrations of ethanol for prolonged exposure induce apoptosis in bGCs.
Nrf2 signaling pathway is the major pathway that plays a significant role in protecting cells against exogenous and endogenous stress-induced apoptosis. It has been shown that overexpression of NRF2 could protect the cells from Fas-induced apoptosis (Kotlo et al., 2003). Besides, Nrf2 knockout mouse embryonic fibroblast cells are producing a higher level of ROS and these cells are vulnerable to exogenous stressors (He et al., 2007) suggesting a central role of Nrf2 against stress and toxicity. The current study demonstrated that there was a significant decrease in the expression of NRF2 in all concentrations at both time points except 500 mM 24-h exposure. Similar to our study, Shanmugam and colleagues found that in utero ethanol exposure significantly reduces the transcriptional abundance of NRF2 in the placental cells (Shanmugam et al., 2019). However, in contrast to our findings, Dong and colleagues reported an increase in the expression of NRF2 in the mouse embryonic cells exposed to ethanol in vivo (Dong et al., 2008). Lower expression of both NRF2 and KEAP1 could suggest a possible transcriptional arrest in the GCs during ethanol exposure.
Under a stressed condition, NRF2 translocated from cytoplasm to the nucleus to produce an array of phase II antioxidant genes including Catalase (CAT), Peroxiredoxin-1 (PRDX1), Superoxide dismutase (SOD) and Heme oxygenase 1 (HO-1) to restore the homeostasis (Zhao et al., 2014). It has been shown that overexpression of NRF2 could diminish the ethanol-induced oxidative stress and apoptosis through inducing the production of phase II antioxidant genes in neuronal crest cells (Chen et al., 2013). Significantly, lower expression of antioxidant genes in our study at all concentrations for 6-h exposure could be directly related to the transcriptional suppression of NRF2.
It has been shown that ethanol-induced apoptosis and cell death are also initiated by excessive generation of intracellular ROS (Pérez et al., 2020). Our results revealed that there was a higher accumulation of ROS at a high concentration as indicated by increased fluorescence activity. Interestingly, the production of ROS and expression of NRF2 and other downstream genes are not positively correlated. For instance, despite an increase in ROS production at the 200 mM concentration, the expression of NRF2 and downstream antioxidant genes was not increased as expected. This is also true for 500 mM concentration and 6-h exposure time point. Perhaps, at lower concentrations and shorter exposure periods, ethanol may play a role to suppress the expression of NRF2 and downstream antioxidant genes. However, the exact mechanism is not well understood and warrants further investigations.
Metabolism of ethanol through alcohol dehydrogenase generates cytosolic nicotinamide adenine dinucleotide (NADH), which is oxidized by mitochondrial electron transport chain (Hoek et al., 2002; Pérez et al., 2020). It has been proposed that there is an increase in the NADH:NAD+ ratio during acute alcohol metabolism that resulted in a higher generation of mitochondrial superoxide (Bailey and Cunningham, 1998). In addition, the formation of ROS in the mitochondria during ethanol metabolism crucially depends on the respiratory condition, i.e. O2 supply and electron transport. Therefore, conditions that increase the supply of NADH without increasing respiration promote the production of ROS through the electron transport chain (Hoek et al., 2002). In this study, we have observed that at lower concentrations (50 mM) of ethanol, mitochondrial activity slightly increased, whereas at higher concentrations (200 and 500 mM) the activity significantly decreased suggesting a loss of mitochondrial function. The release of cytochrome c from the damaged mitochondria (Cai et al., 1998) might be involved in the activation and execution of apoptosis of GCs exposed to the higher concentration of ethanol.
CONCLUSION
In summary, the results of our study showed that ethanol exposure affects the growth and viability of GCs in a time- and dose-dependent manner, where at higher concentrations lower cell viability was observed that could be due to the activation of apoptotic pathways. It is important to note that both the NRF2 and its downstream antioxidant genes were downregulated in all concentrations at 6-h time point; however, significantly increased expression of these genes was observed in 500 mM concentrations at 24-h time point. In addition, the activity of mitochondria was also decreased in a time and dose-dependent manner. The results of this study indicated that a higher level of ethanol for prolonged exposure could lead to oxidative stress and subsequent GC apoptosis by decreasing the activity of Nrf2-pathway.
ACKNOWLEDGMENT
The authors are thankful to Mr Mahmut Kaliber for his help during the collection of ovaries from the slaughterhouse.
Data availability
All the data generated in this study are presented in figures in this article available upon reasonable request.
Conflict of interest statement
None declared. The funder had no contribution in designing experiments and preparing the manuscript.
FUNDING
Erciyes University Scientific Research Projects Coordination Unit (project number FYL-2016-6734).
