


Abstract
Projections of physical therapist supply and demand provide critical insights into workforce trends, including factors that may influence possible shortages.
This study evaluates the current and forecasted adequacy of the physical therapist workforce in the United States to meet the evolving health care needs of the population.
This is a cross-sectional study that combines survey data, analysis of administrative databases, and microsimulation modeling.
The study evaluates future demand for physical therapists across all employment and care delivery settings. Projections of supply and demand are compared to assess workforce adequacy nationally and by state through 2037.
Supply modeling incorporates a representative sample of physical therapists from each state, derived from the Federation of State Boards of Physical Therapy (FSBPT) counts and demographic data from the American Physical Therapy Association (APTA) member database. An online survey administered in April 2024 to APTA members (n = 1759 completed surveys, 18% response rate) collected data on demographics, practice characteristics, workload, hours worked, and retirement intentions.
The study examines key factors influencing the physical therapist workforce, including demographics, care delivery patterns, workload, hours worked, and provider retention.
The study forecasts annual full-time equivalent (FTE) physical therapist supply and demand through 2037, with state-level analysis and additional forecasts for alternative forecast scenarios.
In 2022, there were an estimated 233,890 FTE physical therapists in the workforce. A projected shortfall of 12,070 FTEs (5.2%) in 2022 was identified relative to population demand. Although projected supply growth from 2022 to 2037 (39,170 FTEs) exceeds demand growth (36,280 FTEs), a national shortfall remains in most forecast scenarios. By 2037, the physical therapist supply is expected to reach 273,070 FTEs, while demand will increase to 282,230 FTEs, resulting in a projected shortfall of 9120 FTEs (3.3%) in the main scenario.
Unless measures are implemented to boost the number of physical therapists entering or re-entering the workforce, or policies are enacted to improve retention, the national shortfall is likely to persist, further exacerbating access to care challenges.
This study underscores the need for targeted policy interventions to address workforce shortages and additional research into health care workforce forecasting.
INTRODUCTION
As one of the largest clinical health care occupations in the United States (US), examining the adequacy of the physical therapist workforce relative to the demand for physical therapist services is crucial for meeting health care needs and understanding the status and future of the profession.1 In short, health care planning requires accurate national and sub-national estimates of the supply and demand for physical therapist services. Previous projections have highlighted potential shortages: a 2016 study anticipated a shortfall of 9385 physical therapists by 2020,2 and prior projections from the Health Resources and Services Administration (HRSA) predicted that by 2036 demand will exceed supply by ~6500 full-time equivalent (FTE) physical therapists, representing a 2% shortfall.3 Both projections have limitations. The earlier study predates COVID-19, relies on outdated data, and uses a stock-and-flow method to calculate supply. Meanwhile, the prior HRSA study assumed an initial equilibrium between supply and demand instead of assessing the initial supply adequacy and has imprecise data on physical therapists’ intentions to remain in the profession.
Given the aging population and consequent rising prevalence of conditions that benefit from physical therapy, it is essential to maintain a geographically well-distributed and sufficient workforce of physical therapists to provide timely and effective care. This study aims to identify the current relationship between supply and demand and project future trends, enabling policymakers and others to implement strategic initiatives to address shortages, enhance training programs, and optimize resource allocation. Additionally, the findings may interest students and professionals considering a career as a physical therapist, ensuring a supply of qualified practitioners to meet growing demand.
METHODS
This study advances previous research on the physical therapist workforce by using a microsimulation model and data collected via a 2024 survey of physical therapists. Under guidelines provided by the University of Albany’s Institutional Review Board (IRB), the study survey did not require IRB review. See Supplementary Material 3 for the text of the survey.
Model Overview
The microsimulation model used to develop workforce projections in this article employs a method widely utilized to study various health professions for federal and state governments, associations, and health systems.4–8 Unlike the stock-and-flow method utilized in the 2016 study,2 which focused on aggregate-level dynamics and tracked the movement of the workforce between different states, the microsimulation method offers a detailed, individual-level analysis. This approach accounts for the heterogeneity within the population by considering individual characteristics that influence physical therapists’ decisions to exit the workforce over time. We briefly describe study methods, data, and assumptions here, with detailed technical information on the microsimulation model underlying this study published in the Supplementary Material 1 and elsewhere.9 This study serves as a refinement to prior projections of the physical therapist workforce done each year for the National Center for Health Workforce Analysis (NCHWA).3 The model used for this analysis is the same model utilized to produce the projections for NCHWA, and the projections are the same as HRSA’s November 2024 projections that incorporated findings from this study. Prior projections for the federal government utilized national surveys that are not specific to the physical therapy profession but include physical therapists as an occupation that respondents may indicate. Drawing on data collected from the APTA survey allows for a better understanding of the specifics of physical therapist workforce dynamics from sources specifically intended to track and describe the actual physical therapist workforce—particularly, retirement patterns, hours worked patterns, and starting year shortfalls.
Supply Modeling
Supply projections are derived from a microsimulation model incorporating de-identified individual-level data on the physical therapist workforce. This approach simulates workforce participation patterns in response to changing demographics and external factors. Starting with data on the current supply of physical therapists, the model makes projections by adding new workforce entrants (graduates from Doctor of Physical Therapy programs and internationally trained therapists). In addition, the model adjusts projections based on patterns in hours worked, retirement, and cross-state migration (Figure 1). The analysis also includes alternative projections to illustrate the sensitivity of projections to key factors with uncertain future values, providing estimates based on “what if” scenarios, such as changes in retirement patterns or the number of workforce entrants.
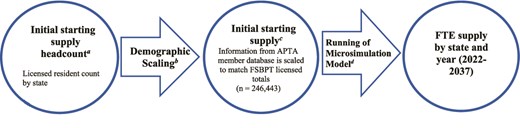
Supply Model Diagram. Sources: (a) FSBPT licensure data10; (b) APTA member database that contains demographic and location information (n = 42,160)11; (c) APTA member database and FSBPT licensure data10,11; (d) Contains further filtering based on age, and generates FTEs based on 40-hour definition. Average FTE is derived from the 2024 Physical Therapist Workforce Survey (39.4 hours per week). APTA = American Physical Therapy Association; FSBPT = Federation of State Boards of Physical Therapy; FTE = full-time equivalent.
The initial 2022 supply estimate of 233,890 physical therapists is based on state licensure counts from the Federation of State Boards of Physical Therapy (FSBPT) and demographic information from the APTA member database (Figure 2).10,11 To avoid overestimation due to multistate licensure, the starting supply is estimated using counts of licensed residents by state (n = 246,440) rather than total licenses issued (n = 344,920). Demographic data such as age, race and ethnicity, and sex are sampled by state from the APTA member database to create a representative sample that reflects the licensed resident totals provided by the FSBPT. In the microsimulation, individuals modeled as aged 75 and older are excluded from the starting supply, as many may maintain licensure without actively participating in the workforce.

To compare future supply to current supply, and to compare supply to demand, we use the concept of a FTE provider, defined as 40 hours per week in professional activities requiring a physical therapist license. According to the APTA survey, the average weekly hours worked is 39.4, which means the starting FTE supply is slightly lower than starting supply headcount (Figure 2). The use of this FTE definition provides a consistent metric for evaluating both supply and demand in the starting year and throughout the projection period.
In 2022, 11,493 physical therapists completed DPT programs in the US, with an additional 744 internationally-educated physical therapists entering the US annually, on average, from 2021–2023 (R. Woolf, Federation of State Boards of Physical Therapy, personal communication, May 10, 2024.). Therefore, ~12,240 new entrants are estimated to begin work as physical therapists each year in the baseline scenario. This simulation assumes a stable influx of new entrants without accounting for planned expansions or reductions in educational programs. Alternative scenarios relax this assumption and demonstrate the impact of more or fewer workforce entrants on the forecasts.
The microsimulation supply model also accounts for age and sex differences in weekly hours worked, as estimated from the 2024 survey responses, due to hours worked not being available in the licensure data and the 2024 survey being more recent than latest American Community Survey (ACS) data. Ordinary Least Squares regression is used for the analysis, with the explanatory variables consisting of physical therapist sex and age group. On average, male physical therapists work 5.1 more hours per week than their female peers. Hours worked remain relatively constant until age 55, after which they decline with age (Figure 3).
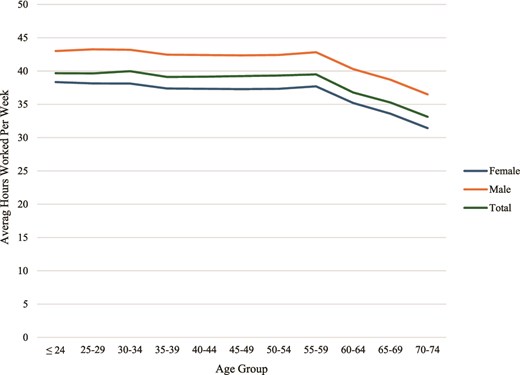
Average Weekly Hours Worked by Physical Therapist Sex and Age Group. Source: Analysis of APTA 2024 Physical Therapist Workforce Survey. Calculations made using weighted survey responses (n = 1431). APTA = American Physical Therapy Association.
For physical therapists aged 50 and older, the model uses age-dependent annual attrition probabilities to simulate workforce exit. Retirement trends are derived from the 2024 survey, where respondents are asked about their intentions to retire or leave the profession within the next year (Figure 4). The analysis indicates that roughly 60% of physical therapists aged 50 will retire by age 65, with over 90% retiring by age 70. For modeling purposes, all physical therapists retire by age 75. Sensitivity analysis models the impact of retirements on supply projections.
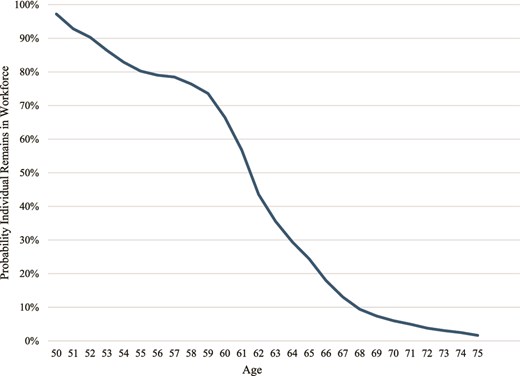
Probability a Physical Therapist Aged 50 Remains Active Over Time. Source: Analysis of APTA 2024 Physical Therapist Workforce Survey. Calculations made using weighted survey responses (n = 1466). APTA = American Physical Therapy Association.
We estimate that 1.42% of physical therapists under age 50 will exit the profession each year and change careers. These attrition patterns are derived from the Current Population Survey (CPS) Annual Social and Economic Supplement (ASEC) data covering 2011 to 2023 but excluding 2020. We used logistic regression to estimate the probability of career change by analyzing survey respondents who were part of the physical therapist workforce the year before the survey. The dependent variable is a binary variable of whether the person remained in physical therapy or changed occupations and is based on a method used by Wolf et al.12 Explanatory variables include the person’s sex, race and ethnicity, age, survey year, and occupation income from the Occupational Employment and Wage Statistics (OEWS).
Between 8500 and 13,300 physical therapists are projected to exit the profession annually between 2022 and 2037. Supplementary Material 1 provides detailed information on this analysis.
Supply Scenarios
The following scenarios reflect uncertainties in key supply determinants and the impact of variations in their values on workforce projections.
Baseline scenario: This scenario assumes a continuation of 12,240 annual new entrants, with no changes in hours worked or the retirement patterns discussed above.
More or fewer entrants’ scenarios: These 2 scenarios model a 10% increase (13,470) and a 10% decrease (11,020) in annual workforce entrants. The number of DPT program graduates has grown over the past 2 decades, but such growth can only continue with increased investment in graduate physical therapist education. Therefore, we must be cautious about assuming that past growth will continue perpetually.
Early or delayed retirement scenarios: These scenarios model the impact of workers retiring 2 years earlier or later on average, reflecting uncertainty about future retirement intentions, including concerns of increasing burnout among health care providers.13,14
Policy makers have relatively few levers they can pull to create change. Most of the options come down to incentivizing bringing more individuals into the workforce or keeping individuals in the workforce longer. Scenarios were developed as a representation of change that is within the realm of reasonable possibility.
Demand Modeling
The demand modeling approach includes 3 components: (1) population files for each US county (or similar geographic unit for some states) through 2037; (2) prediction equations for the demand for physical therapist services; and (3) physical therapist staffing necessary to meet estimated service demand (Figure 5).
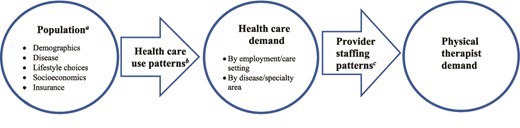
Demand Model Diagram. Sources: (a) American Community Survey,15 Behavioral Risk Factor Surveillance System,16 Medicare Beneficiary Survey,17 Long-Term Care Minimum Data Set,18 and U.S. Census Bureau, Demographic Counts by County19; (b) Medical Expenditure Panel Survey20 and National Inpatient Sample21; (c) Constructed using APTA supply estimates, current supply adequacy from APTA 2024 Physical Therapist Workforce Survey, and national estimates of base year demand for services. APTA = American Physical Therapy Association.
We constructed a representative sample of the population in each US county using data sources comprising the 2022 US Census, the 2022 American Community Survey (ACS), the 2021 to 2022 Behavioral Risk Factor Surveillance System (BRFSS), the 2021 Medicare Beneficiary Survey (MCBS) for residential care settings, and the 2021 Centers for Medicare & Medicaid Services (CMS) Nursing Home Minimum Data Set for nursing home populations.15–19 The resulting dataset for each county contains a health profile for a representative population sample, including demographics (age, sex, race and ethnicity), health risk factors (obesity, smoking), insurance type, household income, and the presence of various chronic diseases. Unfortunately, these sources do not collect sufficient or consistent data on the presence of chronic pain to include chronic pain as a determinant of demand for physical therapist services.
For validation and calibration, we compared the calculated disease prevalence at the county level to estimates from the Centers for Disease Control and Prevention Places database, and small scaling adjustments were made as needed.22 These profiles were reweighted using county-level population projections to reflect future population growth, aging, and increased racial and ethnic diversity.
Health-seeking behavior patterns come from an analysis of ~180,000 participants in the pooled 2017 to 2021 files of the Medical Expenditure Panel Survey (MEPS). MEPS contains survey data on individuals combined with records pulled from their medical providers. We use negative binomial regression to model annual ambulatory visits to physical therapists and home health visits by physical therapists (dependent variables) with explanatory variables consisting of patient characteristics available in both MEPS and the constructed population file. Future demand for nursing facilities utilized demographic and aging data to calculate the probability of nursing facility residency.
In contrast to ambulatory visits, MEPS does not indicate which patients admitted to a hospital receive care from physical therapists. Physical therapists work with a wide variety of patients admitted for reasons such as stroke, spine injury, joint conditions, and a host of other conditions where surgery or physical ailments require physical rehabilitation. To model this aspect of demand, we use projected rates of growth in demand for musculoskeletal-related hospitalizations. See Exhibit 21 in Supplementary Material 2 as a proxy for the growth in demand for hospitalizations requiring physical therapy. Logistic regression is used to model the correlation of patient characteristics and annual probability of hospitalization. Analysis of MEPS was supplemented by analysis of the 2021 National Inpatient Sample (NIS), with a large sample size to model the relationship between patient characteristics and length of hospitalization. The modeled estimation for the demand for physical therapists in hospitals grows by 18% between 2022 and 2037 under the baseline scenario—greater than the demand for hospital inpatient days overall, which is projected to grow by 16% over this period.
The current year staffing ratio is calculated by dividing the national volume of service use by the number of physical therapists employed in each care delivery setting. The simulated demand for ambulatory and home health physical therapist services is translated to demand for providers through national provider-to-visit ratios. For hospitals and nursing facilities, we use provider-to-day and provider-to-resident ratios, respectively. The staffing ratios are modeled as remaining constant across states and over time. Employment distribution information from the ACS in 2022 determines the number of individuals working in each setting. For complete details of the demand modeling process see the technical documentation.9
Demand Scenarios
The demand forecasts adjust current disease and other incidence rates and health care use based on population growth and demographic changes. Possible increases or decreases in the incidence of diseases, injuries, disorders, or other health-related causes of the demand for physical therapy are not included due to uncertainties about the size of these diverse changes and their net impact on demand. However, 1 alternative demand scenario considers the possibility of a future with reduced barriers to care use and delivery, in addition to population growth and demographic shifts, which are considered in both scenarios.
Baseline Scenario
This scenario extrapolates current health care use and delivery patterns to future populations, considering projected population growth and demographic shifts from 2022 to 2037. The US population is expected to grow by 8.0%, from 333.2 million to 359.2 million. The population under age 18 is projected to grow by less than 1%, while those aged 65 and older are expected to grow by 28.7%. As aging is associated with conditions requiring physical therapy, demand is projected to grow significantly. Disease prevalence and health risk factors are assumed to remain constant within each demographic group but increase in aggregate due to population growth and demographic changes.
Reduced Barriers Scenario
This scenario estimates demand if historically underserved populations accessed health care services at rates comparable to those with fewer barriers. MEPS analysis of health care use patterns (regression results published elsewhere9) finds that patient characteristics correlated with higher annual use of physical therapist services include older age, having medical insurance, being female, being non-Hispanic White, having a history of arthritis and select other chronic conditions, and living in a metropolitan area. To explore the potential physical therapist workforce implications from increasing access to care, the Reduced Barriers scenario models the implications if historically underserved populations had health care use patterns like populations not generally considered underserved, controlling for personal factors like disease prevalence and other personal characteristics. For this scenario, historically underserved populations are defined as individuals who are (1) uninsured; (2) living in a non-metropolitan area; or (3) part of a racial or ethnic minority group. These individuals are modeled as having health care use patterns similar to individuals who are (1) insured; (2) living in a metropolitan area; and (3) non-Hispanic White. This scenario highlights that national efforts to improve health equity could necessitate a larger physical therapist workforce, as demand for physical therapist services would rise significantly if these barriers were reduced.
APTA 2024 Physical Therapist Workforce Survey and Calculation of Starting Year Shortfall
The APTA 2024 Physical Therapist Workforce Survey of APTA members was used to assess the current practice capacity of physical therapists. We pilot-tested the initial draft of the survey with the APTA advisory groups. The final version was sent to 9801 APTA members on April 10, 2024 (~22% of eligible APTA members), with 3 follow-up emails, and the survey closed on May 9, 2024. There were 1759 completed responses (18% response rate).
The survey oversamples physical therapists working in inpatient rehabilitation facilities, home care, and skilled nursing or long-term care facilities. To better represent the general physical therapist workforce, the final dataset is weighted to correct for this oversampling. The characteristics of respondents were compared with the APTA member database, revealing no biases relative to age, sex, and race and ethnicity. See the supplements to this article for more information on the sample, survey questionnaire, and survey process.
To assess if the current supply of physical therapists is sufficient to meet demand, survey questions asked respondents’ perception of the local physical therapist supply and respondents’ assessment of their own capacity to meet the demand for their services.
To derive our current supply adequacy estimate, we analyzed responses to 6 survey questions pertaining to physical therapists’ median and ideal number of appointments per week and their current ability to provide care to those requesting physical therapist services. We categorized responses based on the ability of the respondent to provide care for all who requested appointments.
Equilibrium: These respondents (n = 343, 24% overall) indicated that they were able to provide care to all who requested appointments without extending work hours and could only have accommodated more patients by extending work hours. For modeling, we assume that supply adequacy (supply divided by demand) for these physical therapists is 100%.
Surplus calculation: Respondents (n = 268, 19% overall) reported that they were able to provide care to all who requested appointments and could have accommodated more appointments without extending work hours. The median number of weekly appointments these physical therapists reported is 25, and the median number of additional appointments they could have accommodated in a typical week is 5. We assume these physical therapists have a supply adequacy of 116.7% (ie, the 25 reported median number of appointments plus the 5 additional for a total of 30. The additional 5 appointments make up 16.7% of this group’s total capacity to provide care).
Shortage calculation 1: Respondents (n = 449, 32% overall) stated that they were able to provide care to all who requested appointments, but they had to extend work hours to accommodate demand. Their median number of weekly appointments is 31, and the median number of additional weekly appointments they could accommodate by extending work hours is 4. We assume these physical therapists have a supply adequacy of 85.2% relative to the demand for their services. (That is, the 31 median number of weekly appointments minus the 4 accommodated only by extending work hours equals 28. The 4 additional appointments make up 14.8% of total demand.)
Shortage calculation 2: Respondents (n = 363, 26% overall) indicated that they were unable to provide care to all who requested appointments. Their reported median number of weekly appointments is 35, with a median of 5 additional appointments that could not be accommodated. We assume these physical therapists have a supply adequacy of 85.8% (ie, the median 5 additional appointments divided by the median 35 appointments per week make up 14.2% of total demand).
The weighted mean of the 4 adequacy scenarios above is 94.8%, which implies supply is sufficient to meet 94.8% of demand of physical therapist services or a 5.2% gap between supply and demand for physical therapist services. Applying the weighted mean to the 2022 workforce estimate yields a national shortage of 5.2% or 12,070 FTE physical therapists. Rather than assume that national supply and demand are in equilibrium in the starting year, the assumption used by NCHWA in the absence of data on starting year imbalances (shortfall or surplus), we use these survey findings to reflect the estimate that starting year demand is ~12,070 FTE physical therapists greater than starting supply at the national level.
The supply and demand estimates do not reflect one-to-one direct treatment hours but instead account for the diverse roles and responsibilities within the physical therapy profession and reflect nonpatient care activities such as administration, teaching, and research. This FTE count reflects the current diversity of the physical therapist workforce (practice area, direct care provision, administration duties or position, education, industry, etc.). It recognizes that the diverse roles physical therapists play in health care are all needed to care for individuals seeking services and therefore reflects this number, not only the number in direct patient care positions.
Role of the Funding Source
The American Physical Therapy Association (APTA) funded a survey of physical therapists and new analyses resulting from introducing survey results and data on physical therapists’ locations and geographic mobility into the forecasts. The APTA Scientific and Practice Affairs Committee and a technical advisory group of APTA member physical therapists reviewed the study design, helped test the survey instrument, and provided insights on preliminary findings. Two APTA staff assisted with secondary data collection, implementation of the survey of APTA members, and writing. Researchers at GlobalData Plc. and the Center for Health Workforce Studies at the University of Albany-SUNY solely conducted all analyses and produced the findings. APTA staff and members did not seek or have approval over the findings, which were based on standard workforce forecasting methods.
RESULTS
Assessment of Current National Supply in Relation to Demand
With the initial 2022 starting supply from the FSBPT estimate of 233,890 FTEs, the supply of physical therapists is projected to grow by ~16.8% (39,180 FTEs) from 2022 to 2037 in the baseline scenario (Table 1). In the alternative scenarios, the projected increase ranges from a low of 9.7% (22,720 FTEs) to a high of 23.8% (55,620 FTEs).
National FTE Supply and Demand Forecast Scenarios for Physical Therapists, 2022–2037a
| Scenario | 2022 | 2027 | 2032 | 2037 |
|---|---|---|---|---|
| FTE supply (baseline) | 233,890 | 239,290 | 254,880 | 273,070 |
| Growth from 2022 | – | 5400 | 20,990 | 39,170 |
| FTE supply (later exits) | 233,890 | 246,060 | 262,860 | 281,260 |
| Growth from 2022 | – | 12,170 | 28,970 | 47,370 |
| FTE supply (earlier exits) | 233,890 | 231,930 | 246,800 | 264,760 |
| Growth from 2022 | – | −1960 | 12,910 | 30,870 |
| FTE supply (more entrants) | 233,890 | 245,250 | 266,330 | 289,520 |
| Growth from 2022 | – | 11,360 | 32,430 | 55,620 |
| FTE supply (fewer entrants) | 233,890 | 233,360 | 243,450 | 256,610 |
| Growth from 2022 | – | −540 | 9560 | 22,720 |
| FTE demand (baseline) | 245,960 | 258,990 | 271,520 | 282,210 |
| Growth from 2022 | – | 13,030 | 25,560 | 36,250 |
| FTE demand (reduced barriers) | 272,990 | 288,030 | 302,630 | 315,380 |
| Growth from 2022 baseline | 27,030 | 42,070 | 56,670 | 69,420 |
| Baseline scenario | ||||
| Supply–demand | −12,070 | −19,700 | −16,640 | −9120 |
| % Gap | −5.2% | −8.2% | −6.5% | −3.3% |
| Later exits scenario | ||||
| Supply–demand | −12,070 | −12,930 | −8660 | −950 |
| % Gap | −5.2% | −5.3% | −3.3% | −0.3% |
| Earlier exits scenario | ||||
| Supply–demand | −12,070 | −27,060 | −24,720 | −17,450 |
| % Gap | −5.2% | −11.7% | −10.0% | −6.6% |
| More graduates scenario | ||||
| Supply–demand | −12,070 | −13,740 | −5190 | 7310 |
| % Gap | −5.2% | −5.6% | −1.9% | 2.5% |
| Fewer graduates scenario | ||||
| Supply–demand | −12,070 | −25,630 | −28,070 | −25,600 |
| % Gap | −5.2% | −11.0% | −11.5% | −10.0% |
| Reduced barriers scenario | ||||
| Supply–demand | −39,100 | −48,740 | −47,750 | −42,310 |
| % Gap | −16.7% | −20.4% | −18.7% | −15.5% |
FTE = full-time equivalent.
Our analysis of supply modeling outputs reveals that attrition rates create the most pronounced effect during the first decade of the projection period (2022–2032), with annual attrition starting at 13,260 and decreasing to 8740 by the end of this period. After 2032, attrition rates stabilize, ranging from 8720 to 8530 annually through 2037. Concurrently, the model assumes an influx of ~12,240 new entrants to the profession each year. The analysis suggests that long-term physical therapist supply is more sensitive to changes in the number of new entrants than to moderate shifts in retirement patterns. Detailed modeling outputs and assumed annual rates of change are available in the supplement to this article.
In the baseline scenario, demand for physical therapists is driven by a growing and aging population. Under current utilization and delivery patterns, demand is projected to increase by 14.8% (36,250 FTEs) by 2037, surpassing the 8% projected growth rate of the US population. Demand, estimated at 245,960 FTEs in 2022, is expected to reach 282,210 FTEs by 2037.
Comparing supply to demand under the baseline scenario reveals a persistent shortfall, expected to decrease from 5.2% (12,070 FTEs) in 2022 to 3.3% (9120 FTEs) by 2037. Among the supply scenarios analyzed, only the “More Entrants” and “Later Exits” scenarios suggest a surplus or equilibrium of supply relative to baseline demand, with a small surplus emerging only at the end of the projection period (Figure 6).

Supply and Demand Projections for Physical Therapists, 2022–2037. FTE = full-time equivalent.
In the Reduced Barriers scenario, where all populations use health care services at the same rate as non-Hispanic White, insured populations in metropolitan areas, demand would increase by an additional 33,170 FTEs (12%) by 2037, beyond levels projected based on demographic changes and population growth alone. This scenario is intended to reflect the goal of achieving health equity by improving access to physical therapist services. Under this hypothetical scenario, there would have been a shortfall of 39,100 FTEs (16.7%) in 2022, with this shortfall projected to increase to 42,310 FTEs (15.5%) by 2037, which is substantially higher than the baseline gap.
The 2024 survey results indicate that when respondents were asked about perceived physical therapist shortages in their local area, the perceived deficits were most pronounced among those in private outpatient offices or group practices (69% responding that they perceive a shortage), followed by skilled nursing and long-term care facilities (65%). Physical therapists in acute care hospitals and academic institutions report the lowest rates of perceived shortage, at 41% and 44%, respectively. Geographic imbalances are also evident, with 57% of respondents indicating insufficient physical therapists in rural areas, 34% unsure, and only 9% indicating a sufficient supply in rural areas.
State Variation in Supply and Demand
Regional and state-level projections of demand for physical therapists account for differences in demographics and disease prevalence, as well as the starting-year estimated gap between supply and demand (Table 2). National and state-level supply is compared to demand for physical therapist services based on average utilization patterns by demographic profile, as outlined in the demand modeling section. In 2022, significant regional variation is observed in the supply–demand balance (Figure 7). The Northeast region has a supply of 11,980 FTEs beyond the level needed to provide a national average level of care to the profile of the population in this region, while the South region lacks a supply of 16,620 FTEs to meet an average level of care for the population in this region. The Midwest has 2970 FTEs more than would be needed for the anticipated utilization of the population in this region. In contrast, the West has 10,400 FTEs less than the number anticipated to deliver this level of care to the population profile in that region.
State FTE Supply and Demand Projections for Physical Therapists, 2022–2037a
| Region and State | Supply | Demand | FTE Gap | % Supply to Demand | ||||
|---|---|---|---|---|---|---|---|---|
| 2022 | 2037 | 2022 | 2037 | 2022 | 2037 | 2022 | 2037 | |
| Midwest total | 56,180 | 64,150 | 53,210 | 57,390 | 2970 | 6760 | 106% | 112% |
| Illinois | 10,750 | 9960 | 9220 | 9340 | 1530 | 620 | 117% | 107% |
| Indiana | 4660 | 6170 | 5280 | 5840 | −620 | 330 | 88% | 106% |
| Iowa | 2430 | 3650 | 2370 | 2580 | 60 | 1070 | 103% | 141% |
| Kansas | 2510 | 3210 | 2220 | 2760 | 290 | 450 | 113% | 116% |
| Michigan | 8640 | 6890 | 7890 | 8720 | 750 | −1830 | 110% | 79% |
| Minnesota | 4500 | 5780 | 4400 | 5020 | 100 | 760 | 102% | 115% |
| Missouri | 4500 | 6370 | 4900 | 5370 | −400 | 1000 | 92% | 119% |
| Nebraska | 1750 | 2890 | 1470 | 1670 | 280 | 1220 | 119% | 173% |
| North Dakota | 760 | 1670 | 610 | 680 | 150 | 990 | 125% | 246% |
| Ohio | 9390 | 10,870 | 9430 | 9430 | −40 | 1440 | 100% | 115% |
| South Dakota | 860 | 780 | 680 | 810 | 180 | −30 | 126% | 96% |
| Wisconsin | 5430 | 5910 | 4740 | 5170 | 690 | 740 | 115% | 114% |
| Northeast total | 56,960 | 55,610 | 44,980 | 48,680 | 11,980 | 6930 | 127% | 114% |
| Connecticut | 4110 | 3370 | 2950 | 2990 | 1160 | 380 | 139% | 113% |
| Maine | 1450 | 1230 | 1180 | 1430 | 270 | −200 | 123% | 86% |
| Massachusetts | 7290 | 7680 | 5660 | 6320 | 1630 | 1360 | 129% | 122% |
| New Hampshire | 1580 | 1540 | 1140 | 1400 | 440 | 140 | 139% | 110% |
| New Jersey | 9890 | 9910 | 7080 | 7790 | 2810 | 2120 | 140% | 127% |
| New York | 17,240 | 16,440 | 14,790 | 15,440 | 2450 | 1000 | 117% | 106% |
| Pennsylvania | 13,850 | 13,700 | 10,730 | 11,760 | 3120 | 1940 | 129% | 116% |
| Rhode Island | 900 | 1170 | 920 | 990 | −20 | 180 | 98% | 118% |
| Vermont | 650 | 570 | 530 | 560 | 120 | 10 | 123% | 102% |
| South total | 75,770 | 97,550 | 92,390 | 110,200 | −16,620 | −12,650 | 82% | 89% |
| Alabama | 2210 | 3020 | 3860 | 4210 | −1650 | −1190 | 57% | 72% |
| Arkansas | 2130 | 1980 | 2270 | 2470 | −140 | −490 | 94% | 80% |
| Delaware | 740 | 1290 | 830 | 980 | −90 | 310 | 89% | 132% |
| Dist. of Columbia | 230 | 410 | 430 | 470 | −200 | −60 | 53% | 87% |
| Florida | 12,860 | 17,770 | 17,090 | 21,420 | −4230 | −3650 | 75% | 83% |
| Georgia | 5690 | 7510 | 7530 | 8680 | −1840 | −1170 | 76% | 87% |
| Kentucky | 3010 | 3680 | 3530 | 3850 | −520 | −170 | 85% | 96% |
| Louisiana | 2920 | 3010 | 3440 | 3660 | −520 | −650 | 85% | 82% |
| Maryland | 4520 | 5000 | 4820 | 5660 | −300 | −660 | 94% | 88% |
| Mississippi | 1700 | 1910 | 2140 | 2320 | −440 | −410 | 79% | 82% |
| North Carolina | 6200 | 7510 | 7790 | 9780 | −1590 | −2270 | 80% | 77% |
| Oklahoma | 2030 | 2030 | 2840 | 3190 | −810 | −1160 | 71% | 64% |
| South Carolina | 2820 | 4580 | 3920 | 4650 | −1100 | −70 | 72% | 98% |
| Tennessee | 4460 | 5630 | 5260 | 6190 | −800 | −560 | 85% | 91% |
| Texas | 17,310 | 21,810 | 18,550 | 23,690 | −1240 | −1880 | 93% | 92% |
| Virginia | 5870 | 8790 | 6580 | 7540 | −710 | 1250 | 89% | 117% |
| West Virginia | 1070 | 1620 | 1510 | 1440 | −440 | 180 | 71% | 113% |
| West total | 44,980 | 55,760 | 55,380 | 65,920 | −10,400 | −10,160 | 81% | 85% |
| Alaska | 530 | 550 | 510 | 600 | 20 | −50 | 104% | 92% |
| Arizona | 3530 | 6020 | 5280 | 6840 | −1750 | −820 | 67% | 88% |
| California | 21,290 | 24,950 | 26,660 | 29,780 | −5370 | −4830 | 80% | 84% |
| Colorado | 4430 | 6270 | 4130 | 5190 | 300 | 1080 | 107% | 121% |
| Hawaii | 560 | 670 | 1010 | 1070 | −450 | −400 | 55% | 63% |
| Idaho | 1350 | 1490 | 1410 | 1760 | −60 | −270 | 96% | 85% |
| Montana | 1110 | 1220 | 860 | 1000 | 250 | 220 | 129% | 122% |
| Nevada | 1320 | 2020 | 2150 | 2540 | −830 | −520 | 61% | 80% |
| New Mexico | 1080 | 1210 | 1490 | 1640 | −410 | −430 | 72% | 74% |
| Oregon | 2640 | 2850 | 3400 | 4300 | −760 | −1450 | 78% | 66% |
| Utah | 2010 | 2150 | 2160 | 3020 | −150 | −870 | 93% | 71% |
| Washington | 4760 | 5920 | 5910 | 7770 | −1150 | −1850 | 81% | 76% |
| Wyoming | 370 | 440 | 410 | 430 | −40 | 10 | 90% | 102% |
| National total | 233,890 | 273,070 | 245,960 | 282,210 | −12,070 | −9120 | 95% | 97% |
FTE = full-time equivalent.
In the Northeast, states like Pennsylvania, New Jersey, and New York appear to have a greater supply of physical therapists than the number anticipated to deliver care to the population profile of those states. In contrast, the 3 largest states by population face the challenge of not having sufficient FTEs in their supply of physical therapists to deliver anticipated care to the population profiles of these states: California (5370 FTEs), Florida (4230 FTEs), and Texas (1240 FTEs).
Regional differences between supply and demand are expected to persist but lessen by 2037 (Figure 8). While less reliable than national or regional projections due to state-specific population and workforce migration patterns, state projections show that Virginia is projected to experience the largest gain in supply relative to demand, moving from a gap of 710 fewer FTEs supplied relative to demand in 2022 to a gap of 1250 more FTEs supplied relative to demand in 2037. Conversely, Michigan is projected to have the largest relative loss of supply relative to demand, shifting from a gap of 750 more FTEs supplied relative to demand in 2022 to a gap of 1830 FTEs fewer supplied relative to demand by 2037 (Table 2).
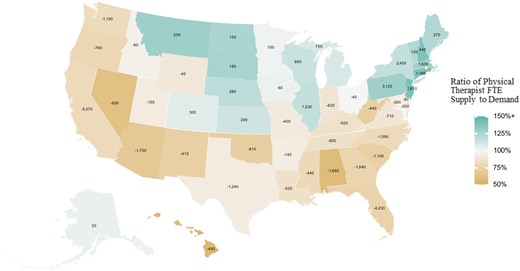
Physical Therapist FTE Supply Minus Demand and Ratio of Supply to Demand by State in 2022. Note: Demand is the number of physical therapists required to provide a national average level of care to a state’s estimated or forecasted population profile. State values are FTE supply minus demand; the percentage equals a ratio of FTE supply to demand. FTE = full-time equivalent.
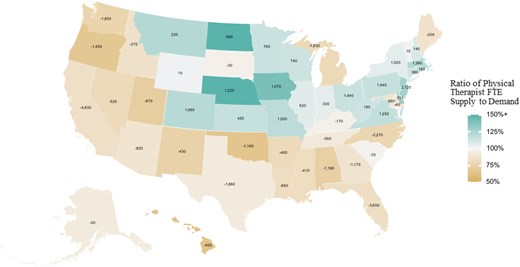
Physical Therapist FTE Supply Minus Demand and Ratio of Supply to Demand by State in 2037. Note: Demand is the number of physical therapists required to provide a national average level of care to a state’s estimated or forecasted population profile. State values are FTE supply minus demand; the percentage equals a ratio of FTE supply to demand. FTE = full-time equivalent.
DISCUSSION
This study estimates current and forecasts future physical therapist supply and demand in the US, revealing a significant shortfall that persists over the projection period. In 2022, we estimate a shortfall of 12,070 FTEs (5.2%), which is expected to grow to 19,700 FTEs (8.2%) by 2027 before decreasing to 9120 FTEs (3.3%) by 2037. Addressing this gap solely by increasing the number of US-trained DPT graduates would require an annual increase of 620 graduates (5.1%) and for that increase to have started in 2022. However, such an expansion in educational capacity is unlikely to be feasible in the short term due to the time required for program development and accreditation. Consequently, even greater increases would be needed in the midterm or long term to meet the growing demand and account for little to no increase in the first few years. Relying on retention efforts alone to close this gap may not be sufficient, particularly in the short to medium term. For instance, delaying workforce departures by 2 years, while helpful, would require significant changes in factors such as retirement decisions, which are often influenced by age and not easily shifted by retention strategies. As such, while retention efforts can contribute to mitigating the shortfall, they would need to be part of a broader, multifaceted approach to effectively address the growing demand for physical therapists.
State-level projections should be interpreted with caution. While Virginia may appear to have more physical therapists than required to provide the national average level of care, this does not necessarily indicate an excess of physical therapists. Instead, it could reflect a system where more physical therapists are employed outside the typical market of third-party payers or where higher numbers are necessary to manage actual work conditions, such as reduced patient loads or increased time for each patient. Michigan’s projected shortfall could exacerbate hiring challenges, indicating that the state might struggle to maintain adequate levels of care. These state-level projections are driven by demographics, workforce dynamics, and migration patterns, and should be revisited as new data becomes available. Policymakers should incorporate these estimates into a broader analysis, considering that the average national level of care may not account for the unique cultural, economic, or institutional arrangements that influence physical therapy needs across different states.
The Reduced Barriers scenario for the demand projections is intended to reflect the goal of achieving health equity by improving access to physical therapist services. The shortfall suggests that there is an insufficient number of physical therapists available to help address health disparities, which in turn limits access to care for individuals in need of rehabilitation services. This lack of access can exacerbate existing inequalities in health outcomes, as those in underserved or marginalized communities may struggle to receive timely and adequate care. Expanding the availability of physical therapists could help improve access and address some of these disparities.
At the state level, some states have a physical therapist workforce that exceeds the number needed to provide a national average level of care, while others fall below the threshold required to meet that standard. Furthermore, substantial geographic variation within states exists in the supply-to-demand ratio, even for states where supply appears sufficient for demand. This disparity is particularly pronounced in non-metropolitan areas. While our projections offer valuable insights at the state level, they do not capture the nuanced differences in supply and demand within local markets, where access to care can vary substantially. This underscores the importance of implementing targeted interventions to address these imbalances and conducting further research to better understand geographic variations in health care labor markets.
Future research and the development of data sources that underpin workforce forecasting should consider several topics that will improve data-driven decisions about delivering physical therapist services. For instance, the lack of geographic and other data on physical therapist assistants prevented including forecast scenarios for the impact of more or fewer physical therapist assistants in the workforce. First, a comprehensive, standardized dataset on the physical therapist workforce—including physical therapist assistants—should be established. Second, the field needs additional research into several dynamics that are difficult to model or predict, including worker migration patterns, attrition trends, and how physical therapy assistants may alleviate shortages or otherwise meet growing demand. Third, forecasts will need updating if substantial changes in policy, technology, or health care use patterns emerge. Fourth, improved data on the supply of physical therapist assistants in each state and a better understanding of how physical therapy assistants contribute to enhanced patient access and cost-effective care would improve modeling efforts in future analyses. Recent federal projections suggest that physical therapist assistant supply and demand will be in equilibrium by 2037 (101% adequacy nationally for physical therapist assistants versus 97% for physical therapists).3 The Physician Fee Schedule Rule for 2025, taking effect January 1, 2025, will change supervision requirements for physical and occupational therapist assistants from “direct” to “general.” This means that a physical therapist who employs a physical therapist assistant must be immediately reachable by telephone, via video or in person but does not have to be physically present while care is administered. This may allow for improved utilization of physical therapist assistants and greater flexibility in care delivery into areas of the country where physical therapist supply is lacking. This provision is, of course, still subject to state law.23 Finally, while we collected data on providers’ intentions regarding retirement or leaving the profession, more needs to be known about providers who return to the workforce after leaving.
Research advances in all the above areas will allow for a better understanding of disparities in care and more accurate workforce forecasting. Of course, as the global interest in health care workforce planning continues to grow, aligning efforts with international research trends and best practices is vital. By advocating for better data collection, research, and workforce planning, the physical therapy profession can lead the way in innovative solutions that meet the evolving needs of patients and the health care system.
Limitations
This study has several strengths, including using current data on physical therapist supply and entrants and original survey data on retirement intentions, hours worked, workload, and self-assessments of practice capacity to estimate the current shortfall of physical therapists. The demand projections are grounded in the most recent data on population trends and physical therapist service use patterns.
However, there are limitations to the demand modeling. Some conditions treated by physical therapists (eg, back and neck pain, fibromyalgia, chronic pain conditions, muscular dystrophy) are unavailable in the databases used to construct the population files. This might lead to omitted variable bias in our prediction equations. The extent of over or under-estimation from this exclusion cannot be precisely quantified. These factors may be correlated with patient characteristics such as demographics, chronic conditions like cardiovascular disease, health risk factors like obesity, or Medicaid status, and the regression coefficients in the prediction equations may partially capture this increased demand. Otherwise, the increased demand associated with these conditions is modeled to grow at the overall rate of population growth. Another demand modeling limitation is that hospital discharge data does not indicate which patients were seen by a physical therapist during their hospital stay. Approximately 1 in 4 physical therapists works in a hospital setting, and for this setting the rate of growth in demand is uncertain. Total hospital inpatient days are projected to grow by 16% between 2022 and 2025. When we focus on patients admitted with musculoskeletal disorders, the projected growth rate is 18% (which we use as a proxy for the rate of demand growth for physical therapists). If we used as a proxy for demand growth the projected increase in inpatient days for all patients admitted for musculoskeletal disorders, neurological conditions (including stroke), and cardiovascular conditions (including heart attack), the projected growth rate is 24%. If we used 24% growth rate for hospital-based physical therapist services rather than the 18% growth rate used, then total physical therapist demand would have been ~1.2% (3390 FTEs) higher than our baseline demand projection in 2037.
A limitation of the supply modeling is the lack of data with complete demographic information at the individual level. To address this, we sampled from the APTA member database to match the licensed-resident-by-state totals provided by FSBPT. However, the extent to which the demographic characteristics of the broader physical therapist workforce differ from those of APTA members is unknown.
There are also limitations regarding the available data on practice locations within the physical therapist workforce. While we used estimates of licensed resident totals in each state provided by the FSBPT, the lack of precise practice location data may lead to imprecision in supply estimates, particularly in contiguous states or those that share metropolitan areas. This limitation also affects the certainty of our state-level physical therapist migration estimates for future projections. Practice location data limitations place detailed analysis of workforce distribution at the substate level beyond the scope of this project. Improved data collection coordinated with licensure of the physical therapy workforce at the state level would improve capacity to provide substate analysis of supply in relation to demand. According to the State Health Workforce Data Collection Inventory published by the Health Workforce Technical Assistance Center at the University of Albany, just 18 states collect information about their physical therapist workforce beyond the bare minimum to establish identity for licensure in the state.24
Additionally, data limitations restrict our ability to analyze certain scenarios of interest, such as the impact of artificial intelligence and technological advances on productivity and its potential effects on supply and demand. Likewise, greater use of telerehabilitation, wearable devices, virtual reality or augmented reality, robotics and exoskeletons, mobile health apps, and medical advances all could affect demand for physical therapist services or provider productivity. Unforeseen changes in economic conditions and health care policy could affect how health care services are utilized or delivered in the future.
Data limitations also prevented modeling supply by clinical specialization as this information was not available in the APTA member database with associated physical therapist demographic information. While the 2024 survey asks about a physical therapists’ primary clinical focus and demographic information, 61% (n = 1075) of respondents fell under 5 of the 14 options presented, with 39% (n = 684) split amongst the remaining specialization options presented. Due to small sample sizes for various specialties and a lack of alternative data at the individual level, physical therapist supply was modeled at the general level.
Finally, the 2024 survey sampling frame consisted of APTA members, and it is unclear how their characteristics or workplace conditions compare with those of the broader physical therapist workforce. To reduce potential bias, we oversampled individuals working in inpatient rehabilitation facilities, home care, and skilled nursing facilities, as physical therapists in these settings are typically underrepresented in the APTA membership.
Additional limitations about microsimulation modeling and modeling in general are described elsewhere.25
CONCLUSIONS
This research estimates a significant national shortfall of 12,070 physical therapist FTEs (5.2%) in 2022, a gap largely expected to persist through 2037. This shortfall, coupled with ongoing geographic imbalances in supply, suggests that without strategic interventions—such as increasing the number of physical therapist graduates or implementing policies to improve retention—patients in many areas may continue to face challenges in accessing timely or sufficient care. In addition, collecting anonymized individual-level physical therapist data during state licensure and making it available to researchers would enhance forecasting, planning, and decision-making for policymakers, higher education programs, and professionals. Addressing these issues is critical to ensuring that the growing demand for physical therapist services is met, particularly as the population ages and the prevalence of conditions requiring physical therapy increases.
ACKNOWLEDGMENTS
The following individuals with the Center for Health Workforce Studies at the University at Albany, SUNY assisted with administering the survey: Gaetano Forte, MS; Jinman Pang, PhD; and Peter (Sage) Shirey, MA.
The Scientific and Practice Affairs Committee of APTA and a technical advisory group of APTA member physical therapists reviewed the study design, helped test the survey instrument, and provided feedback and insights on preliminary study findings.
We thank Lois Douthitt, Anita Bemis-Dougherty, and Jennifer Stevens-Lapsley for their comments on a draft.
A full list of names with degrees of the advisory committee members is available in Supplementary Material 4.
CRediT – CONTRIBUTOR ROLES
Patrick Zarek (Data curation [equal], Formal analysis [equal], Writing—original draft [equal], Writing—review & editing [equal]), Clark Ruttinger (Project administration [equal], Writing—original draft [equal], Writing—review & editing [equal]), David Armstrong (Data curation [equal], Project administration [lead], Writing—original draft [equal], Writing—review & editing [equal]), Ritashree Chakrabarti (Formal analysis [equal], Writing—original draft [equal], Writing—review & editing [equal]), Douglas Hess (Conceptualization [equal], Funding acquisition [equal], Supervision [equal], Writing—review & editing [equal]), Tara Jo Manal (Conceptualization [equal], Funding acquisition [equal], Supervision [equal], Writing—review & editing [equal]), Timothy Dall (Methodology [equal], Supervision [equal], Writing—original draft [equal], Writing—review & editing [equal]).
FUNDING
The American Physical Therapy Association (APTA) funded this study. The APTA Scientific and Practice Affairs Committee and a technical advisory group of APTA member physical therapists reviewed the study design, helped test the survey instrument, and provided insights on preliminary findings. Two APTA staff assisted with secondary data collection, implementation of the survey of APTA members, and writing. Researchers at GlobalData Plc. and the Center for Health Workforce Studies at the University of Albany-SUNY solely conducted all analyses and produced the findings. APTA staff and members did not seek or have approval over the findings, which were based on standard workforce forecasting methods.
ETHICS APPROVAL
Under guidelines provided by the University of Albany’s Institutional Review Board (IRB), the study survey did not require IRB review.
DISCLOSURES
The authors completed the ICMJE Form for Disclosure of Potential Conflicts of Interest and reported no conflicts of interest.
D. Hess and T. Manal are employees of the American Physical Therapy Association. D. Hess’ and T. Manal’s views are their own and do not necessarily represent those of APTA.
DATA AVAILABILITY
Data are not publicly available due to privacy and organizational restrictions.
References
Centers for Disease Control and Prevention.

Comments