


ABSTRACT
The pattern and impact of burnout among the medical staff are not yet well defined. However, the consequences of burnout are not limited to the healthcare providers but also may affect their family, colleagues and patients in a negative manner. We aimed to assess the characteristics and predictors of burnout among health professionals at two large tertiary hospitals.
We conducted a cross-sectional study during the period from July 2018 to 31 December 2018. Data, via Maslach Burnout Inventory survey, were collected from physicians and other healthcare workers in two hospitals.
A total of 624 responses to questionnaires were analysed. Half of the respondents were physicians, and men constituted the majority. About 10% (95% CI, 7.8 to 12.5) of the respondents satisfied the criteria of burnout. Emotional exhaustion (EE) was observed in 45.7%, depersonalisation (DP) in 26.9% and personal accomplishment (PA) in 41.2% of the respondents. There was a positive correlation between EE and DP (r=0.627, p=0.001), and a weak negative correlation between DP and PA (r=−0.195, p=0.001). Young age, less experience, trauma surgery, lack of habits and getting depressed ≥1 time/week were predictors of burnout.
Burnout affects one-tenth of the health professionals in the tertiary hospitals in Qatar. Physicians are more likely to have higher DP and lower PA, whereas nurses prone to have higher EE. In this study, no gender discrepancy is appreciated and the junior medical staff is at a higher risk of burnout.
INTRODUCTION
The concept of burnout in the healthcare sector has emerged in the late 1960s; since then, burnout is considered as a serious problem among healthcare professionals.1 Previous studies revealed that the prevalence of burnout among healthcare providers is rising compared to other professions.1–4 However, the pattern and impact of this phenomenon in the medical staff are not yet well defined. Moreover, the consequences of burnout are not limited to healthcare providers, but can extend also to affect their family, colleagues and patients in a negative manner. The potential influence of burnout on patient care and professionalism has been reported in several studies.2–4 In addition to the concerns related to health and safety of the affected medical staff, few studies reported a reduction in work productivity due to burnout.5–8 Partial symptoms of burnout have also been reported worldwide. While the overall prevalence of burnout was estimated to range from 2.6% to 69.9%, emotional exhaustion (EE) was observed in 8.7–63.2%, depersonalisation (DP) in 8.5–52% and low personal accomplishment (PA) in 4.4–73.3%.8–34 Burnout prevalence varies among different subgroups of physicians (eg, general practitioners, anaesthetists, senior doctors and dentists).
Published data on burnout among health professionals are not without limitations. An important limitation is the lack of comparability due to the use of different tools for burnout evaluation. Furthermore, the lack of full understanding of the major differences in burnout prevalences observed among various types of hospitals (rural compared to city hospitals), medical subspecialties, continents and countries constitutes a major limitation. Understanding and addressing high levels of burnout in doctors and nurses are likely to provide opportunities for improving the well-being of this workforce as well as the quality of patient care.
Burnout among healthcare providers has not been studied in Qatar at a tertiary level; therefore, we sought to conduct this study. The primary objective of the present study is to assess the characteristics and predictors of burnout among health professionals at two large tertiary hospitals and to estimate the prevalence of burnout among physicians and nurses/paramedics.
MATERIALS AND METHODS
Study design and sample
A prospective, cross-sectional study was conducted at two tertiary hospitals (Hamad General Hospital and Heart Hospital) of the Hamad Medical Corporation (governmental sector) during the period from July 1, 2018 to December 31, 2018.
Burnout syndrome was defined as a state of physical, emotional and mental exhaustion that results from prolonged exposure to job stressors or work situations that are emotionally demanding.35 Burnout was considered as high EE (score 27 or over), high DP (score 13 or above) and low PA (score 0–31). We calculated a total sample size of around 624 with a prevalence of 7.3% and an allowable error of 2.0%.33 A stratified sampling technique was used to collect samples from healthcare professionals at the department of surgery, department of medicine, department of emergency medicine, trauma section, and radiology department at Hamad General Hospital, in addition to the Heart Hospital. We included physicians, nurses and paramedics who were working in the institution for a period of 1 year at least with a minimum of a 30-hour/week workload. Incomplete questionnaires were excluded. Participation in the study was voluntary and anonymous.
Questionnaire design
The questionnaire had two parts, data collection sheet and the Maslach Burnout Inventory (MBI) Human Services Survey (HSS) version.13 The MBI is a validated and copyrighted instrument. A purchased licence is required for each use (reproduction/administration).13 Maslach and colleagues identified three scales that can determine burnout syndrome: DP, EE and a sense of low PA.35 The MBI instrument contains 22 items that measure the cumulative effects of work-related pressure in three subscales. Figure 1 depicts the criteria to be met for three examined dimensions of burnout: EE (nine items), DP (five items) and PA (eight items).
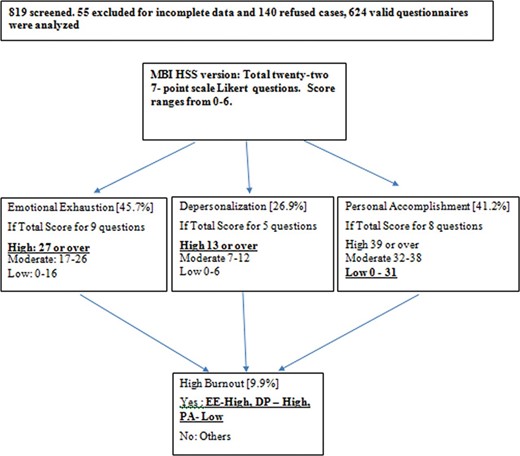
Maslach Burnout Inventory (MBI) Human Services Survey (HSS) version criteria for three examined dimensions of burnout.
Data collection sheet included information regarding sociodemographic details (age, gender, marital status, children, specialty and designation), debt burden, work experience and shift, job promotion, habits (reading, music, others), excursions and physical activity.
The study protocol was approved by the Medical Research Center (MRC) Ethical Committee at Hamad Medical Corporation (MRC-01-18-133).
Statistical analysis
Categorical variables were described by ratios and proportions. Numerical variables were described through mean, median, SD and range. The significance level (α) was set at 5%, with a significance level of two-sided p<0.05 and 95% CIs. Differences in proportions were tested by Pearson’s test (χ²). Pearson correlation was used to explore the relationships between EE, DP and PA. The questionnaire’s reliability was assessed by Cronbach’s α for each dimension. A comparative analysis was made according to gender (two groups) and age (three groups; <45 years, 45–55 and >55 years).
The differences in the means of numerical variables were tested using the analysis of variance (ANOVA) and t-test. To test the independent effect of the sociodemographic variables on outcomes for burnout for each domain, univariate and multiple logistical regression models were used with stepwise selection criterion variables. All data analysis was carried out using SPSSversion 18 (SPSS, USA).
RESULTS
We approached 819 healthcare professionals, of them 624 (76%) responded: 55 questionnaires were excluded because of incomplete data and 140 declined. Half of the respondents were physicians and the majority were men. Residents constituted 52.6% of the physician category. Only one-third of respondents received job promotion (ie, a higher rank) during their employment period at Hamad Medical Corporation. Overall, the median exercise duration per week of respondents was 2 hours with range of 0.3–30 hours. EE was observed in 45.7%, DP in 26.9% and PA in 41.2% of the respondents.
Table 1 shows demographics and burnout characteristics. The questionnaire’s reliability was assessed by Cronbach’s α for each dimension, with resulting scores of 0.900, 0.734 and 0.807 for EE, DP and PA, respectively, indicating that items within the three scales were well correlated.
Participant demographics and burnout characteristics
| Variable | Value | Variable | Value |
| Age, years | 36.6±SD 8.7 | Running | 15.1 (12.5–18.1) |
| Sex | Habits | 88.8 (86.1–91) | |
| Men | 55.9 (52–59.8) | Music habits | 25.3 (22.1–28.9) |
| Women | 44.1 (40.2–48) | Reading | 40.7 (36.9–44.6) |
| Marital status | Depressed at work | ||
| Unmarried | 23 (19.9–26.5) | Never | 11.6 (9.3–14.5) |
| Married | 76.2 (72.7–79.4) | A few times a year or less | 17.8 (14.9–21.2) |
| Divorced | 0.8 (0.3–1.9) | Once a month or less | 14.5 (11.8–17.6) |
| Having children | 65.6 (61.8–69.2) | A few times a month | 20.5 (17.3–24) |
| Debt burden | 40 (35.9–44.2) | Once a week | 9.2 (7.1–11.8) |
| Designation | A few times a week | 20.6 (17.5–24.2) | |
| Staff nurse | 48.1 (44.2–52) | Every day | 5.8 (4.2–8.1) |
| Technologist | 1.9 (1.1–3.3) | Tour | |
| Resident | 26.3 (23–30) | Up to 6 months | 24.7 (20.9–29) |
| Specialist | 6.1 (4.5–8.3) | 7 months to 1 year | 67.9 (63.4–72.1) |
| Associate consultant | 4 (2.7–5.9) | 1 year to 3 years | 7.4 (5.3–10.3) |
| Consultant | 9 (7–11.5) | Emotional exhaustion | |
| Senior consultant | 4.7 (3.3–6.6) | High | 45.7 (41.8–49.6) |
| Department | Moderate | 26 (22.7–29.5) | |
| Trauma surgery | 11.1 (8.8–13.8) | Low | 28.4 (24.9–32) |
| Surgery | 29.8 (26.4–33.5) | Depersonalisation | |
| Emergency | 7.2 (5.4–9.5) | High | 26.9 (23.6–30.5) |
| Medicine | 30.9 (27.4–34.7) | Moderate | 29.0 (25.6–32.7) |
| Radiology | 4.5 (3.1–6.4) | Low | 44.1 (40.2–48) |
| Heart Hospital | 16.5 (13.8–19.6) | Personal accomplishment | |
| Work shift | High | 41.2 (37.4–45.1) | |
| Day | 33.3 (29.7–37.2) | Moderate | 26.9 (23.6–30.5) |
| Day/night | 64.8 (60.9–68.6) | Low | 31.9 (28.4–35.7) |
| Night | 1.9 (1.0–3.3) | High burnout | |
| Work experience, years | 9.5±SD 7.5 | Yes | 9.9 (7.8–12.5) |
| Job promotion | 34.8 (31–39.4) | No | 90.1 (87.5–92.2) |
| Extra work activities | 57.6 (53.6–61.4) | ||
| Workload per hours | 48.6±SD 12.2 | ||
| Physical exercise | 69.6 (65.8–73) | ||
| Exercise duration in hours | 4±SD 8.6 | ||
| Exercise frequency | 3.0±SD 1.9 | ||
| Gym | 12.3 (10.0–15.2) |
Data presented as mean±SD or mean and (CIs).
Socio-demographic wise comparison of burnout
| High burnout | High burnout | ||||||
| Variables | No (n=562) | Yes (n=62) | P value | Variables | No (n=562) | Yes (n=62) | P value |
| Age (in years) | 36.9±SD 8.9 | 33±SD 6.3 | 0.01 | Tour (in months) | 0.30 | ||
| Gender | 0.20 | Up to 6 months | 99(92) | 8(8) | |||
| Women | 253(92) | 22(8) | 7 months to 1 year | 269(92) | 25(9) | ||
| Men | 309(89) | 40(11.5) | 1 year to 3 years | 27(84) | 5(16) | ||
| Marital status | 0.06 | Work shift | 0.70 | ||||
| Unmarried | 122(85) | 21(15) | Day | 181(91) | 17(9) | ||
| Married | 435(92) | 39(8.2) | Both | 343(89) | 42(11) | ||
| Divorced | 4(80) | 21(15) | Night | 10(91) | 1(9) | ||
| Having children | 374(92) | 32(8) | 0.20 | Department | 0.20 | ||
| Physicians | 275(88) | 37(12) | 0.10 | Emergency | 40(89) | 5(11) | |
| Debt burden | 191(89.3) | 23(11) | 0.50 | Heart Hospital | 92(89) | 11(11) | |
| Reading | 236(93) | 18(7.1) | 0.20 | Medicine | 171(89) | 22(11) | |
| Music | 141(89) | 17(11) | 0.80 | Radiology | 26(93) | 2(7) | |
| No habits | 58(83) | 12(17.1) | 0.01 | Surgery | 175 (94) | 11(6) | |
| Physical exercise | 390(90) | 44(10) | 0.80 | Trauma surgery | 58(84) | 11(16) | |
| Duration of physical exercise in hours | 4.0±SD 8.9 | 3.6±SD 3.3 | 0.80 | Designation | 0.01 | ||
| Frequency of physical exercise per week | 2.9±SD 1.9 | 3.3±SD 1.7 | 0.20 | Assoc. consultant | 23(92) | 2(8) | |
| Gym | 67(87) | 10(13) | 0.30 | Consultant | 55(98) | 1(2) | |
| Running | 82(87) | 12(13) | 0.30 | Resident | 138(84) | 26(16) | |
| Walking | 167(90) | 18(10) | 1.00 | Senior consultant | 28(97) | 1(3) | |
| Promotion | 199(92.6) | 16(7.4) | 0.30 | Specialist | 31(82) | 7(18) | |
| Work experience (in years) | 9.8±SD 7.70 | 6.62±SD 532 | 0.01 | Staff nurse | 276(92) | 24(8) | |
| Workload (in hours) | 48.3±SD 11.9 | 51.16±SD 14.2 | 0.01 | Technologist | 11(92) | 1(8) | |
Data presented as mean±SD, and number and (percentage).
A higher rate of EE was observed in nurses compared to physicians, while a higher rate of DP was observed in the latter (table 2 and online supplementary table 1).
Debt burden, not getting a job promotion and increased workload were the main reasons for EE. Exercise duration had a positive effect on reducing EE. Debt burden and increased workload were the two main reasons for DP. Exercise duration also had a positive effect on reducing DP. Lower rate PA was observed in physicians compared to nurses. Debt burden and increased workload were the two main reasons for low PA. Exercise duration had a positive effect on reducing low PA (table 2). Higher rates of burnout were observed in association with certain variables and groups such as men, specialists, physicians, divorced, debt burden, trauma surgery department, staff who did not get a promotion and staff who are working in shifts (day/night). Table 3 shows the differences between men and women in terms of burnout components.
Gender and burnout
| Variables | Men (n=349) | Women (n=275) | P value |
| Age, years | 37.2±SD 9.8 | 35.8±SD 7.1 | 0.04 |
| Emotional exhaustion | 0.40 | ||
| High | 43.6 (38.5–48.8) | 48.4 (42.3–54.4) | |
| Moderate | 27.8 (23.4–32.7) | 23.6 (18.7–29.1) | |
| Low | 28.7 (24.2–33.6) | 28 (22.8–33.7) | |
| Depersonalisation | 0.08 | ||
| High | 28.9 (24.4–33.9) | 48.4 (42.3–54.4) | |
| Moderate | 30.9 (26.3–35.9) | 23.6 (18.7–29.1) | |
| Low | 40.1 (35.1–45.3) | 28 (22.8–33.7) | |
| Personal accomplishment | 0.17 | ||
| High | 38.9 (34–44.2) | 44 (38.1–50.1) | |
| Moderate | 26.1 (21.8–30.9) | 28 (22.8–33.7) | |
| Low | 34.9 (30.1–40.1) | 28 (22.8–33.7) | |
| High burnout | 0.15 | ||
| Yes | 11.5 (7.8–12.5) | 8 (5.1–11.9) | |
| No | 88.5 (84.8–91.5) | 92 (88.1–94.9) |
Data presented as mean±SD or mean and (CIs).
Logistic regression demonstrated that young age, working in trauma surgery, being resident/specialist, less work experience (years), unmarried, having children, not having any habits (see definition above) and getting depressed ≥1 time/week were independent predictors of high burnout (table 4).
Multivariate logistic regression analysis
| Variable | OR (95% CI) | P value |
| Age | 0.935 (0.898–0.973) | 0.001 |
| Male gender | 1.49 (0.86–2.57) | 0.15 |
| Department | ||
| Radiology | 1.2 (0.26–5.8) | 0.8 |
| Heart Hospital | 1.9 (0.78–4.6) | 0.15 |
| Emergency | 1.99 (0.65–6.04) | 0.23 |
| Medicine | 2.05 (0.96–4.4) | 0.06 |
| Trauma surgery | 3.02 (1.24–7.33) | 0.02 |
| Designation | ||
| Senior consultant | 1.96 (0.12–32.59) | 0.638 |
| Associate consultant | 4.78 (0.41–55.38) | 0.210 |
| Specialist | 12.42 (1.46–105.67) | 0.021 |
| Resident/Fellow | 10.36 (1.37–78.24) | 0.023 |
| Staff nurse | 4.78 (0.63–36.10) | 0.129 |
| Technologist | 5 (0.29–86.13) | 0.268 |
| Physician | 1.545 (0.906–2.63) | 0.11 |
| Work experience (in years) | 0.929 (0.887–0.973) | 0.002 |
| Workload (per hours) | 1.017 (0.998–1.036) | 0.085 |
| Work shift | ||
| Day/night | 1.3 (0.72–2.355) | 0.38 |
| Night | 1.065 (0.128–8.83) | 0.954 |
| Debt burden | 1.26 (0.705–2.253) | 0.435 |
| Marital status | ||
| Unmarried | 1.92 (1.09–3.39) | 0.024 |
| Divorced | 2.79 (0.304–25.56) | 0.364 |
| Having children | 0.543 (0.319–0.925) | 0.025 |
| Reading | 0.565 (0.318–1.003) | 0.051 |
| Music | 1.128 (0.625–2.034) | 0.689 |
| No habits | 2.086 (1.050–4.142) | 0.036 |
| Job promotion | 0.640 (0.352–1.161) | 0.142 |
| Physical exercise | 1.078 (0.605–1.920) | 0.798 |
| Gym | 1.421 (0.689–2.928) | 0.341 |
| Running | 1.405 (0.717–2.751) | 0.322 |
| Walking | 0.968 (0.543–1.724) | 0.911 |
| Frequency | 1.097 (0.952–1.263) | 0.201 |
| Duration | 0.995 (0.952–1.039) | 0.810 |
| Promotion | 0.640 (0.352–1.161) | 0.142 |
| Depressed at work | ||
| A few times a year or less | 1.990 (0.203–19.547) | 0.555 |
| Once a month or less | 5.132 (0.602–43.735) | 0.135 |
| A few times a month | 6.810 (0.859–53.983) | 0.069 |
| Once a week | 13.605 (1.663–111.276) | 0.015 |
| A few times a week | 10.297 (1.333–79.522) | 0.025 |
| Every day | 28.261 (3.427–233.082) | 0.002 |
| Tour (in months) | ||
| ≥12 | 1.150 (0.502–2.634) | 0.741 |
| ≥50 | 2.380 (0.718–7.885) | 0.156 |
There was a significant positive correlation between EE and DP (r=0.627, p=0.0001) and a weak negative correlation between DP and PA (r=−0.195, p=0.001). There was a weak negative correlation (statistically not significant) between EE and PA (r=0.073, p=0.07). Figure 2 shows the effect of age and years of experience on the three elements of burnout. EE was greater in young (<45 years) in comparison to other age groups (48 (44.4–52.9) vs 39.9 (21.1–42.1) and 28.6 (11.3–52.2)) respectively. DP was greater in young age 30.3 (26.6–34.3) in comparison to other age groups (9.9 (4.4–18.5) and 9.5 (1.2–30.4)), respectively. PA was comparable among all groups.
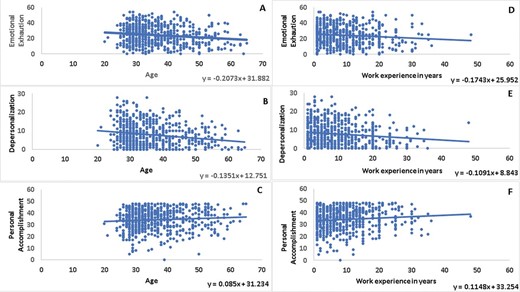
The effect of age and years of experience on the three elements of burnout.
DISCUSSION
Assessment and prevention of burnout among healthcare professionals are important for the medical staff well-being and delivery of optimum patient care. There is a need for burnout theory among healthcare professionals capable of explaining burnout and its predictors. In order to be useful and feasible, this theory should be operationalised in a tool that will be easy to use for both researchers and clinicians.
In this study, data confirm that burnout is an ultimate concern among young and old doctors and nurses in two tertiary hospitals in Qatar. In any stratum, one-tenth of the respondents fulfilled the criteria of burnout. In addition, doctors scored higher in DP and lower in PA compared to nurses/paramedics while the latter scored higher for EE. Burnout was only deemed to be present if a respondent had high EE, high DP and low PA. A higher figure of burnout has been reported in USA and New Zealand.5 36 Young age, less work experience, junior staff, trauma surgery specialty, lack of habits and getting depressed ≥1 time/week were predictors of burnout in our cohort.
A recent systematic review including studies from two adjacent countries to Qatar (Bahrain and Saudi Arabia) among healthcare professionals reported a moderate to high burnout.35 There were wide-ranging prevalence estimates of burnout among healthcare professionals in the Arab countries.35 The high burnout in Saudi Arabia in terms of EE (29.5–54%), depersonalisation (DP) (15.7–48.6%) and PA (17–71.5%) showed a similar variability across physicians and nurses.35 There were two relevant prior studies in 2011 from Qatar and Kuwait.35 The Kuwait study did not provide a prevalence of burnout, whereas the study from Qatar did not use the standardised MBI to assess burnout (it used the Astudillo and Mendinueta questionnaire). Both of the two studies were conducted in the primary healthcare sector rather than tertiary hospitals. In the Qatar study, 12.6% were classified as burnout with a higher prevalence among women and Qatari nationals compared to men and expatriates, respectively.35 Our findings showed that age, subspecialty, job ranking, work experience, social history, habits and frequency of depression were the predictors of burnout. Elbarazi et al 35 addressed the need to reduce work stressors by improving the workplace environment and developing culturally relevant resilience programmes in the Arab countries.
The Agency of healthcare Research and Quality (AHRQ) has funded the Minimizing Error, Maximizing Outcome (MEMO) project and found that more than half of primary care physicians reported feeling stressed because of work conditions such as time pressure, chaotic environments, low control over work pace and unfavourable organisational culture in USA.37 In agreement with our study, Siu et al reported high burnout rates among young physicians who were still undergoing or had just finished higher specialist training.38
There are plausible reasons to explain increasing burnout among young physicians. Physicians at personal development stage are usually experiencing changes in their social roles. Most of them are newly married or have a new family life. These personal and psychosocial changes are often coupled with the need to sit for professional examinations and strike a balance between professional training, clinical duties, career advancement and family life. Other forms of stress encountered by young physicians include working to fulfil the higher expectation of their senior physicians and providing training or supervision to juniors. Some might need to participate in research, audits or administrative work. Among 7409 residents studied, mistreatment was more evident among general surgery residents, particularly women, and was associated with burnout and suicidal thoughts.39 Our study did not show significant differences between men and women in terms of DP, EE, PA and overall burnout.
In this study, high burnout rate was related to workload and work shifts. This is consistent with findings from previous studies in which physicians with a higher number of shifts had significantly higher EE and DP scores and lower satisfaction scores.40 Online supplementary table 2 shows the country-wise prevalence of burnout, EE, DP, and low PA in different studies.9–30 In a tertiary children’s hospital, with a 22-bed pediatric intensive care unit (PICU)/neonatal Intensive care unit (ICU), a 17-bed cardiac ICU and a teaching hospital with 3-adult ICUs, Colville et al 41 found that the prevalence of burnout was 37% whereas the prevalence of clinically significant post-traumatic stress symptoms was 13%. The authors noted a degree of overlap between burnout and other measures of distress, most notably for anxiety (OR, 10.56).41
West et al suggested that individual-level cognitive and behavioural interventions can be used as an effective method to reduce burnout among the physicians and nurses.42 Our findings highlighted that hobbies, physical exercise and excursion have a positive impact to reduce the burnout among healthcare professionals. Sociodemographic variables had some relationship with burnout among healthcare professionals; this warrants further research.
Strengths and limitations
The strength of this stratified sampling study relates to the participation of two tertiary hospitals and different subspecialties. In contrast to other studies which reported levels of burnout in a single institution or within one specialty across different places of work, this study provides the levels of burnout experienced at a single point of time by physicians and nurses working at Hamad Medical Corporation. Our study has a large sample size and high internal consistency with the use of a validated instrument. In addition, we have collected a representative sample across gender, age and professions that add power to this study.
However, the reliance of self-reporting, particularly for the hours of work questions, physical exercise duration and frequency may have resulted in some under-reporting or over-reporting of the data. The personality type and comorbidity of the participating subjects were not addressed.
The current study is guided by the healthcare professional burnout model which depicts external and internal predictors associated with burnout. Despite the utility and applicability of existing models of burnout among healthcare professionals in Qatar, the conceptual model working group did not find yet a model that could address the predictors and factors associated with burnout across physicians, nurses/paramedics and career stages. Thus, this model enabled a conceptually motivated process in examining the current evidence on burnout among healthcare professionals in Qatar.
One of the limitations of this study is that the Emergency Medical Services (EMS) did not participate in the study because the EMS supervisor did not approve their staff contribution. Another limitation is that there was only a few responses from the emergency department (ED) staff. The ED and EMS departments are very busy and working under stressful conditions that may have a considerable burnout liability. Therefore, the lack of ED and EMS participation may underestimate the prevalence of burnout in this study. Furthermore, the implementation of the electronic health record (CERNER) and its role in burnout need to be addressed. Previous studies showed the effect of using electronic health records (EHRs) on the rate of burnout. The MEMO study found that the hope that EHRs in the workplace would reduce stress has not been realised; in fact, implementation of an EHR can contribute to burnout, especially early in the implementation.
We have used the MBI-HSS validated questionnaire and so we have not measured the following information such as (1) attending local or international educational meetings (which are allowed for physicians working at the HMC), (2) involvement in teaching, research and publishing (all the departments are conducting journal clubs and research meetings at the HMC), (3) holiday allowance (same for all ranks), (4) relationship with seniority and expatriates and (5) communal rest rooms with facilities (not available).
Lastly, there is no consensus on the definition of burnout and measurement tools used to assess the effects of occupational stress on physicians.43 Burnout was assessed in 182 studies from 45 countries in a recent review; there was substantial variability in prevalence estimates of burnout among practising physicians and marked variation in burnout definitions, assessment tools and study quality.43
Implications for research and/or practice
The results of our study indicated a need for an effective interventional programme for this medical cohort who appears to be at a higher risk of burnout. Interventions that could mitigate burnout based on the AHRQ study37 include the following: (1) monthly meetings on work–life issues of staff members should be scheduled by the provider, (2) screening projects on depression and diabetes (in addition to other comorbidities) should engage office staff to reduce the pressure on clinicians/physician, (3) patient data entry should be done by medical assistants so that doctors will get more time with their patients, (4) standing order sets should be prepared, (5) responsive information technology support should be provided, (6) required activities should be reduced, (7) additional time should be given for documentation and data entry into the electronic health record, (8) provider should offer part-time or flexible work schedules, (9) provider should support a balanced work/home model, (10) float pool for clinicians should be used for covering unexpected leaves, (11) team building for work flow and quality measures and (12) enhancing coalitions between clinicians and leaders emphasising values and concerns.
CONCLUSIONS
Burnout affects one-tenth of the health professionals in Qatar. Physicians are more prone to DP and lower PA, but nurses prone to higher EE. No gender discrepancy is appreciated in this study. Junior staff is at higher risk of burnout. The high overall level of burnout reported in two healthcare institutions raises concerns about the health of the physicians and nurses and its implication on the quality of patient care.
In Qatar, 10% of the healthcare professionals satisfied the criteria of burnout.
Physicians are prone more to higher depersonalisation and lower personal accomplishment.
Nurses are more likely to have higher emotional exhaustion.
The junior medical staff is at a higher risk of burnout; however, no gender discrepancy is reported.
Do we need specific corrective measures against burnout based on the healthcare subspecialty?
Do the pre-employment assessment and training alleviate burnout?
Do the personality type and comorbidity of the employee contribute to the development and severity of burnout?
Shall we study the psychological impact of pandemics (ie COVID-19) on the healthcare providers?
The prevalence of burnout among healthcare professionals is rising compared to other professionals.
The consequences of burnout is not limited to healthcare providers but also their family, colleagues and patients
Acknowledgements
We would like to thank the trauma, radiology, cardiology, surgery and medical staff for their support.
Footnotes
All authors have substantial contribution. AE-M, WHI, &WE-A contributed to design, data collection and interpretation, and manuscript writing and approval. MG, BS, AAH, BW, SN and HA-T contributed to design, data collection and manuscript writing and approval.
The authors have not declared a specific grant for this research from any funding agency in the public, commercial or not-for-profit sectors.
None declared.
Verbal consent was taken from participants that was approved by Medical Research Center (MRC) Ethical Committee at Hamad Medical Corporation.
The study protocol was approved by Medical Research Center (MRC) Ethical Committee at Hamad Medical Corporation (MRC-01-18-133).
Not commissioned; externally peer reviewed.
All data relevant to the study are included in the article or uploaded as supplementary information.
This content has been supplied by the author(s). It has not been vetted by BMJ Publishing Group Limited (BMJ) and may not have been peer-reviewed. Any opinions or recommendations discussed are solely those of the author(s) and are not endorsed by BMJ. BMJ disclaims all liability and responsibility arising from any reliance placed on the content. Where the content includes any translated material, BMJ does not warrant the accuracy and reliability of the translations (including but not limited to local regulations, clinical guidelines, terminology, drug names and drug dosages), and is not responsible for any error and/or omissions arising from translation and adaptation or otherwise.
