


ABSTRACT
Primary hyperparathyroidism (PHPT) is much more common than familial hypocalciuric hypercalcaemia (FHH), but there is considerable overlap in biochemical features. Urine calcium indices help with the differential diagnosis, but their reliability in making this distinction is not clear. The aim of this study was to compare urinary calcium values in patients with PHPT and FHH.
This was a case–control study of patients with PHPT who had successful surgery and genetically proven FHH between 2011 and 2016. Due to low FHH numbers, patients from neighbouring hospitals and outside study period (2017–2019) were allowed to improve power. Data on demographics and urinary calcium were obtained from electronic records and compared between the two groups.
During the study period, 250 patients underwent successful PHPT surgery, while in the FHH arm, 19 genetically proven cases were included. The median (IQR) 24-hour urine calcium excretion (UCE) in the PHPT group was 8.3 (5.6–11.2) mmol/24 hours compared with 3.2 (2.1–6.1) mmol/24 hour in the FHH group (p<0.001). Median (IQR) calcium to creatinine clearance ratio (CCCR) in the PHPT and FHH groups was 0.020 (0.013–0.026) and 0.01 (0.002–0.02), respectively (p=0.001). The sensitivity of urinary tests for PHPT was 96% for UCE (cut-off ≥2.5 mmol/24 hour) and 47% for CCCR (cut-off >0.02). The specificity of the urinary tests for FHH was 29.4% for UCE (cut-off <2.5 mmol/24 hour) and 93% for CCCR (cut-off <0.02).
24-hour UCE is more sensitive in diagnosing PHPT; however, it is less specific in ruling out FHH as compared with CCCR, when the cut-offs suggested by the International guidelines from the fourth international workshop are used. A significant proportion of patients with PHPT would have also required genetic studies if the guidelines were followed.
PURPOSE OF STUDY
Primary hyperparathyroidism (PHPT) is a common endocrine disorder. Its reported annual incidence is 66 per 100 000 per year in females and 25 per 100 000 per year in males.1 The prevalence, however, has been estimated to be much higher (approximately 1%).2 PHPT arises from the autonomous overproduction of parathyroid hormone (PTH) by one or more abnormal parathyroid glands. The diagnosis is biochemical with elevated serum calcium levels and elevated or inappropriately normal PTH levels.3 Many patients are asymptomatic, and hypercalcaemia is detected incidentally following routine investigations of non-specific symptoms; but some present with bone4 and/or kidney damage.5 6
Familial hypocalciuric hypercalcaemia (FHH) is an autosomal dominant condition with a high degree of penetrance.7 FHH is much rarer than PHPT. While the true prevalence is unknown, it has been estimated to be in the range of 1 in every 10 000 to 100 000.8 Various genetic mutations affecting three different genes (CASR, APS21, GNA11) lead to decreased renal calcium excretion and mildly elevated calcium levels. FHH is a benign condition and is not associated with end-organ damage and therefore does not require treatment.9
It is important to distinguish between these two conditions in clinical practice as management strategies are quite different. The definite treatment for PHPT is surgery,3 which can normalise the calcium levels and reduce the risk of complications.10 11 However, in FHH, parathyroid surgery does not lower calcium levels and should be avoided.12
The differentiation between PHPT and FHH, however, can be challenging as there is significant overlap in biochemical measurements such as serum calcium, PTH and phosphate levels.7 International guidelines13 recommend the use of 24-hour urine calcium to creatinine clearance ratio (CCCR) and genetic testing to differentiate between the two conditions in patients with hypercalcaemia up to 3 mmol/L. The preference of 24-hour CCCR over other urinary calcium modalities is due to better reported specificity of CCCR.14 In clinical practice, however, the renal handling of calcium is still measured using other indices such as calcium to creatinine ratio (CCR), 24-hour urine calcium excretion (UCE) and fasting or random urine CCCR.15 Also, there are a considerable number of patients who have an intermediate 24-hour CCCR of between 0.01 and 0.02.14 At this level, current guidelines13 advocate genetic testing for FHH but this may not be feasible in many centres.
This study was conducted to evaluate current practice with regards to assessment of urinary calcium excretion and to compare the commonly used indices of urinary calcium excretion in patients with proven PHPT and in patients with FHH at a single tertiary care centre.
METHODS
This is a retrospective case–control study of patients diagnosed with either PHPT or FHH at a single centre. All patients who had surgery for PHPT between 2011 and 2016 were identified. Patients who had successful surgery (defined as normalisation of serum-adjusted calcium after surgery with no evidence of recurrent hypercalcaemia within 6 months after surgery) were included in the PHPT arm. Patients who had a genetically proven diagnosis of FHH during the same study period were included in the FHH cohort. Patients with a clinical phenotype suggestive of FHH but negative genetic testing were excluded from the FHH cohort. Due to low FHH numbers, patients from neighbouring hospitals during the study period were also included along with patients outside the study period from the same hospital (2017–2019).
In addition to demographic details, data were collected on biochemical results (serum-adjusted calcium, plasma PTH) as measured by standard laboratory methods. Serum calcium was measured using a Roche/Hitachi Cobas 8000 e702 automated clinical chemistry analyser (Roche Diagnostics GmbH, Mannheim, Germany). This method uses 5-nitro-5ʹ-methyl-(1,2-bis(o-aminophenoxy)ethan-N,N,N’,N’-tetraacetic acid (NM-BAPTA) reagent. The interassay coefficient of variation (CV) as measured in the laboratory is 1.1–1.5% at 1.52 mmol/L and 0.6–1.1% at 3.07 mmol/L. Adjusted calcium was calculated by the laboratory method using the following equation:
Intact PTH (second generation) was measured using an immunoassay method by the Roche Cobas 8000 e602 (Roche Diagnostics GmbH). The interassay CV measured in the laboratory is 2.2–3.2% at 34 ng/L, 1.6–1.7% at 94 ng/L and 1.4–1.8% at 839 ng/L, while the reported reference range is 15–65 ng/L (1.6–6.9 pmol/L). The normal ranges for serum-adjusted calcium and plasma PTH are 2.20–2.60 mmol/L and 1.6–6.9 pmol/L, respectively. For patients with PHPT, the most recent biochemical results prior to surgery were considered. For patients with FHH, the highest readings for serum-adjusted calcium and PTH were collected along with results of genetic testing. The genetic screening for FHH was done on a gene panel which included screening for mutations in three genes (CASR, AP2S1, GNA11). The renal handling of calcium was most often measured as either 24-hour UCE on an unrestricted diet (normal range 2.5–7.5 mmol/24 hour) or CCCR, also known as fractional excretion of calcium. In the case of more than one reading, the highest reading was considered for both patient groups. The CCCR was calculated by the laboratory method from spot random or fasting urine and serum sample using the following equation:
The records of patients with low UCE in patients with proven PHPT were reviewed to determine potential causes of low urinary calcium other than FHH such as low vitamin D levels, chronic kidney disease (CKD) or use of thiazide diuretics.
The above data were collected on an excel spreadsheet. All identifiable data were stored on the password-protected NHS network and were removed subsequent to exporting to SPSS v.24 for analyses and reporting. Data were primarily described using median and IQR for continuous data that were not normally distributed and frequencies/percentages for binary data. Groups were compared using χ2 test with Yates’ correction (or Fisher’s exact test) for binary variables and the Mann-Whitney U-test for continuous data that were not normally distributed. Spearman’s correlation (r) was used to evaluate the correlation between 24-hour UCE and CCCR. The sensitivity of the urinary tests for PHPT was the per cent of patients with PHPT with the disease whose values fell above UCE of 2.5 mmol/24 hours or CCCR of 0.02. The specificity of the urinary tests for FHH was the per cent of patients with FHH with the disease whose values fell below UCE of 2.5 mmol/24 hours or CCCR of 0.02.
The study was registered with Sheffield Teaching Hospitals (STH) Research department (reference number 19 869). As this was an observational study, a formal application was not made to the ethics committee and individual patient consent was not deemed to be necessary by the research department.
RESULTS
Between 2011 and 2016, a total of 264 patients were identified who underwent surgery for PHPT at STH. After exclusion of 13 patients who had at least one elevated serum-adjusted calcium level after surgery and 1 patient where the outcome was unclear, 250 patients were included for analysis. Ten patients during the same study period met the inclusion criteria. After including the other patients, a total of 19 patients with genetically proven FHH were included in the final analysis (figure 1). The different mutations include CASR c.482A>G, p.Tyr161Cys (n=6), CASR c.2096C>A, p.Thr699Asn (n=4), CASR c.2243C>G, p.Pro748Arg (n=2), CASR c.329C>A, p.AIa110Asp (n=2), CASR c.179G>T, p.Cys60Phe (n=2), AP2S1 c.43C>T, p. Arg15Cys (n=2) and CASR c.73C>T p.Arg25 (n=1).
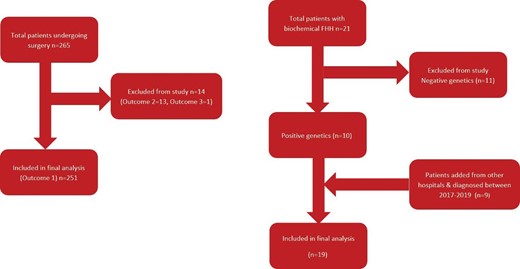
Study design.
Table 1 compares the demographics and biochemical parameters between the two groups of patients. Over 80% of the patients in the PHPT group and 68.4% in the FHH group were females. Patients in the FHH group were much younger at diagnosis with median (range) age of 43 (26–55) years as compared to 65.0 (54.0–73.0) years in the PHPT group. The adjusted calcium level in the FHH group 2.86 mmol/L (IQR 2.74–3.00) was higher (p=0.173) than the PHPT group 2.78 mmol/L (IQR of 2.71–2.93), probably because the highest available calcium levels were recorded for patients with FHH (cf. most recent calcium levels prior to surgery were recorded for patients with PHPT). The PTH levels in the PHPT group were all above the normal range, while in comparison, the PTH levels in the FHH group were either normal or modestly elevated (figure 2).
Comparison of demographics and biochemistry in patients with PHPT and FHH
| PHPT (n=250) | FHH (n=19) | P value | |
| Gender (F/M) in % | F=83.3% M=16.7% | F=68.4% M=31.6% | 0.120 |
| Median (IQR) age in years | 64.7 (54.0–73.0) | 43 (26–55) | <0.001 |
| Median (IQR) adjusted calcium in mmol/L | 2.78 (2.71–2.93) | 2.86 (2.74–3.0) | 0.173 |
| Median (IQR) PTH in pmol/L | 14.6 (10.4–21.0) | 7.0 (6.45–8.0) | <0.001 |
| Median (IQR) creatinine in mmol/L | 67 (59–81.25) | 79 (64–91) | 0.043 |
| Median (IQR) 25-hyroxyvitamin D in nmol/L | 52 (33.8–72.9) | 76.2 (58.7–86.1) (n=17) | 0.005 |
F, female; FHH, familial hypocalciuric hypercalcaemia; M, male; PHPT, primary hyperparathyroidism.
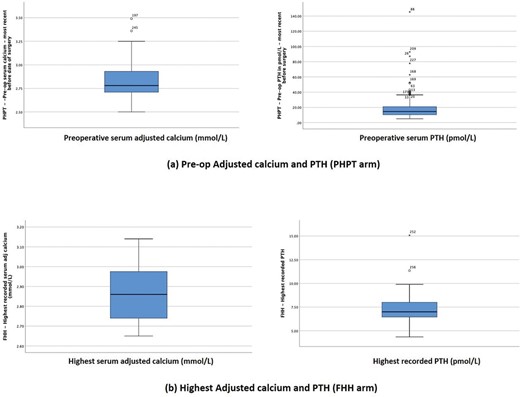
Comparison of serum calcium and PTH levels between PHPT and FHH groups. FHH, familial hypocalciuric hypercalcaemia; PHPT, primary hyperparathyroidism; PTH, parathyroid hormone.
In patients with PHPT, 24-UCE levels were measured in 188 patients and CCCR in 136 patients prior to surgery. Both measurements were available in 94 patients. In the patients with FHH, 24-hour UCE and CCCR results were available in 17 and 14 patients, respectively; 12 patients had both test results. The median (IQR) 24 -hour UCE in the PHPT group was 8.3 (5.6–11.2) mmol/24 hours compared with 3.2 (2.1–6.1) mmol/24 hours in the FHH group (p<0.001). On the other hand, the median (IQR) CCCR in the PHPT and FHH groups was 0.020 (0.013–0.026)and 0.01 (0.002–0.02), respectively (p=0.001).
The highest urinary calcium measurements in the FHH group were in a patient with FHH type 3 with AP2S1 gene mutation, with 24-hour UCE measurements of 10.9 mmol/24 hours. The possibility of FHH was considered in the patient as the patient’s mother had previously undergone unsuccessful parathyroidectomy and the patient’s imaging failed to locate an enlarged parathyroid gland. This patient did not have CCCR checked, but a repeat 24-hour UCE was again elevated at 7.8 mmol/24 hours. The highest CCCR in the FHH group was 0.0240 (calculated on fasting sample) in a patient with FHH type 1. This patient had two other readings which were <0.02 (0.016 and 0.017), but the corresponding 24-hour UCE in this patient was also high (7.9 mmol/24 hours). In addition to this patient, two other patients with FHH had CCCR of 0.020; which is the upper limit beyond which FHH is considered unlikely.11 Despite this, there is a weak correlation between the two urinary calcium indices (figure 3).
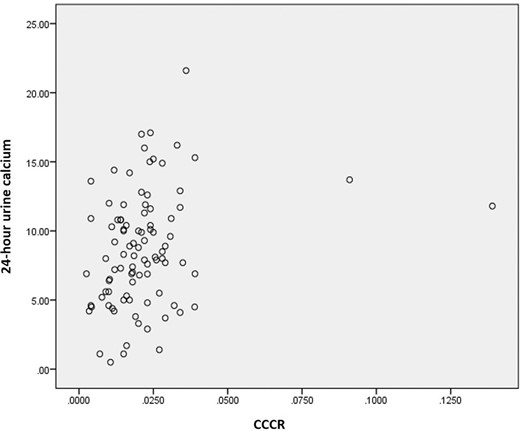
Correlation between 24-hour UCE and CCCR in 94 patients with PHPT (Spearman’s correlation r=0.278; p=0.007). CCCR, calcium to creatinine clearance ratio; PHPT, primary hyperparathyroidism; UCE, urine calcium excretion.
The receiver operating characteristic curve analysis for discrimination between patients with PHPT and FHH is shown in figure 4. The area under the curve for UCE was 83.6% (p<0.001) and for CCCR was 77.3% (p<0.001). The sensitivity of the urinary tests for PHPT (based on UCE of 2.5 mmol/day and CCCR of 0.02) was 96% for UCE and 47% for CCCR. The specificity of the urinary tests for FHH was 29.4% for UCE and 93% for CCCR.
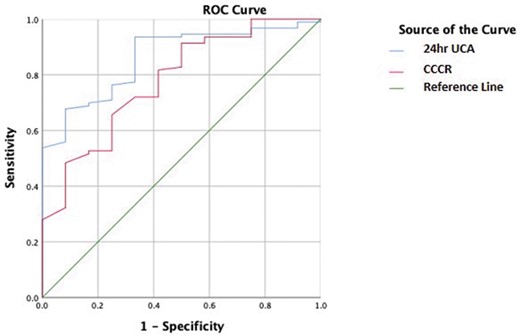
Receiving operating characteristic (ROC) curve analysis for discrimination between PHPT and FHH. FHH, familial hypocalciuric hypercalcaemia; FRAC; PHPT, primary hyperparathyroidism; UCE, urine calcium excretion.
In the PHPT group, all 8 of the low 24-hour UCE were due to either vitamin D deficiency (n=6) or CKD (n=2). Of the 16 patients with low CCCR, 13 had vitamin D deficiency and 1 was on thiazide diuretics.
CONCLUSIONS
In this study, the sensitivity of 24-hour UCE in diagnosing PHPT (95.7%, using cut-off 2.5 mmol/24 hour) was better than CCCR (47.1%, using cut-off >0.02). But, 70.6% of the patients with FHH had normal or high 24-hour UCE with only 1 patient with FHH had CCCR of >0.02. If the approach suggested by the International guidelines on genetic testing were to be adopted, a significant proportion of patients with PHPT should have genetic testing to rule out FHH (figure 5).
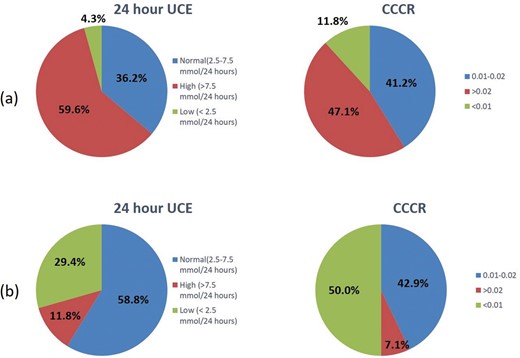
Urine calcium indices in patients with PHPT (A) and FHH (B). CCCR, calcium to creatinine clearance ratio; FHH, familial hypocalciuric hypercalcaemia; PHPT, primary hyperparathyroidism; UCE, urine calcium excretion.
While 24-hour UCE has a sensitivity of >95% in corroborating the diagnosis of PHPT, this test would miss the diagnosis of FHH in a significant number of patients if it is the only urinary calcium parameter checked. Despite the rarity of FHH diagnosis, this has the potential to result in unnecessary surgery in patients with FHH. The CCCR, on the other hand, has better specificity than 24-hour UCE as none of the FHH had CCCR of >0.02. Therefore, only one of the patients with FHH would have been missed by the two-step approach suggested by the guidelines (specificity of 93%).
The most relevant study in this context included 54 patients with FHH14; this reported that 24-hour CCCR had better specificity than 24-hour UCE and 24-hour CCR in ruling out FHH. In this study, like our, there was one patient with a 24-hour CCCR >0.02. In a recent study of 63 patients with FHH, biochemical results showed that 2 patients would be incorrectly labelled as PHPT as they had 24-hour CCCR of >0.02.16 The authors have proposed a scoring system called ‘Pro-FHH’ which includes biochemical parameters including serum calcium, PTH, 24-hour CCCR and bone turnover marker osteocalcin to correctly identify all patients who can have a possible diagnosis of FHH.
A metanalysis of 10 papers published between 1972 and 2001 reported specificity of 24-hour CCCR of 99% with cut-off <0.017.17 The reported specificity of 24-hour UCE was only 47% at the cut-off of 2.3 mmol/24 hours with specificity approaching 95% at a cut-off of 6.5 mmol/24 hours. However, it is not clear that factors such as vitamin D deficiency and CKD were considered while analysing these results. A comparison of biochemical and urinary calcium parameters among healthy subjects, patients with PHPT and patients with FHH showed specificity of 95% for 24-hour UCE and fasting CCCR at decision levels of 5.1 mmol/24 hours and 0.008, respectively.18 However, again vitamin D deficiency and CKD were not considered. In a more recent abstract, Chandra and Todd19 have proposed a cut-off of 0.015 in patients with vitamin D repletion giving the sensitivity of 100% and specificity of 75% for FHH. This study, however, had only 5 of 22 patients in the FHH group where the diagnosis was established by genetic testing.
Consistent with the published literature, our study demonstrates that CCCR has much higher specificity when compared with 24-hour UCE in ruling out FHH, and therefore should be the preferred urinary calcium measurement in patients with hypercalcaemia. However, there may be a few patients with FHH, who would be misdiagnosed as PHPT and be subject to unnecessary surgery and potential morbidity including recurrent laryngeal nerve palsy.20 21 Another drawback of the cut-offs suggested by the guidelines is that a very large proportion of patients with PHPT would fall into the category where genetic studies are required to exclude FHH. While this option may not be practical for many centres worldwide, the increasing availability of genetic testing along with reduced costs may make it a more viable option in the future. Also, more studies will be required to accurately determine the sensitivity of the available genetic tests in diagnosing FHH.
Several limitations need to be considered while interpreting the results of this study. The study is a retrospective study and is prone to limitations inherent in such a study design. However, attempts have been made to minimise selection bias by ensuring that all patients in the study period are included. Second, the CCCR measured in some patients in our study was on a random sample instead of a 24-hour urine sample as recommended by Eastell et al. and christensen et al.13 14 However, there are no studies directly comparing the two measurements. Lastly, as the study was designed to compare urinary calcium values at a single centre, the number of patients with FHH in our study was small. Also, we had to exclude patients with probable FHH in whom genetic testing was negative. It is possible these results were false negative, as there is a possibility that other genes may be involved in FHH that have not been identified yet or this could be due to mechanisms other than changes in coding sequences.
In summary, this study has demonstrated that CCCR has much better specificity in ruling out FHH as compared to 24-hour UCE and therefore should be the preferred urinary calcium parameter to be tested while differentiating FHH from PHPT. However, a small number of patients with FHH can still be missed by the two-step approach suggested by the guidelines. This could be addressed by maintaining a high index of suspicion in the diagnosis of PHPT; especially in young patients with minimally elevated PTH levels, family history of hypercalcaemia and negative imaging. We suggest further studies to evaluate the use of bone turnover markers and genetic studies in differentiating FHH from PHPT.
FHH is rare, but it needs excluding before surgery is planned for PHPT to avoid unnecessary surgery.
CCCR has better specificity in ruling out FHH compared with 24-hour UCE, still, genetic testing is rquired in large number of unclear cases to safely exclude FHH.
How useful other biochemical markers (such as bone turnover markers) can be in differentiating between FHH and PHPT?
How much the genetic testing is cost effective when compared with urinary calcium testing?
Footnotes
Planning of study: SB and MFA. Data collection: MFA, AM and JM. Analysis of data: SB, RE and MFA. Writing manuscript: MFA, SB, JM, ER and JC.
The authors have not declared a specific grant for this research from any funding agency in the public, commercial or not-for-profit sectors.
None declared.
Not required.
Not commissioned; externally peer reviewed.
Data are available upon reasonable request.
