


Abstract
Unlike in terrestrial and freshwater ecosystems, light fields in oceans fluctuate due to both horizontal current and vertical mixing. Diatoms thrive and dominate the phytoplankton community in these fluctuating light fields. However, the molecular mechanisms that regulate diatom acclimation and adaptation to light fluctuations are poorly understood. Here, we performed transcriptome sequencing, metabolome profiling, and 13C-tracer labeling on the model diatom Phaeodactylum tricornutum. The diatom acclimated to constant light conditions was transferred to six different light conditions, including constant light (CL5d), short-term (1 h) high light (sHL1h), and short-term (1 h) and long-term (5 days) mild or severe light fluctuation conditions (mFL1h, sFL1h, mFL5d, and sFL5d) that mimicked land and ocean light levels. We identified 2,673 transcripts (25% of the total expressed genes) expressed differentially under different fluctuating light regimes. We also identified 497 transcription factors, 228 not reported previously, which exhibited higher expression under light fluctuations, including 7 with a light-sensitive PAS domain (Per-period circadian protein, Arnt-aryl hydrocarbon receptor nuclear translocator protein, Sim-single-minded protein) and 10 predicted to regulate genes related to light-harvesting complex proteins. Our data showed that prolonged preconditioning in severe light fluctuation enhanced photosynthesis in P. tricornutum under this condition, as evidenced by increased oxygen evolution accompanied by the upregulation of Rubisco and light-harvesting proteins. Furthermore, severe light fluctuation diverted the metabolic flux of assimilated carbon preferentially toward fatty acid storage over sugar and protein. Our results suggest that P. tricornutum use a series of complex and different responsive schemes in photosynthesis and carbon metabolism to optimize their growth under mild and severe light fluctuations. These insights underscore the importance of using more intense conditions when investigating the resilience of phytoplankton to light fluctuations.
Introduction
Terrestrial and marine photosynthetic organisms are faced with different intensities and frequencies of light fluctuation. Light fluctuations on land mainly come from canopy or cloud movement, and the latter can reduce sunlight intensity by 10% (Dera and Gordon, 1968). These low frequency and random factors also exist in the ocean but with stronger light reduction when phytoplankton are in high bloom density. Compared with the fixed position of terrestrial plants, marine phytoplankton are subject to frequent changes in their vertical position due to currents and vertical mixing of the water column, and hence more extreme light fluctuations. On the one hand, light decays rapidly in seawater (MacIntyre et al., 2000). On the other hand, in the ocean, horizontal waves produce bright bands or patches due to the lens effect (Schenck, 1957; Schubert et al., 2001). Vertical turbulence (Smayda, 1997; Berdalet et al., 2007; Treguer et al., 2018), internal waves (Kamykowski, 1974; Haury et al., 1979), and Langmuir spirals (Langmuir, 1938; Fogg, 1991) move phytoplankton vertically. These place marine algae under frequent light fluctuations as severe as from 100% surface radiance (2,000 μmol m−2 s−1 on a cloudless day’s noontime) to 1% within 0.5 m (MacIntyre et al., 2000; Larkum et al., 2003; Carvalho et al., 2020). This fluctuation of light intensity, which is 10 times the fluctuation intensity of land, can occur in minutes or even seconds in the ocean (Carvalho et al., 2020). Thus, the more dynamic and intricate light condition in the marine ecosystem causes a huge challenge for marine photosynthetic organisms. Understanding how marine photosynthetic organisms acclimate to light fluctuations is important for unraveling the underlying mechanisms by which the coastal phytoplankton community is governed, but so far, research on this has been limited.
Diatoms are one of the most important primary producers in the ocean, contributing 20%–25% of the global carbon fixation and oxygen production (Nelson et al., 1995; Field et al., 1998; Smetacek, 1999; Bach and Taucher, 2019). They typically dominate coastal waters with strong turbulence and upwelling systems (Margalef, 1978; Blanton et al., 1987; Peeters et al., 1991; Alvarez Salgado et al., 1993; Pitcher and Boyd, 1996; Shin et al., 2000; Allen et al., 2005; Alvarez Salgado et al., 2005; Yoshie and Yamanaka, 2005; Figueiras et al., 2006; Smayda and Trainer, 2010; Capone and Hutchins, 2013; Zielinski, 2014; Lafond et al., 2019; Carvalho et al., 2020). As very successful photoautotrophs, diatoms are generally flexible physiologically and acclimate to complex and dynamic growth environmental conditions, especially light fluctuations. Therefore, this group of phytoplankton is suitable models for studying the adaptive mechanisms of marine algae to thrive in fluctuating light fields in the ocean. Regarding ecology, diatoms have a growth advantage under fluctuating light in natural marine environments, compared with the dinoflagellates (ZHou et al., 2021), cyanobacteria, and green algae (Litchman, 1998; Nicklisch, 1998). Regarding physiology, diatoms have an advantage under fluctuating light from the perspective of photosynthetic electron transport (Wagner et al., 2006; Lavaud et al., 2007; Grouneva et al., 2016; Zhou et al., 2020, 2021). Interestingly, our previous molecular work (Zhou et al., 2021) suggests that the proton-gradient regulation 5 (PGR5) protein in diatoms specifically responds to severe light fluctuation conditions (100-fold), but not mild light fluctuation (10-fold). This result indicates an important role of PGR in the acclimation of marine diatoms to severe light fluctuation.
Marine algae and terrestrial plants have evolved diverse photosynthetic characteristics and have different mechanisms responding to environmental light conditions. First, adapting to the high light decay in the water column, marine algae appear to be more efficient in light utilization (Cartaxana et al., 2016). The light compensation point is ˂1 or 2 μmol m−2 s−1 in diatoms (Richardson et al., 1983; Geider et al., 2008), compared to 8–16 μmol m−2 s−1 in C3 (CO2 assimilated by Rubisco) or 6–14 μmol m−2 s−1 in C4 (CO2 assimilated by Rubisco and phosphoenolpyruvate carboxylase) land plants (Nobel, 2020). Second, chloroplasts of diatoms originated from a rhodophyte ancestor through secondary endosymbiosis, bringing marine algae distinct chloroplast and thylakoid structures relative to land plants and green algae, both of which have chloroplasts arising from a cyanobacterial ancestor via primary endosymbiosis (Depauw et al., 2012; Grouneva et al., 2013). Land plants and green algae harvest light energy by light-harvesting complex (LHCII)-containing chlorophyll a and b, while marine diatoms use fucoxanthin–chlorophyll protein (FCP) complex-containing chlorophyll a and c to harvest light (Wang et al., 2019). Third, diatoms can inhabit and become dominant in extreme light environments, including on the dim seafloor (benthic species) and at the sea surface, which has high and fluctuating illumination, suggesting that diatoms have unique adaptive mechanisms to cope with the stress of violent light fluctuations. Current research suggests that moderate light fluctuation is a common and harmful stressor for land plants and green algae but not detrimental to marine diatom (Grouneva et al., 2016; Zhou et al., 2021). Meanwhile, mild light fluctuation causes the loss of proton gradient-regulating proteins and photosynthesis impairment in land plants and green algae (Suorsa et al., 2012, 2013; Yamamoto et al., 2016; Yamori et al., 2016; Jokel et al., 2018; Storti et al., 2018; Yamamoto and Shikanai, 2019; Zhou et al., 2020, 2021), but has little effect on marine diatoms (Zhou et al., 2021). Due to these findings, our knowledge of the regulation of photosynthesis to different light conditions acquired from the study of land plants and green algae may not apply to diatoms.
Until recently, only a few omics works have addressed mechanisms that underlie responses to light fluctuations, even in land plants such as Arabidopsis (A. thaliana) (Jarvi et al., 2016; Schneider et al., 2019), tomato (Solanum lycopersicum) (Zhang et al., 2020), and maize (Zea mays) (Qu et al., 2021), let alone phytoplankton (Mustila et al., 2016, 2021; Riediger et al., 2019). However, previous research on marine algae (Wagner et al., 2006; Lavaud et al., 2007; Zhou et al., 2020, 2021) has been limited to thylakoids and a single protein, and the complete adaptation and regulation network, including photosynthesis, carbon fixation, and subsequent metabolism, remains unclear.
In this study, we investigated the responses of the model marine diatom Phaeodactylum tricornutum to different light fluctuation conditions using an integrated approach involving transcriptional profiling, 13C-tracer labeling, and metabolite profiling. Our principal component analysis (PCA), pathway enrichment analysis, trend analysis, and oxygen evolution measurements revealed substantially different effects between mild and severe light fluctuations. We further analyzed the transcriptional regulations of key physiological processes, including photosynthesis, carbon, and fatty acid metabolism in P. tricornutum, and focused on transcription factors (TFs) involved in these processes. TFs with light-response PAS domains were specifically expressed under mild and severe light fluctuations, and they were predicted to regulate LHC proteins under light fluctuation. All results together showed that photosynthesis and carbon metabolism (photosynthetic carbon fixation and photorespiration) were enhanced under light fluctuation, resulting in the preferential accumulation of lipids over protein or glucose for stable storage with a high energy efficiency.
Results
Differential gene expression and metabolite profiles in P. tricornutum between constant light and light fluctuations
By mapping to the reference genome, 10,328 genes were identified from the transcriptomes we sequenced, accounting for 97.82% of the genome assembly in the NCBI (National Center for Biotechnology Information) database (total 10,558 genes). Relative to the constant light cultures (CL5d), 3,726 of these genes exhibited differential expression in the severe high light cultures (sHL1h), and 2,673 in all four fluctuating light regimes (mFL1h, mFL5d, sFL1h, and sFL5d) used in this study (Figure 1;Supplemental Table S1). Quantitative real-time PCR (qPCR) results for 10 genes showed similar differential dynamics as the transcriptomic data, validating the overall transcriptomic profiles (Supplemental Figure S1). From the metabolomic analysis, 7,107 metabolites were detected under positive ion mode (POS) and 5,240 were detected under negative ion mode (NEG), of which 1,630 POS and 916 NEG metabolites were annotated. All treatments commonly contained 10,259 genes and 11,692 metabolites (Supplemental Figure S2).
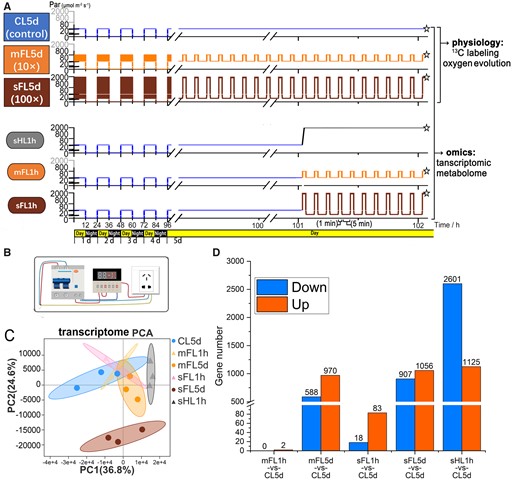
Experimental light regimes and transcriptomic responses. A, Profiles of light intensity for six different treatments (CL5d, mFL5d, sFL5d, sHL1h, mFL1h, and sFL1h). The sampling and freezing time points of six treatments are indicated by asterisks. Algae in groups of CL5d, mFL5d, and sFL5d was collected for experiments of 13C isotope labeling and oxygen evolution measurement (under two conditions: mild light fluctuation and severe light fluctuation). B, Schematic diagram of the circulating time relay circuit used to provide the high light source for light fluctuation. C, PCA of gene expression under different treatments. D, Bar graph showing upregulated or downregulated (fold change > 2, FDR < 0.05) gene numbers in treatments related to CL5d (control).
Among the differentially expressed genes (DEGs) compared to CL5d (false discovery rate (FDR) < 0.05, absolute fold change ≥2) (Figure 1D), sHL1h showed the largest number of upregulated (2,601) and downregulated (1,125) regulated genes, while sFL5d (907 upregulated genes and 1,056 downregulated genes) ranked second. A PCA of the transcriptome data (Figure 1C) showed that sFL5d was substantially separated on PC2 from CL5d and the other treatments. sHL1h was slightly separated on PC1 from mFL5d, mFL1h, sFL1h, and CL5d, which overlapped. This PCA pattern revealed striking effects of long-term severe light fluctuation treatment and noticeable effects of short-term high light fluctuation treatment.
As shown in a Venn diagram of the metabolome (Supplemental Figure S2), 16 metabolites were specifically produced in sFL5d, including galabiosylceramide (d18:1/24:0, sphingolipids), 2-methyl-1,4-naphthalenediol bis (dihydrogen phosphate), 2,4'-dichlorobiphenyl, and se-methyl-L-selenocysteine. N-gluconyl ethanolamine phosphate was among the five metabolites specific to mFL5d and sFL5d. The genes shown in Figure 1D and Supplemental Figure S2 are listed in Supplemental Tables S1 and S6. We checked the transcriptomic data and found upregulation of gene encoding Sphingolipid 4-desaturase (dihydroceramide desaturase, Phatr3_J22677). This gene upregulation and the active production of galabiosylceramide indicate potential elevated production of sphingosine and other ceramide metabolites under the severely fluctuating light condition.
Oxygen evolution rate and enriched photosynthesis pathways of DEGs under light fluctuation conditions in P. tricornutum
To investigate how diatom responses differ between light fluctuations and constant high light, we performed a trend analysis (Figure 2A). We found 1,191 genes exhibiting increased expression in mFL5d and sFL5d in comparison to CL5d, which were enriched in the KEGG (Kyoto Encyclopedia of Genes and Genomes) pathways for ribosomes, protein export, biosynthesis of lysine, monobactam, and aminoacyl-tRNA, carbon fixation in photosynthetic organisms, and photosynthesis. Meanwhile, 755 genes decreased in mFL5d and sFL5d (trend analysis profile DOWN1: mFL5d,sFL5d< CL5d; and profile DOWN2: sFL5d < mFL5d < CL5d) in comparison to CL5d, which were enriched in pathways for metabolism of propanoate, carbon, alpha-linolenic, glyoxylate, and dicarboxylate, biosynthesis of amino acids and the TCA (Tricarboxylic Acid) cycle. In profile UP1 of the trend analysis, genes (Supplemental Table S3) showed low expression under CL5d and dramatically higher expression levels under mFL5d and sFL5d, between which gene expression levels were similar (Supplemental Tables S2 and S3). Among these genes, the gene encoding TMS (Transmembrane segments) membrane protein (Phatr3_J45464) was only expressed under light fluctuations, especially in mFL5d, and expression of the gene encoding triosephosphate isomerase in the Calvin cycle (Phatr3_J50738) was 51.6-fold higher in sFL5d and 36.2-fold higher in mFL5d than in CL5d. In mFL1h and sFL1h, expression of the gene encoding triosephosphate isomerase (Phatr3_J50738) rose by more than eight-fold under light fluctuation but only two-fold under sHL1h compared to that under CL5d. In profile UP2 of the trend analysis, genes as indicated in Supplemental Table S3 showed low expression under CL5d, but increased markedly under mFL5d and even more so under sFL5d. Two genes from the solute carrier protein 4 family were expressed 54.5-fold (Phatr3_EG02360) and 39.6-fold (Phatr3_J54405) higher, respectively, under sFL5d relative to under CL5d, and had much higher expression than under other treatments (Supplemental Tables S2 and S3). Expression of the gene encoding glutathione S-transferase (Phatr3_J34976) under sFL5d was 34.5-fold higher than its expression under CL5d. These results indicated that cells grown under sFL5d performed very differently regarding photosynthesis, carbon fixation, glycolysis gluconeogenesis, carbon metabolism, and fatty acid metabolism than cells grown under mFL5d (Figure 2B). We will elaborate on how these pathways work under light fluctuations.
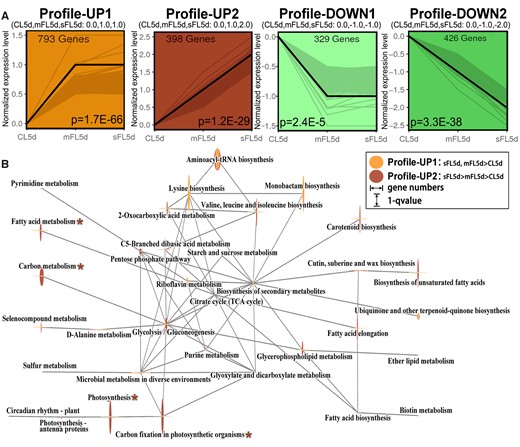
Profiles and network of pathways identified in trend analysis of CL5d–mFL5d–sFL5d (successively increasing light fluctuation intensity). A, Gene expression trend analysis in profile UP1, UP2, DOWN1, and DOWN2 (P < 0.05). The black line shows the trend, and the gray line shows normalized genes (details in Supplemental Table S3). P-value was marked at the bottom of the box. B, The network of top pathways from KEGG enrichment analysis of the profiles UP1 and UP2 in the trend analysis of CL5d–mFL5d–sFL5d. The mainly differential pathways between profiles UP1 and UP2 were marked with asterisk, which were analyzed and verified (Figures 3 and 4). The gray lines connect two connected pathways. Gene numbers and q-value were shown in Supplemental Table S2.
To investigate how the acclimation of P. tricornutum to fluctuating light is influenced by photosynthetic oxygen evolution, cells cultured under CL5d, mFL5d, and sFL5d conditions were monitored under mild and severe light fluctuations (Figure 3, A and B). Cells in the sFL5d light regime showed the highest photosynthetic oxygen evolution rate regardless of whether it was measured under severely (Figure 3A) or mildly (Figure 3B) fluctuating light conditions after 10-min dark-acclimation, and maintained a balance of oxygen consumption and release under severe light fluctuation (Figure 3A). In contrast, mFL5d cells had a higher oxygen evolution rate than CL5d cells under mild light fluctuation (Figure 3B), but that elevation disappeared under severe light fluctuation (Figure 3A).
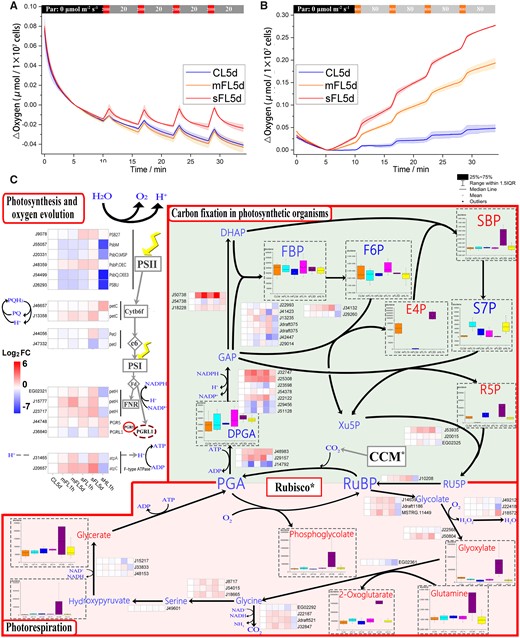
Changes in photosynthesis, oxygen evolution, carbon fixation, and photorespiration. A, Oxygen evolution rates of CL5d, mFL5d, and sFL5d cells measured under short-term severe light fluctuation after 10 min of dark acclimation (indicated by black, top bar). The severe light fluctuation here consisted of low light (20 μmol photons m−2 s−1) interrupted every 5 min by 1 min of high light (2,000 μmol photons m−2 s−1). B, Oxygen evolution rate of CL5d, mFL5d, and sFL5d cells measured under short-term mild light fluctuation after 10 min of dark acclimation (indicated by black, top bar). The mild light fluctuation here consisted of low light (80 μmol photons m−2 s−1) interrupted every 5 min by 1 min of high light (800 μmol photons m−2 s−1). C, Gene expression (heat maps) and metabolite level (bar charts in dashed boxes) in photosynthesis (upper left), photorespiration (bottom) and carbon fixation (upper right). R5P: ribose-5-phosphate; RU5P: Ribulose 5-phosphate; RUBP: Ribulose 1,5- biphosphate; PGA: 3-Phosphoglycerate; DPGA: 1,3-Bisphosphoglycerate; GAP glyceraldehyde 3-phosphate; DHAP: dihydroxyacetone phosphate; FBP: Fructose 1,6-bisphosphate; F6P: Fructose 6-phosphate; SBP: Sedoheptulose 1,7-bisphosphate; E4P: erythrose-4-phosphate; S7P: Sedoheptulose 7-phosphate; Xu5P: Xylulose 5-phosphate. Genes in CCM are shown in Supplemental Figure S4. The filled color represents expression level with Log2FoldChange (related to CL5d).
Photosynthesis, carbon and fatty acid metabolism under light fluctuation conditions in P. tricornutum
Both abundances of gene transcripts and metabolites related to photosynthesis and carbon fixation changed under long-term light fluctuation conditions (Figure 3;Supplemental Figure S3). Under sFL5d relative to CL5d, expression of petC (Phatr3_J13358), petH (Phatr3_EG02321, Phatr3_J15777, Phatr3_J23717), and atpC (Phatr3_J20657) was upregulated. Under mFL5d relative to CL5d, expression of petH (Phatr3_J15777) and atpC (Phatr3_J20657) was upregulated. Most Lhcr (Lhcr1–5, 11–14) and Lhcf proteins decreased under sHL1h. Interestingly, most Lhcr and Lhcf proteins were not reduced under sFL5d compared with the mild light fluctuation and high light conditions (Supplemental Figure S4). PGR5 expression increased under mFL1h, sFL1h, and sHL1h, while PGRL1 expression decreased under mFL1h and sFL1h. Both genes encoding Rubisco small and large subunits (Supplemental Figure S3), phosphoribulokinase (Phatr3_J10208), and phosphoglycolate phosphatase (Phatr3_J14639, Phatr3_Jdraft1186, and MSTRG.11449) increased in expression level in long-term light fluctuation, by 3- to 5-folds in sFL5d relative to CL5d.
Several metabolites involved in carbon fixation and photorespiration, sedoheptulose 1,7-bisphosphate (SBP), erythrose-4-phosphate (E4P), ribose-5-phosphate (R5P), phosphoglycolate, glyoxylate, and glutamine and 2-oxoglutaratewere, had increased accumulation in sFL5d cells in comparison to CL5d. Glycine decarboxylase (GDC) P-protein (Phatr3_J22187), GDCH-protein (Phatr3_J32847), and one GDCT-protein (Phatr3_Jdraft521) had increased accumulation under light fluctuations in comparison to CL5d (Figure 3). Carbonic anhydrases, PEPC, and PEPCK had increased accumulation in sHL1h cells in comparison to CL5d; however, they did not respond to light fluctuations. Chitinase (Phatr3_J47761) transcription increased and chitin synthase showed little change under high light conditions, but decreased in mFL5d or sFL5d in comparison to CL5d (Supplemental Figure S4).
Saturated fatty acid, monounsaturated fatty acids, and short-chain polyunsaturated fatty acids increased in sFL5d cells compared with CL5d, mFL5d, and sHL1h cells (Figure 4). Long-chain polyunsaturated fatty acids (EPA and C22) were the highest in CL5d cells, followed by sFL5d cells. Oxylipins increased markedly under severe light fluctuations in comparison to CL5d (Figure 4A). Under both mFL5d and sFL5d, 13 genes involved in the fatty acid biosynthesis pathway were upregulated (Figure 4B). Based on 13C-tracer incorporation, tripalmitin synthesis was the highest in sFL5d cells (Figure 4C). Furthermore, the rate of amino acid biosynthesis and protein synthesis was lowest in sFL5d cells (Supplemental Figure S5, A and B), while that of mFL5d cells showed little change compared with CL5d. The rate of glucose production displayed little change (Supplemental Figure S5C).
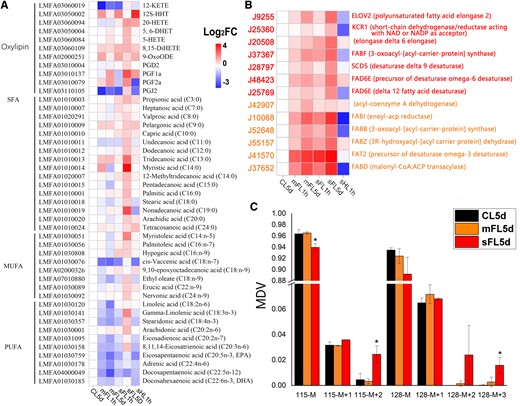
Changes in fatty acid synthesis and metabolism. Heat map showing levels of (A) metabolites and (B) corresponding biosynthesis genes. The genes with orange or red font were in profiles UP1 or UP2 in the trend analysis of CL5d–mFL5d–sFL5d. C, The MDV of tripalmitin (C16) after 5 days (CL5d, sFL5d, and mFL5d treatments) of cell incubation with NaH13CO3. The results are expressed as mean ± standard error (n = 3). Asterisk in boxes depicting statistical significance of differences based on P < 0.05 (Duncan) The filled color represents expression level with Log2FoldChange (related to CL5d).
Responses of TFs in P. tricornutum to light fluctuation
To investigate the transcriptional regulation mechanism underlying the responses to light fluctuation, we set out to identify TFs and potential target genes using a trend analysis (Figure 5) and a Weighted Gene Co-Expression Network Analysis (WGCNA) (Figure 6). A total of 152 TFs were annotated through the PlantDB database and 342 TFs were identified by BLAST against the Arabidopsis TF dataset. Compared with the previous conserved prediction from the genome (Rayko et al., 2010), 228 TFs were added. The less rigorous definition of TF may potentially increase false predictions of TFs but can avoid missing important TFs with low conservativeness in diatoms. Of these predicted TFs, 74 exhibited the expression profiles UP1, UP2, DOWN1 and DOWN2 displayed in the expression trend CL5d–mFL5d–sFL5d (Figure 5A). The genes encoding 19 of these TFs increased in transcript abundance (TFs in black in profiles UP1 and UP2) and genes encoding 25 TFs decreased (TFs in black in profiles DOWN1 and DOWN2), both in trend CL5d–mFL5d–sFL5d (Figure 5A).
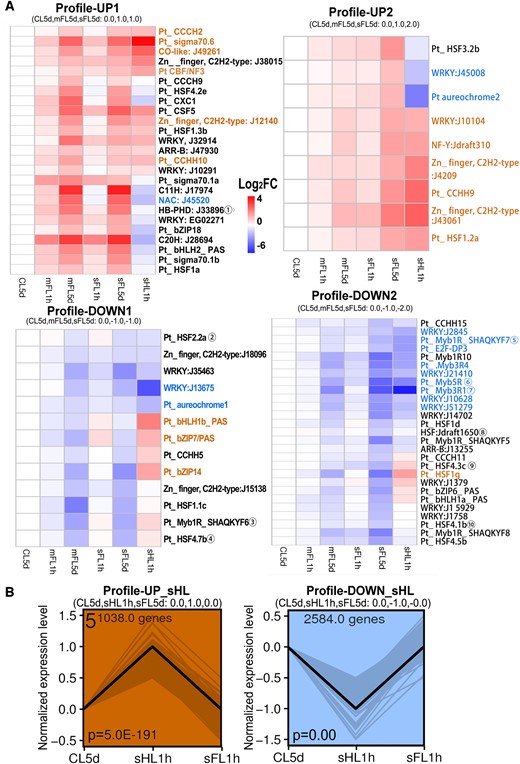
Gene expression of TFs in trend analysis. A, Heatmaps of TFs expression obtained in the trend analysis of CL5d–mFL5d–sFL5d grouped into profiles UP1, UP2, DOWN1, DOWN2. Color scale depicts Log2FoldChange (related to CL5d). TFs with target genes in photosynthesis-antenna proteins pathway (ko00196) in Figure 7 were marked with encircled numbers (① to ⑩). B, Expression trend of the CL5d–sHL1h–sFL1h trend analysis grouped into profiles UP_sHL or DOWN_sHL. The black line shows the trend, and the gray line shows normalized genes. P-value is marked at the bottom of the box. In the heatmaps (A), blue and brown fonts depict the TFs co-expressed with profiles UP_sHL or DOWN_sHL in the trend analysis of CL5d–sHL1h–sFL1h, while black fonts depict no co-expression.
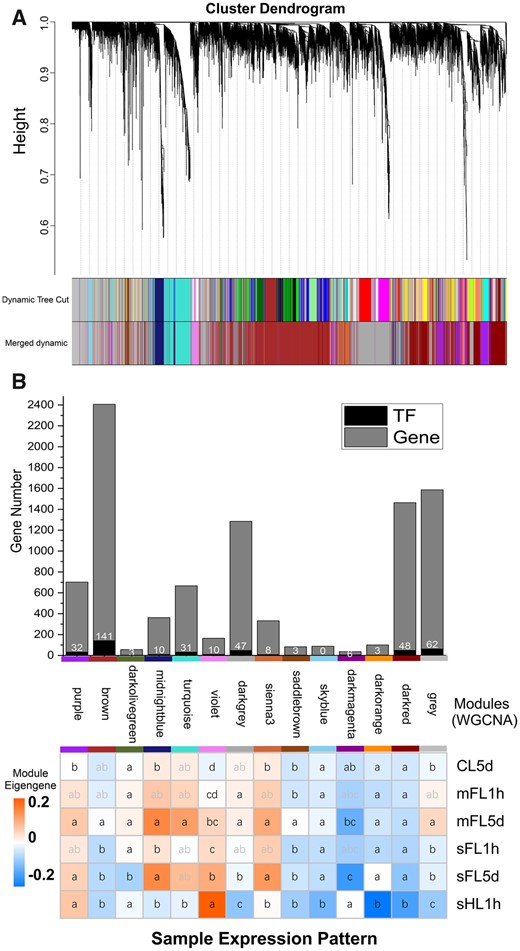
Co-expression of TFs and functional genes based on Weighted Gene co-expression Network Analysis. A, Hierarchical clustering dendrogram of genes derived from WGCNA. B, TFs and genes associated with important pathways or functions responding to light fluctuation, in which the bar chart (top) indicates number of DEGs mapped to the pathway shown whereas the heatmap (bottom) indicates expression pattern and significance levels (letters in boxes depicting statistical significance of differences based on P < 0.05. Numbers in the squares (top) depict count of TFs. KEGG pathway enrichment of co-expressed gene modules was showed in Supplemental Table S4, and the red color indicates significance levels (P < 0.05).
The genes encoding three basic helix–loop–helix (bHLH) and three bZIP (basic region-leucine zipper) proteins with PAS domains showed inverse changes between sHL1h and sFL5d or mFL5d conditions except aureochrome1 (decreased under sHL1h, sFL5d, and mFL5d). Aureochrome 2 and bHLH2_PAS rose under mFL5d and sFL5d but decreased under sHL1h. BHLH1b_PAS, bZIP7, bHLH1a_PAS, and bZIP6 decreased under sFL5d and mFL5d but rose under sHL1h (Figure 5). Aureochrome1 (Phatr3_J8113, PtAureo1a; Costa et al., 2013) reduced under both fluctuating and high light, aureochrome3 (Phatr3_J15977, PtAureo1b) and aureochrome4 (Phatr3_J15468, PtAureo2) was not changed under long-term light fluctuation but reduced in the order of mFL1h, sFL1h to sHL1h, and PtAureo1c only decreased under sHL1h. The short-term high or fluctuating-light stress instead of long-term light fluctuation caused a reduction in aureochrome transcriptional level. Besides aureochrome 2, WRKY_J45008 and HSF3.2b showed the highest expression in sFL5d but decreased in sHL1h.
Ten TFs predicted to regulate photosynthesis antenna genes showed the trend of CL5d–mFL5d–sFL5d. The gene encoding plant homeodomain (PHD) type zinc finger (C4HC3) protein Phatr3_J33896 and its target genes Lhcr7, Lhcz1, and Lhcf17 (Figure 7;Supplemental Figure S4) all had increased expression in mFL5d and sFL5d. We examined whether these genes are localized on the same chromosome. Results showed that they are located on different chromosomes. Several LHC genes were very closely located (<1 kb apart) and were predicted as target genes of the same TFs, for example, Lhcr4 and Lhcr12 on chromosome 1, Lhcf1, Lhcf2, Lhcf3, and Lhcf4 on chromosome 2, Lhcr13 and Lhcr14 on chromosome 15, and Lhcf5 and Lhcf11 on chromosome 24 (Figure 7;Supplemental Table S5).
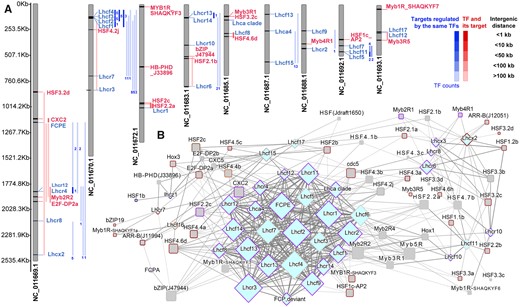
TFs targeting to the genes of light-harvesting proteins. A, Gene locations in the chromosomes and B, the network of TFs and predicted target genes by motif-based sequence analysis tools (CIS-BP_2.00/Arabidopsis_thaliana) of meme suite (https://meme-suite.org/meme/db/motifs). All predicted target genes are in Photosynthesis-antenna proteins pathway (ko00196). B, TFs shown here are those in Figure 5A marked with encircled numbers (① to ⑩). Node border color corresponds to the module of TFs (gray square) and target genes (diamond) in WGCNA shown in Figure 6.
Co-expression of TF genes and functional genes based on WGCNA
Because genes in the same regulatory cascade are likely to be co-expressed, we conducted WGCNA and examined the co-expression of functional genes and TF genes to detect potential targets of TFs and other functionally related gene groups. In total, 404 TF genes were found in WGCNA modules (Figure 6B). Fourteen models produced by WGCNA were subjected to KEGG enrichment analysis for assessing the potential functions of the genes in these models. Four modules (purple, midnightblue, violet, and siennas3) were more highly expressed in mFL5d and sFL5d compared to in CL5d (P < 0.05), while two modules (purple and violet) were more highly expressed in sHL1h compared to in CL5d (P < 0.05) (Figure 6B). Purple and siennas3 modules were enriched in both photosynthesis and fatty acid biosynthesis, and contained 40 TF genes of which 3 were hub genes (NAC, Phatr3_J50061; NAC, Phatr3_J50546; ARR-B, Phatr3_J47930). Purple and dark red modules were enriched in carbon fixation in photosynthetic organisms (Supplemental Table S4). Aureochrome1 and aureochrome4 were both hub genes in dark red modules. The genes shown in Figures 5, A and B, 6B, and 7B are listed in Supplemental Tables S3, S4, and S5.
Discussion
Extensive transcriptomic reprograming in the diatom for tackling severe light fluctuation and adaptive transcriptomic stability under mild light fluctuation
Marine diatoms are constantly faced with turbulent conditions as dominant pioneer bloom species. Diatoms demonstrate remarkable physiological flexibility to acclimate to complex and dynamic growth environmental conditions (Kooistra et al., 2007), which dominate in upwelling systems, and are regarded as successful photoautotrophs in the turbulent environment (Margalef, 1978). Interestingly, in our previous work, the mild level of light fluctuation, which was frequently used in terrestrial plant and freshwater alga research, had little effect on P. tricornutum PGR5 knockdown and overexpression strains (Zhou et al., 2021). However, photosynthesis and the growth of these strains are impacted by the severe light fluctuation in the ocean (between 100% and 1% of the saturated sunlight as mentioned above). These imply different acclimation mechanisms of diatom to mild light fluctuation (prevalent in the terrestrial ecosystem) and severe light fluctuation (typical in turbulent sea surface).
The general analyses (Figures 1, C and D and 2B; Supplemental Figure S2) showed different acclimation strategies of diatoms to different light fluctuation regimes. Diatoms adapt to a degree of light fluctuation as mFL5d elicited fewer DEGs or metabolites and less shifts in global transcription (relative to CL5d as the control), and activated corresponding unique mechanisms under extreme light fluctuations (different from high light). The different responses to mild and severe light fluctuations were also observed in the photosynthetic oxygen evolution (Figure 3, A and B). Our data also showed that P. tricornutum acclimatized in both constant light and mild light fluctuation could not achieve net photosynthetic oxygen production under severe light fluctuation. These suggest that diatoms under severely fluctuating environments such as regions or periods with strong wind, upwelling, or wave might have unique acclimation to maintain oxygen evolution and photosynthesis, and can improve physiologies as the fluctuation intensity decreases. In contrast, algae in calm or slightly fluctuating environments cannot quickly adapt and spread to the violently fluctuating region in the short term. Therefore, the natural marine light conditions, instead of land conditions, should be used in light fluctuation studies. Besides, our findings can inform modeling vertical biological–physical processes (Platt and Gallegos, 1980).
Photosynthetic organisms are believed to respond to excess light and light fluctuation through short-term (seconds to minutes) changes in proton gradient and photosystem activity on photosynthetic electron transport chain, and long-term (hours to days) changes in photosynthetic pigments and carbon metabolism through enzymes such as Rubisco (Long et al., 1994; MacIntyre et al., 2000; Larkum et al., 2003). Previous research focused chiefly on short-range photosynthetic mechanisms and little on the response of the downstream metabolism to light fluctuation (Jarvi et al., 2016; Mustila et al., 2016, 2021; Riediger et al., 2019; Schneider et al., 2019; Zhang et al., 2020; Qu et al., 2021), especially different light fluctuation intensities. Compared with constant light, few changes in marine diatom occurred under mild light fluctuation (Figures 1, C and D and 2B; Supplemental Figure S2), resulting from the flexible photosynthetic adaptation and involvement of mitochondria in diatom. Under severe light fluctuations on the sea surface, the notable changes were centered on photosynthesis, carbon and fatty acid metabolism pathways (Figures 2B, 3, and 4; Supplemental Table S4).
Roles of LHC proteins and proton gradient proteins in responding to light fluctuations
In studies of the light fluctuation in terrestrial plants and freshwater algae, chloroplast proteins in the photosynthetic electron transport have attracted the most attention. As mentioned above, proton gradient and photosystem activity on the photosynthetic electron transport chain were important short-term responses to light fluctuation.
Flavodiiron (FLV), PGR5/PGRL1, chloroplast NAD(P)H-dehydrogenase (NDH) complex, State Transition kinase 7 (STN7), ion transporters and channels, and terminal oxidases can protect photosystem I or II from damage and regulate photosynthetic electron transfer under rapid light change (Tikkanen et al., 2010; Grieco et al., 2012; Suorsa et al., 2012; Allahverdiyeva et al., 2013; Lea-Smith et al., 2013; Suorsa et al., 2013; Gerotto et al., 2016; Yamamoto et al., 2016; Yamori et al., 2016; Chaux et al., 2017; Acuna et al., 2018; Jokel et al., 2018; Nikkanen, 2018; Storti et al., 2018; Wada et al., 2018; Dann and Leister, 2019; Nawrocki et al., 2019; Yamamoto and Shikanai, 2019; Bellan et al., 2020; Storti et al., 2020; Tanabe et al., 2020; Hou et al., 2021; Ruhle et al., 2021) (Figure 8). Different from terrestrial plants and freshwater algae (Jokel et al., 2018), marine diatoms lack FLV and STN7, and seem to activate the unique response mechanisms only at sufficient light fluctuations based on our previous works of proton gradient proteins (Grouneva et al., 2016; Zhou et al., 2021). Similar to Arabidopsis (Schneider et al., 2019), PGR5 increased in P. tricornutum under short-term (1 h) light fluctuation, instead of PGRL1 (Figure 3). PGR5 plays a more critical role in light fluctuation in both diatoms (Zhou et al., 2020, 2021) and Arabidopsis (Suorsa et al., 2012; Yamamoto et al., 2016; Yamamoto and Shikanai, 2019), compared with PGRL1. The PSII activity (YII) also climbed under severe light fluctuation compared with mild light fluctuation, especially with decreases of PGR5 and PGRL1 protein levels in diatom (Zhou et al., 2020, 2021). This indicated the stable and robust resistance to mild light fluctuation and unique adaptation strategy under severe light fluctuation.
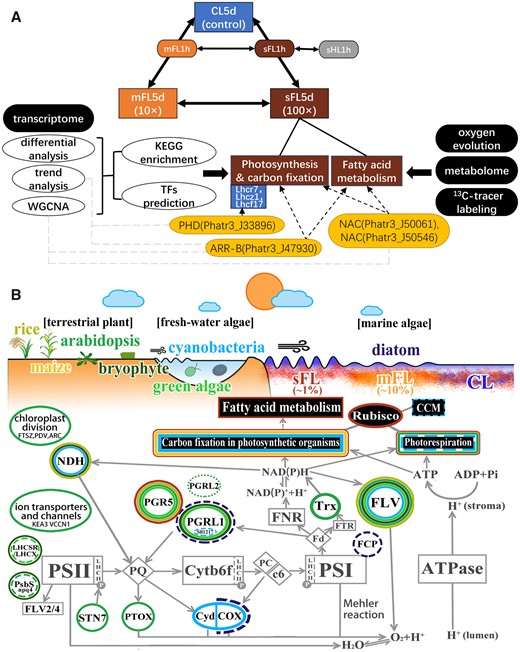
Acclimation in photosynthetic organisms to light fluctuation. A, Route of treatments, methods, transcriptional and metabolic responses to severe light fluctuation and potential important TFs in P. tricornutum characterized in this work. Solid arrows link TFs and their known binding target genes. Dashed arrows link TFs and genes in the same WGCNA module. B, Schematic of adaptive plasticity to habitat light fields in terrestrial, freshwater, to marine photosynthetic organisms. The white ellipses with colorful edges depict crucial proteins responding to light fluctuation, including FLV (Allahverdiyeva et al., 2013; Gerotto et al., 2016; Yamamoto et al., 2016; Chaux et al., 2017; Jokel et al., 2018; Storti et al., 2018, 2020; Wada et al., 2018), PGR5 (Suorsa et al., 2012; 2013; Yamamoto et al., 2016; Yamori et al., 2016; Jokel et al., 2018; Yamamoto and Shikanai, 2019; ZHou et al., 2021), PGRL1 (Storti et al., 2018; Zhou et al., 2020), PGRL1-like protein Sll1217 (Dann and Leister, 2019), PGRL2 (Ruhle et al., 2021), STN7 (Tikkanen et al., 2010; Grieco et al., 2012), THIOREDOXINS (Nikkanen, 2018; Hou et al., 2021), plastidial terminal oxidase (Nawrocki et al., 2019), the respiratory terminal oxidases (Cyd: cytochrome bd-type quinol oxidase; Cox: aa3-type cytochrome c oxidase) (Lea-Smith et al., 2013; Grouneva et al., 2016), NDH (Yamori et al., 2016; Acuna et al., 2018; Storti et al., 2020), FCP (Tanabe et al., 2020), LHXSR (Gao et al., 2021), npq-mutants lacking LHCX1 (Bellan et al., 2020), or PSBS (Grieco et al., 2012; Gao et al., 2021), ion transporters and channels (Armbruster et al., 2014, 2016; Li et al., 2021), and chloroplast division proteins (Dutta et al., 2017). Black rectangles with colorful edges depict pathways influenced by light fluctuation enriched in proteomes of cyanobacteria (Mustila et al., 2021), chloroplast in diatom (Grouneva et al., 2016), and transcriptomes of cyanobacteria (Mustila et al., 2016; Riediger et al., 2019; Mustila et al., 2021), Arabidopsis (Jarvi et al., 2016; Schneider et al., 2019), tomato (Zhang et al., 2020), maize (Qu et al., 2021), and diatoms (this study). Dashed outline represents an ambiguous function under fluctuating light. White rectangles with gray edges represent key proteins or complex in the electron transport chain. The color of the edge corresponds to the color of the species name or treatment in this work. CL: constant light condition (80 μmol m−2 s−1); mFL: mildly fluctuating light condition (80–800 μmol m−2 s−1); sFL: severely fluctuating light condition (20–2,000 μmol m−2 s−1).
The light-harvesting protein complexes are distributed around the photosystem for absorption and transfer of light energy as well as response to light stresses. The rearrangement of FCP complexes is of vital importance under light stress of diatom (Derks et al., 2015; Wang et al., 2019). The light-harvesting proteins in diatoms include Lhcf, Lhcr, Lhcx, Lhca, and Lhcz. Lhcf is the major light-harvesting group, whereas Lhcr and Lhca mainly act as PSI antenna. Lhcx are the homologs of Lhcsr and can be induced by high light stress, and Lhcz is universal in secondary endosymbionts (Büchel, 2015; Büchel, 2020) (Supplemental Figure S4). LHC proteins are the critical proteins responding to various light stresses (Siaut et al., 2007; Gillard et al., 2008; Maheswari et al., 2009; Nymark et al., 2009; Bailleul et al., 2010; Park et al., 2010; Zhu and Green, 2010; Depauw et al., 2012; Taddei et al., 2016). The spectral composition of FCP in diatoms can be changed under light fluctuations, suggesting that FCP protein may play an essential role in the response to light fluctuation (Tanabe et al., 2020). Lhcr 6, Lhcr 8, and Lhcr 10 were shown to be induced by high light (Nymark et al., 2009) and were consistent in this work (Supplemental Figure S4). Four LHC proteins (Lhcr7, Lhcz1, Lhcf17, and Lhcf16) were higher than high light under mild and severe light fluctuations, and three of them were predicted to be regulated by PHD (Phatr3_J33896), which were induced by light fluctuation, and can be the key proteins responding to light fluctuation (Supplemental Figure S4). In addition, levels of DXS in the plastid MEP pathway, a light-induced enzyme related to photoprotection by promoting carotenoids synthesis, increased under severe light fluctuation (Athanasakoglou and Kampranis, 2019). The severe fluctuation between a dim light and saturated sunlight may stimulate these light-dependent genes strongly. Therefore, light harvesting proteins in diatoms likely also play roles in responding to severe light fluctuation.
Modulation of carbon flow preferentially toward fatty acid biosynthesis by severe light fluctuation
Our results showed that most fatty acids are stored and accumulated in P. tricornutum under long-term severe light fluctuations (Figure 4). Diatoms are rich in lipids (Chisti, 2007; Levitan et al., 2014; Wu et al., 2014). It has been shown that high light induced increases in fatty acids, while low light induced an increased proportion of unsaturated fatty acids (Orcutt and Patterson, 1974). Oxylipins, an oxidized product of lipids, serve as a grazing deterrent, hence a defense mechanism, and can regulate the expression of Lhcf proteins (Islam et al., 2020). Oxylipins are also important signaling molecules between organisms (Pohl and Kock, 2014) or within cells (Muñoz and Munné-Bosch, 2020). It has been shown that oxylipins in diatom are a potential chemical signal for regulating community structure (Russo et al., 2020). Our data showed that the abundance of oxylipins increased in severe light fluctuation, suggesting a role in signaling in light responses. The observed decrease in long-chain polyunsaturated fatty acids (C22) can be attributed to consumption under stress, oxidation to oxylipins or downregulation for faster energy utilization (Li et al., 2016), and enhanced immune function (Kutschera et al., 2019) (medium- and short-chain fatty acids). All these show that this diatom may adopt different strategies of fatty acid storage, utilization, and oxylipins signaling between different light fluctuation intensities. The elevation of lipid abundance seemed to occur at the expense of amino acid and protein synthesis because the latter decreased under severely fluctuating light conditions, as indicated by our transcriptomic data (Figure 5).
High lipid synthesis requires active photosynthetic carbon fixation. In long-term (several days) severe light fluctuation, the LHC may take a low light strategy for stabilized photosynthesis efficiency and photoprotection. Benefiting from the carbonic anhydrase-based carbon concentrating mechanism, diatoms have much lower content of Rubisco than plants (Young et al., 2016). Our data showed P. tricornutum enhanced Rubisco expression, Calvin cycle, and photorespiration in response to long-term light fluctuation, especially severe light fluctuation (Figure 3;Supplemental Figure S3). The increased gene expression of FNR (Ferredoxin NADP Reductase) and ATPase in the light reaction can provide more NAD(P)H and ATP to support carbon fixation (Figures 3 and 8). In cyanobacteria, Arabidopsis, and maize, in addition to photosynthesis, core pathways functionally around Rubisco, including carbon dioxide-concentrating mechanisms (CCM) (CA and C4-like), the Calvin cycle (C3), and photorespiration (C2) (Jarvi et al., 2016; Schneider et al., 2019; Mustila et al., 2021; Qu et al., 2021), changed in response to light fluctuations. However, CCM and C4 enzymes did not change expression levels in P. tricornutum under light fluctuations (Supplemental Figure S4), but their expression decreased in cyanobacteria under light fluctuations (Mustila et al., 2016). Genes in the Calvin cycle, especially Rubisco, was enhanced under severe light fluctuations in P. tricornutum (Figure 3), compared with that under mild light fluctuations in cyanobacteria (Mustila et al., 2021) and in P. tricornutum observed in this study, suggesting that Rubisco is also important in the response to severe light fluctuation in diatoms. The increased enzymes associated with Rubisco included phosphoribulokinase that catalyzes the production of RuBP (the substrate of Rubisco) from RuP, phosphoglycolate phosphatase (PGLP) that catalyzes the conversion of 2-phosphoglycolate into glycolate and phosphate, and GDC that produce CO2. In Arabidopsis, PGLP and P-protein of glycine decarboxylase are also increased under light fluctuations (Jarvi et al., 2016). It has been shown that carbon metabolism (including carbon fixation and photorespiration) is crucial in response to excess light (Long et al., 1994; MacIntyre et al., 2000; Larkum et al., 2003; Xie et al., 2016). It seems to be also crucial in P. tricornutum for response to excess energy under the severe light fluctuation regime (Figures 3 and 8). The increased CO2 assimilation under severe light fluctuation can also be reflected in oxygen evolution (Figure 3A). Isotopic tracers of absorbed inorganic carbon showed that under this condition, the increased assimilated carbon was flowing to fatty acids (Figure 4;Supplemental Figure S5).
TFs regulating photosynthesis and fatty acid metabolism under light fluctuations
Metabolic changes in response to light fluctuations are regulated by gene expression shifts, which in turn are regulated by TFs and promoter elements of the genes. Diatoms can have unique mechanisms to sense and respond to environmental changes, especially dynamic light stresses. Best acclimation to highly variable light conditions implies that diatoms could perceive and respond to light changes. Specific TFs under light fluctuation were found with light-sensitive domains and targets belonging to LHC proteins. Interestingly, the core TF in cyanobacteria that respond to light fluctuation was also associated with photosynthesis (Riediger et al., 2019).
The PAS is a superfamily of domains sensitive to light changes and associated with circadian rhythm (McIntosh et al., 2010). Light, oxygen, and voltage (LOV) is one of them, which acts as a sensor module of photoreceptor of blue light (Ogura et al., 2008; Ishikawa et al., 2009) and occurs in aureochromes, which belong to the bZIP family. TFs with bHLH_PAS domain or bZIP_PAS domain (aureochrome 2) are more likely to perceive light fluctuation signals and regulate downstream genes. Interestingly, all the aureochromes RNA level in P. tricornutum did not change under blue light (Rayko et al., 2010), which can activate the transcription of genes such as cyclin (Huysman et al., 2013; Matiiv and Chekunova, 2018; Mann et al., 2020) and are essential to faster growth and high light acclimation (Costa et al., 2013). The aureochromes of diatom are considered nonredundant (Mann et al., 2017). Our results suggest that four aureochromes of P. tricornutum have different responses to light fluctuations. Increased aureochrome 2 may enhance the sensitivity of the cells to light under severe light fluctuation for more effective light utilization and photoprotection (Figure 5A;Supplemental Table S3).
It should be noted that the TFs with light-related domains were predicted to target photosynthetic antenna protein genes mainly. As mentioned above, Lhcr7, Lhcz1, and Lhcf17 are more likely to be activated by the PHD protein under light fluctuations. These TFs targeting photosynthetic proteins can be involved in the acclimation network of diatoms under light fluctuation stress. Moreover, as shown in our chromosome localization analysis, genes and TFs co-expressed seem to be localized in the same chromosome (Figure 7A), suggesting that they are co-regulated and have related functions.
Besides potential binding sites in photosynthetic antenna proteins, severe TFs also were predicted to regulate carbon and fatty acid metabolism (Figure 8B). WGCNA was useful for investigating the functions of TFs in photosynthesis, fatty acid metabolism, and acclimation to severe light fluctuation (Figures 6B, 7B, and 8B). From the analysis, six TFs were found to regulate fatty acid metabolism, and BHLH2_PAS was found to regulate Rubisco genes, all of which were highly expressed under fluctuating light (Figures 5A, 6B, and 8B). The TF and target gene transcriptional profile in concert indicated that carbon and fatty acid metabolism was elevated under light fluctuations.
The light response domain and antenna target of the TFs revealed that light fluctuation is a typical and unique light stress for diatoms. The work reported here supplements data of TFs under light fluctuation and predicts their potential functions for further experimental studies in the future.
Conclusions
Compared with constant light and mild light fluctuation, P. tricornutum showed a series of complex responses to optimize their acclimation and growth under severe light fluctuations, demonstrating its remarkable flexibility to dynamic light conditions. Under severely fluctuating light, differentially expressed antenna proteins and potential TFs can enhance photosynthesis and maintain oxygen evolution. Enhanced carbon metabolism and accumulated fatty acid can support energy storage and stress response under severe light fluctuation. Our work paves the way for the subsequent exploration of the specific acclimation mechanism of diatoms to light fluctuation.
Materials and methods
Culture condition
Phaeodactylum tricornutum strain (IOCAS-001) (Huang et al., 2015) was cultured in sterile artificial seawater containing of f/2 medium (Guillard and Ryther, 1962) under 20°C ± 1°C and 12-h light:12-h dark cycle. A master culture grown under this condition was split into six groups (CL5d, mFL5d, sFL5d, sHL1h, mFL1h, and sFL1h), which were treated with different light regimes (Figure 1A). The first was exposed to constant light (80 μmol m−2 s−1) for 5 days (CL5d), the second to mild light fluctuation (800 μmol m−2 s−1 for 1 min after every cycle of 80 μmol m−2 s−1 for 5 min) for 5 days (mFL5d), the third to severe light fluctuation (2,000 μmol m−2 s−1 for 1 min after every 20 μmol m−2 s−1 for 5 min) for 5 days (sFL5d), the fourth to the same mild light fluctuation regime as in mFL5d for 1 h after CL5d treatment (mFL1h), the fifth to the same severe light fluctuation as in sFL5d for 1 h after CL5d treatment (sFL1h), and the sixth to constant high light (2,000 μmol m−2 s−1) for 1 h after CL5d treatment (sHL1h). Light intensity of treatments and circulating time relay circuit are shown in Figure 1, A and B. Every treatment has six samples for metabolome and three samples for transcriptome. Every treatment included three biological repeats. On the fifth day of the respective treatments, cells were harvested by centrifugation at 10,000g for 1 min and quickly frozen in liquid N2 for transcriptomic and metabolome. To investigate how the acclimation to constant light, mildly and severely fluctuating light (groups of CL5d, mFL5d, and sFL5d) results in physiological characteristic, 13C isotope labeling experiments and oxygen evolution measurement (three groups measured under two conditions: mild light fluctuation and severe light fluctuation) (Figure 1A).
Oxygen content measurement
Cultures of CL5d, mFL5d, and sFL5d treatments were collected in the exponential growth stage by centrifugation at 2,500g for 5 min, and concentrated to the absorbance value at 730 nm of 1.0. The rate of oxygen production was measured using the Chlorolab-2 liquid-phase oxygen measurement system (Hansatech, England). The programs were set to mild light fluctuation (Figure 3B) or severe light fluctuation (Figure 3A) as the cultured conditions after dark acclimation for 5 min.
RNA extraction and sequencing
Total RNA was extracted from the frozen harvested cells using a Trizol kit (Invitrogen, Carlsbad, CA, USA). RNA quantity and quality were inspected by 2100 Bioanalyzer (Agilent, Palo Alto, CA, USA) and electrophoresis. mRNA was isolated using Beads Oligo (dT), fragmented and reverse transcribed. The cDNA was ligated to the Illumina adapter after purified, end-repaired and poly(A)-added. The libraries were sequenced by Illumina HiSeq2500 of Gene Denovo Biotechnology Co. (Guangzhou, China). The GATK (version 3.4-46) (Shannon et al., 2003) was used for calling variants of transcripts, ANNOVAR was used for SNP (single nucleotide polymorphisms)/InDel (insertion-deletion polymorphisms) annotation. All the RNA of 18 samples (6 treatments each with three biological repeats and each replicates included 3 samples) were extracted and run on a single Illumina Lane.
RNA-seq bioinformatics analysis
The reads containing adapters, unknown nucleotides (>10%) or low-quality bases (>50%, Q-value ≤ 20) were removed by fastp (version 0.18.0) (Chen et al., 2018). Ribosome RNA reads were removed after alignment by Bowtie2 (version 2.2.8) (Langmead and Salzberg, 2012). The clean reads were assembled and mapped to the genome of P. tricornutum (NCBI-Assembly: ASM15095v2) using HISAT2. 2.4 (Kim et al., 2015) under default parameters. Sample mapped reads were assembled by StringTie version 1.3.1 (Pertea et al., 2015, 2016) and fragments per kilobase per million mapped fragments was used to quantify expression level. Expression differences were analyzed using DESeq2 (Love et al., 2014) between groups and edgeR (Robinson et al., 2010) within group (FDR < 0.05, absolute fold change ≥2). Gene expression and annotation were shown in Supplemental Table S7. Roche Expand High Fidelity Enzyme mix and TAKARA PrimeScript RT Master Mix (Perfect Real Time) were used for qPCR. PCA, co-expression networks (WGCNA package version 1.47) (Langfelder and Horvath, 2008) were performed using R version 4.2.0. Total 168 transcriptomes were used for WGCNA analysis, 18 transcriptomes were from this work (PRJNA820474) and others were from published transcriptomes of P. tricornutum (five samples generated with a research focus on phosphorus nutrition responses, GSE66997; Cruz de Carvalho et al., 2016; Cruz de Carvalho and Bowler, 2020); 49 samples generated with a research focus on iron responses, SRP069841 (Smith et al., 2016); 66 samples generated with a research focus on nitrogen nutrition responses, PRJNA311568 (McCarthy et al., 2017); 30 samples generated with a research focus on light responses, GSE95565 (König et al., 2017)). All these transcriptomes were used after converting to Log2Fold-Change (compared to mean of corresponding control sample) and unification of gene identifiers (Ashworth et al., 2016; Ait-Mohamed et al., 2020). Hub genes were defined as |kME| > 0.8 (kME, module eigengene-based connectivity). Trend analysis was performed using Short Time-series Expression Miner (Ernst and Bar-Joseph, 2006). Location of genes on chromosomes were mapped using TBtools (Chen et al., 2020), and networks were drawn on cytoscape_v3.6.0 (Shannon et al., 2003). Gene property and function classification were annotated by Gene Ontology (GO) enrichment (Ashburner et al., 2000), and gene interaction and certain biological function was annotated by KEGG pathway enrichment (Kanehisa and Goto, 2000). Both P-value of GO and KEGG analysis underwent FDR Correction (FDR ≤ 0.05).
Analysis of TFs
To maximize the discovery of TFs from P. tricornutum for downstream analysis, three analyses were carried out. First, TF annotation was performed using the PlantTFDB database (Jin et al., 2014), yielding 152 TFs that belonged to 23 families. Second, these TF sequences were aligned with TFs of the model plant Arabidopsis (A. thaliana) (E-value < 10e-5). This resulted in 342 TFs genes homologous to Arabidopsis TFs that belonged to 24 families. Third, these TFs were combined with previously reported TFs (Rayko et al., 2010), with redundancy removed, to generate a Phatr_TFs dataset within 435 TFs.
To predict the target genes of Phatr_TFs, these TF sequences were aligned with TFs of the model plant Arabidopsis on motif-based sequence analysis tools fimo of meme suite (https://meme-suite.org/meme/doc/fimo.html) (Grant et al., 2011). The TF binding site was predicted using 2-kb upstream region of the transcript as the promoter aligning with the database of JASPAR (plants-A. thaliana, https://jaspar.genereg.net/) and Motif Databases of meme suite (CIS-BP_2.00/Arabidopsis_thaliana, https://meme-suite.org/meme/db/motifs) (Bailey and Elkan, 1994). The predicted target genes in Photosynthesis–antenna proteins pathway (ko00196) and related TFs were shown in Figure 7.
13C labeling and analysis
NaH13CO3 (0.17 g L−1) was added on the first day of the light treatment experiment for fatty acid labeling or an hour after the fifth day for amino acid labeling. Prior to adding the tracer, cells were washed and resuspended into artificial seawater without inorganic carbon. The labeled algal cells were collected using centrifugation and snap frozen in liquid nitrogen. Protein was hydrolyzed into amino acids with 6M HCl at 110°C for 12 h and then dried before derivatization. Pyridine and MTBSTFA were added for derivatization of amino acids. After reaction at 85°C for 1 h and centrifugation, the supernatant was collected. The standard of tripalmitin and sample were extracted with 3-mL hexane. N-butylamine was added for derivatization of fatty acids at 70°C for 48 h. The reaction was terminated with 4-M HCl. GC–MS (Gas Chromatography-Mass Spectrometer) analysis and the calculation of mass distribution vector (MDV) and fractional labeling (FL) were carried out as previously reported (Nanchen et al., 2007; Huang et al., 2015). ANOVA and Duncan post-hoc tests (P < 0.05) were used for significant difference analysis by IBM SPSS statistics version 25.0.
Metabolite extraction and LC–MS/MS
Sample (50 mg) with extract solvent (1,000 μL, acetonitrile: methanol: water, 2:2:1, containing internal standard) was vortexed for 30 s, repeated 3 times for homogenizing at 45 Hz for 4 min and sonicating in an ice-water bath for 5 min. Then the sample was incubated at 20°C for 1 h and centrifugated at 16,000g and 4°C for 15 min. The supernatant (200 μL) was transferred to a vial (2 mL) for LC–MS using Agilent 1290 UHPLC system with a UPLC HSS T3 column (2.1 mm × 100 mm, 1.7 μm, Waters, Milford, MA, USA) coupled to Q Exactive Orbitrap MS (Thermo Fisher Scientific, Waltham, MA, USA). The mobile phase A was 0.1% (v/v)formic acid in water for positive, and 5-mM ammonium acetate in water (pH: 9.0, regulated with ammonia) for negative, and the mobile phase B was acetonitrile. The elution gradient of mobile phase B was set as follows: 0 min, 1% (v/v); 1 min, 1% (v/v); 8 min, 99% (v/v); 10 min, 99% (v/v); 10.1 min, 1% (v/v); 12 min, 1% (v/v). The flow rate was 0.5 mL min−1 and the injection volume was 1 μL. MS/MS spectra were obtained from an information-dependent basis during the experiment, the full scan survey MS data was evaluated continuously by e Xcalibur 4.0.27 (Thermo). ESI source conditions were set as the following: Spray Voltage as 3.8 kV (positive) or −3.1 kV (negative), respectively; Capillary temperature as 320°C; Sheath gas flow rate as 45 Arb; Aux gas flow rate as 15 Arb; Full MS resolution as 70,000; MS/MS resolution as 17,500; Collision energy as 20/40/60 eV in NCE model; Scanning rate at 7 Hz.
Metabolite annotation
The original data of metabolome was converted to the mzML format using ProteoWizard. The alignment of retention time, detection and matching of peak were processed using XCMS. Then the data were filtered and normalized (Roberts et al., 2012). Finally, the matrix containing the retention time, mass-to-charge ratio and peak intensity was obtained. Peak annotation was processed using OSI-SMMS software (version 1.0, https://www.chemdatasolution.com/2019/04/16/pro-2/). Metabolite content in metabolome was shown in Supplemental Table S7.
Accession numbers
Sequence data from this article can be found in the GenBank data libraries under accession number PRJNA820474. The accession numbers of the major genes/proteins mentioned in this paper: aureochrome1 (Phatr3_J8113), aureochrome2 (Phatr3_J12346), aureochrome3 (Phatr3_J15977), and aureochrome4 (Phatr3_J15468). Information and genes mentioned in our study are also available for download from GenBank/EMBL data libraries (GenBank GCA_000150955.2/ASM15095v2).
Supplemental data
The following materials are available in the online version of this article.
Supplemental Figure S1. The RNA-seq results of 10 genes were verified by qPCR.
Supplemental Figure S2. Venn diagram of gene expression and metabolites (FPKM > 2).
Supplemental Figure S3. RNA and protein level of Rubisco under treatments.
Supplemental Figure S4. Gene expression heat map of light-harvesting proteins, chitin metabolism proteins, and CCM.
Supplemental Figure S5. The 13C FL enrichment of amino acids and glucose.Figure 9
Supplemental Table S1. Gene list of upregulated genes and downregulated genes (FDR < 0.05, absolute fold change ≥2).
Supplemental Table S2. Gene numbers and q-value of the KEGG enrichment of network in Figure 2B.
Supplemental Table S3. Information of trend analysis.
Supplemental Table S4. Gene list, sample relation and KEGG enrichment of modules in WGCNA in Figure 6.
Supplemental Table S5. Node and edge information for the network in Figure 7B.
Supplemental Table S6. Gene list of Venn diagram in Supplemental Figure S2 (FPKM > 2).
Supplemental Table S7. Gene expression and annotation in transcriptome, and metabolite content in metabolome of each sample.
Funding
This work was supported by the National Key R&D Program of China (2018YFD0901500), the Key Deployment Project of the Centre for Ocean Mega-Research of Science, the Chinese Academy of Sciences (COMS2019Q02), the Research Fund for the Taishan Scholar Project of Shandong Province (tspd20210316), the Shandong Provincial R&D Program (2018GHY115019), the Distinguished Young Scientists Research Fund of the Key Laboratory of Experimental Marine Biology, the Chinese Academy of Sciences (No. KLEMB-DYS02), and the National Natural Science Foundation of China. (41676157 and 41976097).
Conflict ofinterest statement. The authors have no conflict of interest.
These authors contributed equally (L.Z. and S.G.).
L.Z., S.G., and G.W. conceived and designed the experiments. L.Z., S.G., and S.W. conducted the experiments of cultures. W.Y., X.W., and X.X. conducted the experiments of oxygen evolution. W.Y. and L.H. conducted the experiments of tracer labeling. L.Z., S.G., W.Y., S.L., and G.W. analyzed the data. L.Z., S.G., S.L., and G.W. organize the results and draw figures. L.Z. and S.G. drafted the manuscript. L.Z., S.G., S.L., and G.W. modified the manuscript and all authors approved.
The author responsible for distribution of materials integral to the findings presented in this article in accordance with the policy described in the Instructions for Authors (https://dbpia.nl.go.kr/plphys/pages/general-instructions) is Guangce Wang ([email protected]).
