


Abstract
G724S is a rare mutation induced by different generations of tyrosine kinase inhibitors (TKIs). No clinical effective drugs toward G724S mutation have been reported till now. We analyzed the interaction of three drugs (afatinib, gefitinib, osimertinib) with epidermal growth factor receptor (EGFR) from three aspects: the spatial structure of the binding region, the scoring function value, and the interaction force between drug molecules and active center of EGFR. Our results indicate that afatinib remains effective to patients with EGFR Exon19Deletion(Ex19Del) and G724S mutations whereas osimertinib and gefitinib are not, which is consistent with other reports. Afatinib is reported to be effective against G724S mutation, but no long-term clinical survival has been reported till now. A patient with stage IV adenocarcinoma was found to have Ex19Del/G724S mutation. Treated with afatinib, he received a progression-free survival of more than 1 year. With the guidance of this case report, we provide the clinical evidence of using afatinib for patients with G724S mutations and obtaining long-term clinical survival.
Guided by protein-drug docking, afatinib is more effective to EGFR G724S mutation compared with osimertinib and gefitinib.
A patient with Ex19Del/G724S mutation obtained long-term survival with afatinib treatment.
Introduction
It has been reported that epidermal growth factor receptor (EGFR) exon 18 G724S mutation is an extremely rare, individualized mutation induced by different generations of EGFR–tyrosine kinase inhibitors (TKIs) [1]. A previous case report of a patients with a G724S mutation showed a remarkable response to the combination of afatinib and osimertinib in 2017; however, tumor progressed rapidly in less than 3 months [1]. In the last half year, there have been several clinical cases that reported that afatinib was effective to G724S mutation [2–5], which is consistent with our results. In this manuscript, under the guidance of molecular docking results, we presented a patient with acquired Exon 19 Deletion(Ex19Del)/G724S mutation who was treated with afatinib and obtained long-term clinical benefit of more than 20 months till now.
Case Report
A 45-year-old man diagnosed with stage IV lung adenocarcinoma with EGFR Ex19Del mutation accepted oral gefitinib treatment (250 mg/q.i.d.) from April 2015. Computed tomography (CT) scan showed multiple nodules in both lungs. The patient acquired ongoing clinical benefit during 2015 to 2019 without long distance metastasis. In August 2019, CT scan showed enlargement of tumor size. We then performed needle biopsy of lung cancer and rechecked gene mutations to find the resistance mechanism. A rare gene mutation G724S in exon 18 was found. We then performed structural simulation, molecular docking, and interaction analysis between drug molecules and target EGFR protein. Based on our research, we used afatinib 40 mg once a day for this patient from September 2019. The surveillance scan after initiation of afatinib treatment revealed that the mass decreased, which meant afatinib was effective. Until now, the disease is still kept well with progression-free survival more than 20 months. The timeline and curative effect of treatment are displayed (Fig. 1).
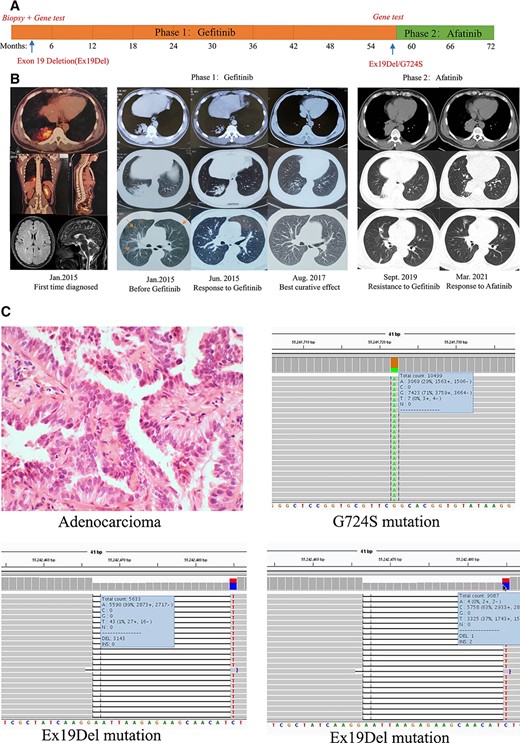
(A): Timeline of treatment. (B): Computed tomography scan images of the patient's clinical course. (C): Pathology and gene tests results.
Abbreviation: Ex19Del, Exon 19 Deletion.
Materials and Methods
The tertiary structure models of the EGFR kinase domain mutants (Ex19Del and Ex19Del/G724S) were generated through the Iterative Threading ASSEmbly Refinement, and Protein Data Bank identification (PDB ID) 2GS6 was applied as a modeling template (supplemental online data 1 and 2). The molecular docking uses GOLD5.2 software (The Cambridge Crystallographic Data Centre, CCDC). The scoring function is the Goldscore and ASP (the Astex Statistical Potential). The genetic algorithm parameter selects the default value, and conformation with the highest score for each ligand is retained. The interaction analysis between drug molecules and target EGFR protein uses Ligplot (European Bioinformatics Institute, Cambridge, U.K.). The molecular three-dimensional structure analysis and drawing use Pymol (Schrödinger, Inc., New York, NY).
Results
We superimposed 2GS6 on the predicted protein models and found that the active center (Adenylate triphosphate, ATP analog-peptide binding site) of 2GS6 has a gap. The mutant amino acid at 724 site is also at this position; so, we speculate that this is the active center of the kinase domain of mutants (Ex19Del and Ex19 Del/G724S) (Fig. 2A, 2B). This manuscript explored the interaction between afatinib, gefitinib, or osimertinib, and EGFR mutants through molecular docking. We used GOLD5.2 to dock afatinib, osimertinib, and gefitinib with EGFREx19Del and EGFREx19Del+G724S respectively (See details in supplemental online data 3). The statistical results of scoring function are listed in Table 1. The docking scoring function value of afatinib with EGFREx19Del and EGFREx19Del+G724S did not change much, whereas the scoring function values of osimertinib, and gefitinib with EGFREx19Del+G724S were significantly lower than those with EGFREx19Del. This suggests that afatinib can still have a strong interaction with EGFR after G724S mutation whereas osimertinib and gefitinib cannot. Through further inspecting molecular docking poses, we found that afatinib can partially penetrate into the active center of EGFREx19Del+G724S (Fig. 3A, 3B), whereas neither osimertinib nor gefitinib can (Fig. 3C–F). To further confirm these differences, we analyzed the interaction force between the drug molecules and the target protein through Ligplot. The results showed that the number of amino acids that interact with afatinib in the binding region of EGFREx19Del and EGFREx19Del+G724S remains basically the same (Fig. 4A, 4B), implying afatinib can still bind to EGFR after secondary G724S mutation. However, compared with EGFREx19Del, the number of amino acids in the binding region of EGFREx19Del+G724S that can interact with osimertinib and gefitinib is greatly reduced (Fig. 4C–F), which indicates that osimertinib and gefitinib cannot bind well to G724S mutant EGFR.
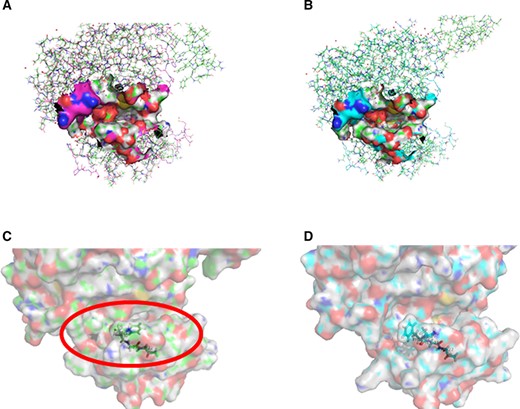
Structural simulation of the active center of epidermal growth factor receptor (EGFR) kinase domain mutants. (A): Superposition diagrams of EGFRExon19Deletion(Ex19Del) on 2GS6. (B): Superposition diagrams of EGFREx19Del+G724S on 2GS6. (C): The enlarged image of the active center of EGFREx19Del. (D): The enlarged image of the active center of EGFREx19Del+G724S.
Scoring results of docking afatinib, osimertinib, and gefitinib with EGFR kinase domain mutants molecules, respectively
| Drug | EGFREx19Del | EGFREx19Del+G724S | ||
|---|---|---|---|---|
| Goldscore | ASP | Goldscore | ASP | |
| Osimertinib | 68.66 ± 2.82 | 24.08 ± 4.05 | 66.57 ± 6.10 | 26.20 ± 4.20 |
| Gefitinib | 56.45 ± 7.22 | 32.26 ± 4.98 | 56.23 ± 3.88 | 26.88 ± 1.93 |
| Afatinib | 56.09 ± 11.40 | 20.36 ± 7.60 | 56.02 ± 3.63 | 25.49 ± 3.64 |
Abbreviations: ASP, the Astex Statistical Potential; EGFR, epidermal growth factor receptor; Ex19Del, Exon 19 Deletion.
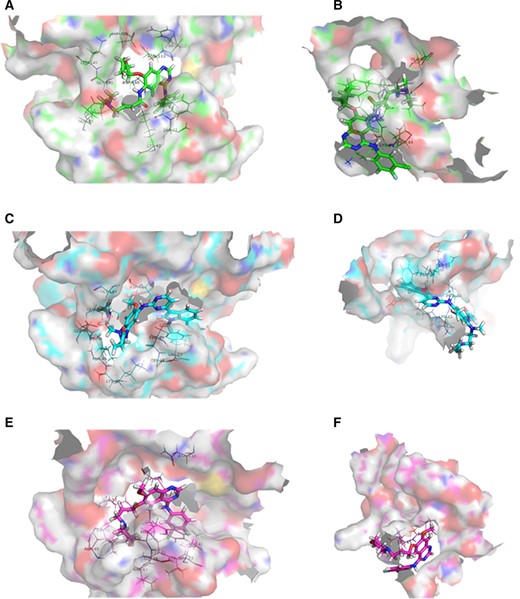
Diagrams of molecular docking poses between individual drugs and epidermal growth factor receptor (EGFR) kinase domain mutants. (A): Afatinib with EGFRExon 19 Deletion(Ex19Del). (B): Afatinib with EGFREx19Del+G742S. (C): Osimertinib with EGFREx19Del. (D): Osimertinib with EGFREx19Del+G724S. (E): Gefitinib with EGFREx19Del. (F): Gefitinib with EGFREx19Del+G724S.

Diagrams of the interaction of afatinib, osimertinib, and gefitinib with epidermal growth factor receptor (EGFR) kinase domain mutants. The intermolecular interaction and strength (including hydrogen bond, hydrophobic interaction, and atomic accessibility) are shown. The hydrogen bond is represented by a green dashed line. Spokes radiating to ligand indicates hydrophobic interaction. (A): Afatinib with EGFRExon 19 Deletion(Ex19Del). (B): Afatinib with EGFREx19Del+G742S. (C): Osimertinib with EGFREx19Del. (D): Osimertinib with EGFREx19Del+G742S. (E): Gefitinib with EGFREx19Del. (F): Gefitinib with EGFREx19Del+G742S.
Altogether, we believe that the spatial structure of the binding region of EGFREx19Del has changed because of the mutation of amino acid 724 (Gly→Ser). By observing the conformation of the active center of EGFR kinase domain mutants, we found that the opening of EGFREx19Del+G724S active center becomes smaller than EGFREx19Del (Fig. 2C, 2D), which might cause osimertinib and gefitinib fail to enter the active center (Fig. 3D, 3F), resulting in drug-resistance. Different from the other two drugs, afatinib has two side chains on the naphthalene ring. This unique structure may allow afatinib to partially enter the active center of G724S-mutant EGFR and bind to it stably (Fig. 2B).
Discussion
Li et al. [6] reported five cases of G724S mutation out of 1,170 patients with non-small cell lung cancer (NSCLC; 0.43%). All of them were emerging after first-generation TKIs, but the G724S mutation frequencies varied drastically. Fassunke et al., [7] also reported four cases with G724S mutation. Half of them acquired G724S mutation after third-generation TKIs and half after first-generation TKIs. It can be assumed that G724S mutation is an extremely rare individualized mutation induced by different generations of EGFR-TKIs. There are studies about structure and mechanisms and cell line experiment supporting that afatinib is effective to patients with G724S mutations. Brown et al. applied the molecular mechanics-generalized Born surface area method (Molecular Mechanics/Generalized Born Surface Area, MM/GBSA) to compute the binding free energies of osimertinib and afatinib with G724S, consistent with Fassunke et al. [7], afatinib relative binding free energies are less affected by G724S versus Osimertinib [8]. Our molecular docking results also indicate that afatinib remains effective to patients with EGFREx19Del+G724S mutations whereas osimertinib and gefitinib not. All of them are consistent with our results. Therefore, we applied afatinib to a patient with EGFREx19Del+G724S mutation and acquired great curative effect.
Conclusion
This case report increases the evidence of that G724S mutation should be another acquired resistance mechanism after first-line gefitinib treatment, and afatinib can be regarded as an effective way for patients with EGFR-G724S mutation and NSCLC. However, more clinical data for patients with NSCLC harboring G724S mutation are required to provide more powerful evidence.
Glossary of Genomic Terms and Nomenclature
Ex19Del: Exon 19 Deletion
TKIs: tyrosine kinase inhibitors
CT: computed tomography
PBD ID: Protein Data Bank identification
ASP: the Astex Statistical Potential
ATP: adenylate triphosphate
MM/GBSA: molecular mechanics/generalized born surface area
Author Contributions
Conception/Design: Kewei Ma
Provision of study material or patients: Yinghui Xu, Xu Wang
Collection and/or assembly of data: Nian Yu
Data analysis and interpretation: Chao Sun, Shi Qiu, Ye Guo, Miao Bai, Yanxin Huang
Manuscript writing: Nian Yu
Final approval of manuscript: Nian Yu, Yinghui Xu, Xu Wang, Chao Sun, Shi Qiu, Ye Guo, Miao Bai, Yanxin Huang, Kewei Ma
Disclosures
The authors indicated no financial relationships.
References
Author notes
Co-first authors
Disclosures of potential conflicts of interest may be found at the end of this article.
