


Abstract
Globally, 1 in 3 children under 5 years is undernourished or overweight, and 1 in 2 suffers from hidden hunger due to nutrient deficiencies. As children spend a considerable time at school, school-based policies that aim to improve children’s dietary intake may help address this double burden of malnutrition.
This systematic review aimed to assess the effects of implementing policies or interventions that influence the school food environment on children’s health and nonhealth outcomes.
Eleven databases were searched up to April 2020 and the World Health Organization (WHO) released a call for data due in June 2020. Records were screened against the eligibility criteria, and data extraction and risk-of-bias assessment were conducted by 1 reviewer and checked by another. The synthesis was based on effect direction, and certainty of evidence was assessed using the GRADE (Grading of Recommendations Assessment, Development and Evaluation) approach.
Seventy-four studies reporting 10 different comparisons were included. The body of evidence indicates that interventions addressing the school food environment may have modest beneficial effects on certain key outcomes. Nutrition standards for healthy foods and beverages at schools, interventions that change how food is presented and positioned, and fruit and vegetable provision may have a beneficial effect on the consumption of healthy foods and beverages. Regarding effects on the consumption of discretionary foods and beverages, nutrition standards may have beneficial effects. Nutrition standards for foods and beverages, changes to portion size served, and the implementation of multiple nudging strategies may have beneficial effects on energy intake. Regarding effects of purchasing or selecting healthier foods, changes to how food is presented and positioned may be beneficial. This review was commissioned and supported by the WHO (registration 2020/1001698-0). WHO reviewed and approved the protocol for the systematic review and reviewed the initial report of the completed systematic review.
PROSPERO registration no: CRD42020186265.
INTRODUCTION
Globally, 1 in 3 children under 5 years is undernourished or overweight, and 1 in 2 suffers from hidden hunger due to nutrient deficiencies, and among school-age children 11% were wasted and 18% were overweight or obese in 2016.1 While there is a reported reduction in stunted children worldwide, this is not the case in poorer settings, such as in Africa. On the other hand, the prevalence of overweight and obesity is increasing globally.1
Malnutrition undermines the ability of children to grow and achieve their full potential. Children who are overweight or obese are at increased risk for adult obesity, early-onset type 2 diabetes and other noncommunicable diseases, stigmatization, and depression.1–3 These, in turn, have serious socioeconomic consequences.4 Undernutrition poses a risk to mortality as well as for physical and cognitive developmental difficulties.5,6 Malnutrition in children is largely due to poor diets, especially among those who are socioeconomically disadvantaged. Diets of malnourished children are generally low in fruits and vegetables (FV), whole grains, and nuts and fiber, and high in processed foods, salt, sugars, sodium, and calories.7–10 School-based policies or interventions that aim to improve children’s dietary intake may help address this double burden of malnutrition.
The World Health Organization (WHO) Nutrition-Friendly Schools Initiative provides a framework for integrated school-based programs addressing all forms of malnutrition: policy options for improving the health and nutrition of young people. One of the Nutrition-Friendly Schools Initiative components concerns supportive school food environments. The accessibility and cost of the foods available in school environments and regulations regarding food marketing influence children’s food choices. Additionally, schools are important settings to promote healthy diets and instill lifelong lifestyle habits, as much of children’s time during the formative years is spent at school, where they can consume up to 50% of their daily calories.11–15 The Second International Conference on Nutrition (ICN2) Framework for Action calls for healthy diets to be fostered in schools and includes recommendations for school food and nutrition standards, food programs aligned with national food-based dietary guidelines, and nutrition education as part of school curricula, among others.15 Therefore, policies or interventions that influence the school food and nutrition environment are important.16,17
To ensure efficient use of resources, it is important to assess which policies or interventions are effective and can thus be recommended for implementation. Recent reviews have addressed this question. One of these had a few limitations, such as including uncontrolled studies, combining different study designs in meta-analyses, or not carrying out duplicate screening and data extraction,18 all of which reduce the rigor and validity of the review. Others focused on specific interventions, such as school lunches in the United States alone,19 or assessed policies or broad interventions addressing multiple risk factors, such as physical activity and tobacco and alcohol consumption.20 To inform a WHO guideline on school food and nutrition policies, a systematic review was conducted to assess the effects of implementing policies or interventions that influence the school food environment on children’s health and nonhealth outcomes.
METHODS
This systematic review was registered with PROSPERO (registration no. CRD42020186265), was conducted according to Cochrane methods,21 and is reported according to the PRISMA (Preferred Reporting Items for Systematic Reviews and Meta-Analyses) statement.22 The eligibility criteria were determined by the WHO Nutrition Guidance Expert Advisory Group Subgroup on Policy Actions, which are detailed in Table 1.
Eligibility criteria for selecting studies for inclusion
| Criteria | |
|---|---|
| Participants and setting |
|
| Interventions and comparators | Policies/interventions that influence the school food environment, implemented at national or local level, including:
We included studies that compared the policy/intervention of interest with no new policy/intervention or with existing or weaker policies/interventions (“business as usual”). |
| Outcomes | The critical outcomes as ranked by the WHO guideline development group included the following:
|
| Types of studies |
Studies in any language, regardless of their publication status |
Abbreviations: BMI, body mass index; HDL, high-density lipoprotein; LDL-C, low-density-lipoprotein cholesterol; TC, total cholesterol; TG, triglycerides; WHO, World Health Organization.
Search methods for identification of studies
Eleven databases were searched from their inception to April/May 2020: PubMed, Scopus, Web of Science, Open Grey, Cochrane Library, ERIC, CINAHL, WHO Global Index Medicus, Epistemonikos, and ClinicalTrials.gov (search strategies are shown in S1 File; please see the Supporting Information online). Further studies were retrieved through the WHO call for data (submissions deadline was 20 June 2020: https://www.who.int/news-room/articles-detail/call-for-data-on-nutrition-school-food-environment-2020).
Study selection process
All titles and abstracts were screened independently and in duplicate against the eligibility criteria. Full-texts of potentially eligible records were screened by 1 reviewer; all excluded records were checked by a second reviewer. Any disagreements regarding eligibility were resolved through discussion.
Data extraction and risk-of-bias assessment
One reviewer extracted data, and a second reviewer checked it. Information was extracted about the author, study location and funding, study design and methods, participants (including PROGRESS-Plus characteristics that can be used to differentiate intervention effects across social categories; eg, place of residence, race/ethnicity/culture/language, etc),23 interventions, and outcome measures. One author assessed the risk of bias using the Cochrane “Risk of Bias” tool, as modified by Cochrane Effective Practice and Organization of Care,24 and a second author checked it. For each criterion in the tool, each study was assessed as being at low, unclear, or high risk of bias. A study’s overall risk of bias was based on the risk for 2 prespecified domains: selection and attrition bias.
Data synthesis
To identify the comparisons for the synthesis, each study’s intervention characteristics were first tabulated. For the nudging interventions category, comparisons were organized according to the TIPPME (typology of interventions in proximal physical micro-environments) intervention typology categories: those that (1) influence how food is presented (eg, fun stickers on healthier options, (2) influence how food is positioned (eg, less healthy foods placed in a less accessible location), (3) influence size (eg, serving larger portion sizes), (4) influence the functionality of food (eg, allowing easier opening or pouring), and (5) implement multiple nudging strategies.25
Data for each outcome were synthesized separately by study design. Due to substantial heterogeneity and lack of data for some studies, our main synthesis approach was based on vote counting based on effect direction (ED).26 Five categories of ED were used: (1) clear effect favoring the intervention (effect estimate favors the intervention; 95% CI excludes the null, ▲), (2) unclear effect potentially favoring the intervention (effect estimate favors intervention; 95% CI includes the null and is wide, △), (3) no difference in effect (95% CI crosses the null and is narrow, □□), (4) unclear effect potentially favoring the control (effect estimate favors the control; 95% CI includes the null and is wide, ▽), and (5) clear effect favoring the control (effect estimate favors the control; 95% CI excludes the null, ▼). Where a 95% CI was not reported and could not be calculated, the P value was used to determine whether the ED was clear or unclear. If effect estimates were not reported but the authors reported the ED in the text, this information was used to guide decisions. Effects on key outcomes were illustrated graphically using harvest plots.27
Where possible, meta-analyses were carried out for subsets of studies of the same design reporting the same comparison and outcome measure, using random-effects meta-analyses in Review Manager (The Cochrane Collaboration).28 Results from crossover trials were included, with results from parallel trials in meta-analyses using the generic inverse variance method.29
For dichotomous outcomes percentage points, odds ratios (ORs) or risk ratios were reported, with a 95% CI if this was reported or could be calculated. For continuous outcomes, mean differences (MDs) were reported if studies measured the outcomes in the same way, and the standardized MD if not, along with a 95% CI. Standardized MDs were interpreted as follows: 0.2 = small effect, 0.5 = moderate effect, and 0.8 = large effect.30
Adjustment for clustering in cluster randomized controlled trials (RCTs) was checked. If studies had more than 1 intervention arm, relevant arms were combined to conduct pairwise comparisons. When outcome data were available for multiple time points, all that were measured during and immediately after the intervention were reported. Where multiple outcome measures of the same outcome were reported, 1 measure to include in the synthesis was selected to avoid double counting; the measure judged to be the most comprehensive, validly measured, and relevant for decision making (eg, body mass index [BMI] instead of weight and height) was selected. To ensure transparency, the results of all included studies and all measures reported are presented in S2 File (please see the Supporting Information online), per comparison and study design.
Heterogeneity was assessed in relation to PICO (Population, Intervention, Comparison and Outcome) elements, by visually inspecting the CI overlap in forest plots and using the χ2 and I2 statistics where meta-analyses were carried out. If a meta-analysis had substantial heterogeneity (ie, if the χ2 test had a low P value [P < 0.1] or if the I2 statistic was ≥50%),31 data were not pooled.
The planned subgroup analysis could not be carried out as there were insufficient data per outcome and comparison. The planned sensitivity analysis could not be carried out as meta-analyses were not the main synthesis approach and the meta-analysis conducted did not include 5 studies or more. However, the synthesis was presented separately for different study designs and the risk of bias was reported in the tables of individual study results and in the text. No outcome measures were reported in 10 or more studies and thus it was not possible to investigate the risk of publication bias.
Two reviewers assessed the overall certainty of evidence for all critical outcomes and one important outcome (anthropometric measures) using the Grading of Recommendations Assessment, Development, and Evaluation (GRADE) approach.32 The evidence profile tables were based on evidence from randomized studies, unless no randomized study reported a key outcome that was reported by a nonrandomized study.
RESULTS
The titles and abstracts of 17 706 de-duplicated records and then 1471 full texts were screened (Figure 1). Of the latter, 1285 records were excluded (S3 File; please see the Supporting Information online), 80 are awaiting classification as their full text could not be accessed (S4 File; please see the Supporting Information online), 7 are ongoing studies (S5 File; please see the Supporting Information online), and 99 records pertaining to 74 unique studies were included.
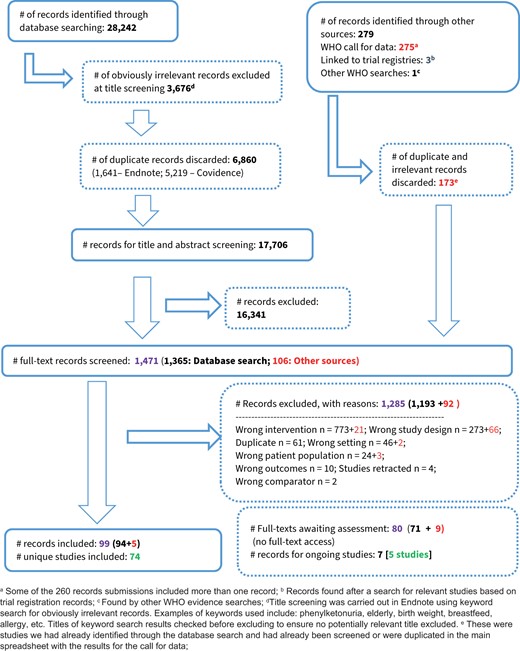
PRISMA (Preferred Reporting Items for Systematic Reviews and Meta-Analyses) flowchart of study selection. Abbreviation: WHO, World Health Organization
Characteristics of included studies
Table 233–103 presents an overview of included studies; details about each are available in the S6 File (please see the Supporting Information online). Thirty-two prospective controlled studies (PCSs), 34 cluster RCTs (10 crossover trials), 3 RCTs, and 5 uncontrolled interrupted time-series (ITS) studies were included. Most studies allocated the intervention at the school level (n = 53), included primary school children, and compared the intervention with no intervention. The sample sizes ranged from 23 to 24 291 participants and 1 to 235 schools, with follow-up ranging from 1 day to 8 years. Most studies (61/74) were conducted in high-income countries (HICs). The following intervention categories were included: (1) nutrition standards (n = 9), (2) nudging interventions (n = 22), and (3) direct food provision (n = 43). No study assessed marketing restrictions of unhealthy food and nonalcoholic beverages (FNABs) or pricing policies to promote healthier alternatives. All critical outcomes were reported, except for nutrient and calorie content of available foods or exposure to marketing of FNABs. All the important outcomes were reported, except for the prices of available foods and portion sizes. Most studies (n = 54) were funded by governmental or intergovernmental agencies or nonprofit organizations, and 7 studies were funded by the food industry. Most studies did not report on potential conflicts of interest (n = 37) or declared that none of the authors had any potential conflict of interest (n = 36).
Summary of included studies and comparisons (n = 74)
| Intervention category | Comparisons | n | Study IDs |
|---|---|---|---|
| Nutrition standards or rules that determine the quality of food served or sold in and around schools (n = 9) | 1. Nutrition standards increasing the availability of healthy food at school vs no intervention | 8 | |
| 2. Nutrition standards regarding availability of healthy beverages in schools vs no intervention | 1 | 1 Prospective controlled study: Whatley Blum 200839 | |
| Nudging interventions promoting healthy food behavior in the school environment (eg, product placement) (n = 22) | 3. Changes to how food is presented vs no changes | 7 | |
| 4. Changes to how food is positioned vs no changes | 5 | ||
| 5. Servings larger portion sizes vs reference portion size | 5 | 5 Cluster crossover RCTs: DiSantis 201351; Looney 201152; Huss 201353; Kling 201654; Smethers 201955 | |
| 6. Increasing functionality vs standard practice | 1 | 1 Prospective controlled study: Imberman 201456 | |
| 7. Multiple nudging strategies vs no intervention | 5 | ||
| Pricing policies to promote healthier alternatives (n = 0) | n/a | 0 | None of the included studies reported on this intervention category |
| Direct food provision to students in schools (n = 43) | 8. Provision of fruits/vegetables vs no intervention | 16 |
|
| 9. Provision of school meals vs no intervention | 25 |
| |
| 10. Provision of milk vs no intervention | 2 | ||
| Marketing restrictions of unhealthy FNABs in and around schools | n/a | 0 | None of the included studies reported on this intervention category |
Abbreviations: FNAB, food and nonalcoholic beverage; ITS, interrupted time-series; n/a, not applicable; NS, nutrition standards; NSLP, national school lunch programme; RCT, randomized controlled trial.
Corvalan 2008 reported 3 ITS studies in the same publication, assessing the same intervention but on different groups of participants and at different timepoints. These are listed as separate studies in the review.
Waite 2012 reports on changes to how food is positioned as well as presented, ie, 1 study with 2 relevant arms.
Bartlett 2013 used a regression discontinuity design, which approximates an RCT.
Crepinsek 2006 and Kitchen 2013 compare a universal free breakfast vs traditional school breakfast program where income determines eligibility to participate in the program.
Vericker 2019 reported 2 studies in 1 paper; 1 assessing the NSLP with a population in 2002 and the other with a different population in 2012 assessing NSLP + nutrition standards, and these are listed as separate studies in the review.
Risk of bias in included studies
The summary of risk-of-bias assessments is presented in Figure 2. For included studies with a comparison group (n = 69), most RCTs (n = 22/37) did not report enough information about how the randomization sequence was generated and were thus at unclear risk of selection bias, and most reported that allocation was done centrally or at a cluster level and were thus at low risk of selection bias. All PCSs (n = 32) were at high risk of selection bias as there was no randomization. Most studies (n = 40/69) were at unclear risk of selection bias due to imbalances of baseline characteristics, whereas regarding the balance of baseline outcomes, studies were mostly at unclear risk of bias (31/69). Almost all studies (n = 64/69) were at low risk of performance bias due to blinding; blinding was mostly unfeasible, but lack of blinding was judged as unlikely to influence participant and personnel behavior in ways beyond what the intervention intended. Most studies were at low risk of detection bias (n = 42/69) and 22 were at high risk. Most studies (n = 52/69) had no evidence of contamination and were thus at low risk of performance bias. The studies varied in terms of missing outcome data, with 24 at unclear, 23 at high, and 22 at low risk of attrition bias. Most studies did not have a protocol and were thus at unclear risk of reporting bias. Most studies were at low risk of other types of bias (n = 36).
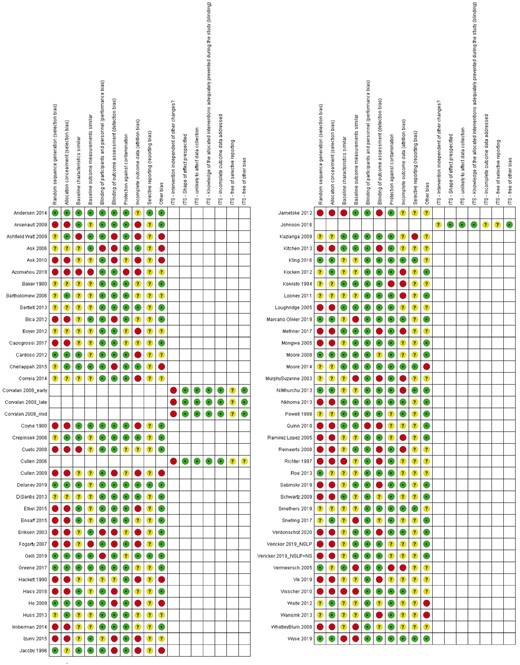
Risk-of-bias summary: review authors’ judgments about each risk-of-bias item for each included study. Abbreviation: ITS, interrupted time-series
All of the ITS studies (n = 5) were classified as low risk of performance bias as it was unlikely that the participants were aware of the intervention or the data were objective. Four studies had all or almost all data available for analysis, and one was classified as unclear risk of attrition bias as it was unclear whether the meals data available were complete. All studies were classified as unclear risk of reporting bias as the protocol was not available. Four studies were judged as low risk of other bias and one was classified as unclear risk. Four ITS studies were classified as high risk of performance bias, as other changes that might have impacted the outcome occurred at the same time as the intervention, and 1 study was classified as unclear risk. All studies were at low risk of detection bias as trends were analyzed before and after the intervention, and the methods of data collection were the same before and after the intervention implementation. A more detailed risk-of-bias assessment is presented in S7 File (please see the Supporting Information online).
Effects of interventions
The effects on key outcomes for each comparison across included intervention categories are reported below; the effects on all other outcomes are presented in the S8 File (please see the Supporting Information online). No key outcomes were reported for comparison 6; the results for this comparison are available in S8 File. The individual results for all outcomes in each included study across all comparisons are available in S2 File; the shaded rows in these tables indicate the outcomes selected for the synthesis.
Intervention category: Nutrition standards/rules that determine the quality of food served or sold in and around schools
Comparison 1: Nutrition standards increasing the availability of healthy foods in school vs no intervention
Eight studies assessed this intervention, which are briefly described in Table 3.33–39 The harvest plot in Figure 3 illustrates the effects on key outcomes.
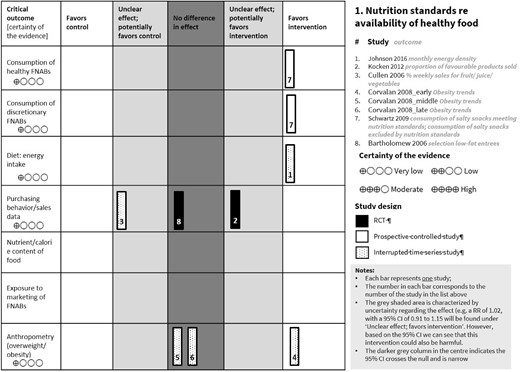
Harvest plot for comparison 1.Abbreviations: FNAB, food and nonalcoholic beverage; RCT, randomized controlled trial; RR, risk ratio
Summary of studies in comparisons 1 (n = 8) and 2 (n = 1): nutrition standards
| Study ID (study design/risk of bias) | Setting (country) | Intervention (duration) |
|---|---|---|
| Comparison 1: Nutrition standards to increase availability of healthy food and beverages at school vs no intervention | ||
| Bartholomew 200633 (cluster RCT/unclear) | Primary schools (USA) | Low/moderate fat entrée offered (total fat ≤35% TE, saturated fat <10% TE, added sugar ≤35% by weight; limiting serving sizes) (4 mo) |
| Kocken 201234 (cluster RCT/high) | Secondary schools (Netherland) | Increase low-calorie products in vending machines (75% products favorable [<100 kcal] or moderately favorable (100–170 kcal) (1.5 mo) |
| Pre–primary schools (Chile) | Three studies assessing the reduction of the energy content of school meals by 10% through decreasing discretionary energy from nonessential fats (30% to 25%) + increasing nutrient-dense foods (ie, FV) (2.8 to 4.8 y) |
| Johnson 201637 (uITS/unclear) | Middle and secondary schools (USA) | Revised nutrition standards for NSLP/NSBP; increased the availability of whole grains, FV; weekly requirements for beans/peas, dark-green, red/orange, starchy, and other vegetables. Increased portion sizes of FV; students to select at least 1 serving of FV (15 mo). |
| Secondary schools (USA) | Remove snack chips, candy, sweet desserts, and sweetened beverages from snack bars; remove vending machines from cafeterias (1 y) |
| Secondary schools (USA) | Nutrition guidelines for foods sold at school: reducing total fat to ≤35% of calories, saturated fat to <10% of calories, added sugar to ≤35% by weight, and limiting serving sizes (1 y) |
| Comparison 2: Nutrition standards regarding availability of healthy beverages at school vs no intervention | ||
| Secondary schools (USA) | Eliminating/reducing the availability of SSBs and diet soda in food avenues (a la carte and vending programs) (9 mo) |
Abbreviations: FV, fruit and vegetables; NSBP, national school breakfast program; NSLP, national school lunch program; PCS, prospective controlled study; RCT, randomized controlled trial; SSB, sugar-sweetened beverage; TE, total energy; uITS, uncontrolled interrupted time-series study.
Consumption of healthy food and nonalcoholic beverages
A PCS38 reported that implementing nutrition guidelines to increase the availability of healthy foods sold at secondary schools may increase the mean consumption score of salty snacks meeting nutrition standards (including baked chips, popcorn, and pretzels; with higher scores indicating better results) at 1 year (coefficient: 0.29 points; P < 0.05; n = 996 children; low-certainty evidence) (Table 433–35,37,38). Similar results were observed for the consumption of beverages and sweet snacks meeting nutrition standards.
GRADE evidence profile for comparison 1
| Question: Nutrition standards/rules increasing the availability of healthy food and beverages at school compared with no intervention for health and other outcomes Setting: Pre–primary and secondary schools in high-income countries (USA, Netherlands, Chile) | |||||||||
|---|---|---|---|---|---|---|---|---|---|
| Certainty assessment | Effect | Certainty | Importance | ||||||
| No. of studies | Study design | Risk of bias | Inconsistency | Indirectness | Imprecision | Other considerations | |||
| Consumption of healthy FNABs (follow-up: 1 y; assessed with: consumption of salty snacks meeting nutrition standards [including baked chips, popcorn, and pretzels]) | |||||||||
| 1 | Observational studies | Not seriousa | Not serious | Not seriousb | Not serious | None | One study (Schwartz 2009)38 reported a clear effect favoring nutrition standards (MD 0.29, P < 0.05, n = 996 children). |
| CRITICAL |
| Consumption of discretionary FNABs (follow-up: 1 y; assessed with: consumption of salty snacks excluded by nutrition standards [including regular chips]) | |||||||||
| 1 | Observational studies | Not seriousa | Not serious | Not seriousb | Not serious | None | One study (Schwartz 2009)38 reported a clear effect favoring nutrition standards (coefficient = –0.3, P < 0.05, n = 996 children). |
| CRITICAL |
| Diet: energy intake (follow-up: 1.3 y; assessed with: monthly energy density) | |||||||||
| 1 | Observational studies | Not seriousa | Not serious | Not seriousb | Not serious | None | One study (Johnson 2016)37 reported a clear effect favoring nutrition standards (coefficient = –0.46, P < 0.001, n = 6 schools) |
| CRITICAL |
| Purchasing behavior/sales data (follow-up: range: 1.5 mo to 4 mo; assessed with: percentage of children selecting low-fat entrees; proportion of favorable food products sold) | |||||||||
| 2 | Randomized trials | Seriousc | Not serious | Not seriousb | Seriousd | None | One study (Kocken 2012)34 reported an unclear effect potentially favoring the intervention (MD = 0.7, 95% CI: –0.58 to 1.98, n = 28 schools). The other study (Bartholomew 2006)33 reported that there was no increase in rate of selection of low-fat entrées in the intervention group (effect estimate was not reported; n = 2 schools) |
| CRITICAL |
| Nutrient and calorie content of available foods—not reported | |||||||||
| — | — | — | — | — | — | — | — | — | CRITICAL |
| Exposure to marketing of FNABs—not reported | |||||||||
| — | — | — | — | — | — | — | — | — | CRITICAL |
| Anthropometry: obesity (follow-up: range: 2.8 y to 4.8 y; assessed with: trends in obesity) | |||||||||
| 3 | Observational studies | Not seriousa | Seriouse | Not seriousb | Not serious | None | One study reported a clear effect favoring nutrition standards (Corvalan 2008_early)35 (beta = –0.005, 95% CI: –0.01 to –0.003). Two studies with shorter exposure period reported no effect (Corvalan 2008_mid: beta = 0.000, P = 0.52; Corvalan 2008_late: beta = 0.003, P = 0.22).35 |
| IMPORTANT |
Abbreviations: FNAB, food and nonalcoholic beverage; GRADE, Grading of Recommendations Assessment, Development and Evaluation; MD, mean difference.
Not downgraded due to risk of bias as observational study already starting at low certainty.
Not downgraded due to indirectness: Although the evidence was from 1 or more studies in a high-income setting, which may not be representative of all relevant settings, the guideline development group opted for not downgrading due to indirectness.
Downgrade by 1 level for risk of bias: One study at unclear and the other at high overall risk of bias.
Downgrade by 1 level for imprecision: One study with a wide CI; the other study does not report an effect measure or 95% CI.
Not downgraded due to inconsistency because of the high number of participants.
Consumption of discretionary food and nonalcoholic beverages
One PCS38 reported that the implementation of nutrition guidelines may decrease the mean consumption score of salty snacks excluded by nutrition standards (including regular chips; with a higher score indicating poorer results; coefficient: –0.3; P < 0.05; n = 996 children; low-certainty evidence). Similar results were reported for the consumption of beverages excluded by nutrition standards and “no effect” was reported for sweet snacks excluded by nutrition standards.
Diet
An uncontrolled ITS study37 reported that standards increasing the availability of whole grains, fruits, and vegetables at secondary schools in the United States may reduce energy intake slightly at 1.3 years (mean monthly energy density calculated as the available energy divided by the weight of foods served; coefficient = –0.46; P < 0.001; n = 6 schools; low-certainty evidence).
Purchasing behavior or sales data
Evidence from 2 RCTs indicates that nutrition standards that increase the availability of healthy food at school may make little to no difference to the proportion of favorable products (<100 kcal or low-fat entrees) sold (2 cluster RCTs; n = 30 schools; low-certainty evidence). In one of these studies33 primary schools offered low-fat entrées compared to no-fat-content restrictions and the other34 increased the availability of lower-calorie products (favorable: <100 kcal; moderately favorable: 100–170 kcal) in vending machines at secondary schools. One ITS study68 assessing the removal of unhealthy food from secondary schools’ snack bars and cafeterias reported an unclear effect potentially favoring the control on the percentage of weekly sales for fruit, juice, and vegetables (percentage points [pp]: –12; 95% CI: –6.65 to 6.41; n = 3 schools).
Anthropometric outcomes
The evidence is very uncertain regarding the effects of a 10% reduction in the energy content of pre-primary school meals on obesity (BMI z score ≥ 2 SDs) trends over 2.8 to 4.8 years (3 uncontrolled ITS studies; n = 67 841 children; very-low-certainty evidence). Of the 3 uncontrolled ITS studies, all reported in 1 paper,35 one reported a clear effect favoring the intervention at 4 years and 8 months and the other 2 studies reported no effect. The same studies reported no difference on the trends in stunting (height-for-age z score < –2 SDs).
Comparison 2: Nutrition standards increasing the availability of healthy beverages in school vs no intervention
One PCS was included in this comparison39; it assessed eliminating or reducing sugar-sweetened beverages (SSBs) and diet soda availability in secondary schools in the United States (Table 3).
Consumption of discretionary food and nonalcoholic beverages
Nutrition standards to increase the availability of healthy beverages in schools may make little to no difference on the consumption of SSBs (1 study, 456 children; low-certainty evidence; Table 539). It reported no difference in the mean servings per day of SSBs for boys (MD: –0.01; 95% CI: –0.30 to 0.28; n = 183) or girls (MD: –0.01; 95% CI: –0.20 to 0.18; n = 273).
GRADE evidence profile for comparison 2
| Question: Nutrition standards/rules increasing the availability of healthy beverages in school compared with no intervention for health and other outcomes Setting: Secondary schools in the USA | |||||||||
|---|---|---|---|---|---|---|---|---|---|
| Certainty assessment | Effect | Certainty | Importance | ||||||
| No. of studies | Study design | Risk of bias | Inconsistency | Indirectness | Imprecision | Other considerations | |||
| Consumption of healthy FNABs—not reported | |||||||||
| — | — | — | — | — | — | — | — | — | CRITICAL |
| Consumption of discretionary FNABs (follow-up: 1 y; assessed with: mean servings/d of sugar-sweetened beverages) | |||||||||
| 1 | Observational studies | Not seriousa | Not serious | Not seriousb | Not serious | None | One study (Whatley Blum 2008)39 reported no difference in effect both for boys (MD –0.01, 95% CI: –0.30 to 0.28, n = 183) and girls (MD –0.01, 95% CI: –0.20 to 0.18, n = 273) |
| CRITICAL |
| Diet: energy intake—not reported | |||||||||
| — | — | — | — | — | — | — | — | — | CRITICAL |
| Purchasing behavior/sales data—not reported | |||||||||
| — | — | — | — | — | — | — | — | — | CRITICAL |
| Nutrient and calorie content of available foods—not reported | |||||||||
| — | — | — | — | — | — | — | — | — | CRITICAL |
| Exposure to marketing of FNABs—not reported | |||||||||
| — | — | — | — | — | — | — | — | — | CRITICAL |
| Anthropometry: overweight/obesity—not reported | |||||||||
| — | — | — | — | — | — | — | — | — | IMPORTANT |
Abbreviations: FNAB, food and nonalcoholic beverage; GRADE, Grading of Recommendations Assessment, Development and Evaluation; MD, mean difference.
Not downgraded for risk of bias as the study design already starts at low certainty.
Not downgraded due to indirectness: Although the evidence is from only 1 study from a high-income country, which may not be representative of all settings, the guideline development group decided not to downgrade for indirectness.
Intervention category: Nudging interventions promoting healthy food behavior in the school environment
Comparison 3. Changes to food presentation vs no changes
Seven studies, all conducted in the United States, reported on the effects of changing how food is presented; they are briefly described in Table 6.40–61
Summary of studies in comparisons 3–7: nudging interventions (n = 22)
| Comparison | Examples of interventions | Study design (n), study ID (risk of bias) | Setting (country) | Duration (n) |
|---|---|---|---|---|
| 3: Changes to how food is presented vs no changes (n = 7) | Increased the visibility of white milk in relation to chocolate milk to discourage selection of chocolate milk; serving fruit cut up vs whole; increase attractiveness of FVs, eg, with stickers; healthy snack in shapes of animals/hearts; serving a variety compared to single fruits/vegetables; pairing a vegetable with a well-liked dish; serving a 2-course vs single-course meal |
|
| |
| 4: Changes to how food is positioned vs no changes (n = 5) | Chocolate milk hidden behind the counter while white milk on the self-service counter; school online menus redesigned so that FV snack items appeared first; making water more easily accessible by placing water coolers in cafeterias; waterjets installation |
|
| |
| 5: Serving larger vs reference portion sizes | Increased portion size served by 50% vs standard reference portion; small portion size (150 g) vs large portion size (300 g); large/adult-size dishware (100% larger) vs small/child dishware | Cluster crossover RCTs (n = 5): DiSantis 201351 (?); Looney 201152 (-); Huss 201353 (?); Kling 201654 (?); Smethers 201955 (?) |
|
|
| 6: Changes to functionality vs no changes | Provision of free breakfast in in class vs in cafeteria before class | PCS (n = 1): Imberman 201456 (-) | Primary schools (USA) | 9 wk |
| 7: Multiple nudging strategies vs no intervention (n = 5) | Changes in online canteens to encourage students to purchase healthier foods and beverages for lunch; included labelling, product placement, other; strategies to enhance the visibility, location, and attractiveness of fruits in the lunchroom |
|
|
Abbreviations: FV, fruit and vegetables; PCS, prospective controlled study; RCT, randomized controlled trial; ?, unclear overall risk of bias; -, high overall risk of bias; +, low overall risk of bias.
Consumption of healthy food and nonalcoholic beverages
Nudging interventions that change how food is presented may slightly increase consumption of healthy FNABs, including FV and white milk (6 studies, n = 596 children; low-certainty evidence; Table 7).40–46 Of the 6 trials, 3 reported a clear effect favoring the intervention41,42,45 and 3 reported an unclear effect potentially favoring the intervention40,43,44 (seeFigure S1 in the Supporting Information online).
GRADE evidence profile for comparison 3
| Question: Nudging interventions that change how food is presented compared with no interventions for health and other outcomes Setting: Pre–primary, primary, and secondary schools in a high-income country (USA) | |||||||||
|---|---|---|---|---|---|---|---|---|---|
| Certainty assessment | Effect | Certainty | Importance | ||||||
| No. of studies | Study design | Risk of bias | Inconsistency | Indirectness | Imprecision | Other considerations | |||
| Consumption of healthy FNABs (follow-up: range: 1 d to 4 wk; assessed with: consumption of fruits and vegetables, and of white milk) | |||||||||
| 7 | Randomized trials | Seriousa | Not serious | Not serious | Seriousb | None | Three trials (Wansink 2013,41 Snelling 2017,42 Roe 201345) reported a clear effect favoring changes to how food is presented. Three trials reported an unclear effect potentially favoring the intervention (Cardoso 2012,44 Correia 2014,43 Waite 201240). (596 children; 12 schools; 76 milk cartons) |
| CRITICAL |
| Consumption of discretionary FNABs—not reported | |||||||||
| — | — | — | — | — | — | — | — | — | CRITICAL |
| Diet: energy intake (follow-up: range: 4 wk to 6 wk; assessed with: mean energy intake; fruit intake in kcal) | |||||||||
| 2 | Randomized trials | Very seriousc | Not serious | Not serious | Seriousd | None | Two trials reported no difference in effect (Cardoso 201444: d = 0.01; P > 0.05, n = 16 children; Boyer 201246 did not report an effect estimate, only that there was “no significant difference”) |
| CRITICAL |
| Purchasing behavior/sales data (follow-up: range: 1 wk to 4 wk; assessed with: percentage of students selecting target foods [white milk, fruits, vegetables]) | |||||||||
| 3 | Randomized trials | Seriouse | Not serious | Not seriousf | Seriousg | None | Two trials (1 parallel cluster trial and 1 crossover trial) (Wansink 2013,41 Roe 201345) reported clear effects favoring changes in food presentation and 1 cluster trial (Waite 2012)40 reported an unclear effect potentially favoring the changes in food presentation. |
| CRITICAL |
| Nutrient and calorie content of available foods—not reported | |||||||||
| — | — | — | — | — | — | — | — | — | CRITICAL |
| Exposure to marketing of FNABs—not reported | |||||||||
| — | — | — | — | — | — | — | — | — | CRITICAL |
| Anthropometric measure: overweight/obesity—not reported | |||||||||
| — | — | — | — | — | — | — | — | — | IMPORTANT |
Abbreviations: FNAB, food and nonalcoholic beverage; GRADE, Grading of Recommendations Assessment, Development and Evaluation.
Downgraded by 1 due to risk of bias: all studies at unclear or high overall risk of bias.
Downgraded by 1 level due to imprecision: most studies had small sample sizes and wide confidence intervals in those reporting this measure.
Downgraded by 2 levels due to risk of bias: 2 studies at high overall risk of bias.
Downgraded by 1 level due to imprecision: 2 trials with very small sample sizes (n = 21 and n = 16 children).
Downgraded by 1 level due to risk of bias: 3 trials at unclear overall risk of bias.
Not downgraded due to indirectness: although all trials were based in the USA and may not be representative of other settings, the guideline development group opted not to rate down for indirectness.
Downgraded by 1 level due to imprecision: 1 trial did not report a CI and the 2 trials had wide CIs.
Diet
Two trials44,46 reported no difference in the effect of nudging interventions that change how food is presented on energy intake, but the evidence is very uncertain (2 trials, n = 37 children; very-low-certainty evidence).
Purchasing behavior or sales data
Nudging interventions that change how food is presented may increase healthy food purchasing behavior (3 trials, n = 1134 children; low-certainty evidence). Of the 3 trials, 2 reported clear effects favoring the intervention on the selection of FV41,45 and 1 trial reported an unclear effect potentially favoring the intervention on the selection of white over chocolate milk.40
Comparison 4. Changes to how food is positioned vs no changes to food position
Two cluster trials40,47 and 3 PCSs48–50 assessed the effects of changing how healthy food/beverages are positioned so that they are more easily accessible to children (Table 6).
Consumption of healthy food and nonalcoholic beverages
Nudging interventions that change how food is positioned may increase the consumption of healthy FNABs (3 RCTs, n = 14 schools; low-certainty evidence; Table 8).40,47–49 One study assessing the positioning of water so that it is more accessible reported a clear effect favoring the intervention49 and 1 study assessing the placement of water coolers in cafeterias reported an unclear effect potentially favoring the intervention48 (seeFigure S2 in the Supporting Information online). The third40 assessed changes to the position of white and chocolate milk so that the former was more accessible; it reported a decrease in the proportion of white milk consumed in the intervention group (50% to 47%) and an increase in the control group (54% to 56%); no effect measure was reported (seeFigure S2 in the Supporting Information online).
GRADE evidence profile for comparison 4
| Question: Nudging interventions that change how food is positioned compared with no change to food position for health and other outcomes Setting: Pre–primary, primary, and secondary schools in high-income countries (USA, UK) | |||||||||
|---|---|---|---|---|---|---|---|---|---|
| Certainty assessment | Effect | Certainty | Importance | ||||||
| No. of studies | Study design | Risk of bias | Inconsistency | Indirectness | Imprecision | Other considerations | |||
| Consumption of healthy FNABs (follow-up: range: 3 mo to 10 mo; assessed with: milliliters of water consumed per child per day; number of times water sources were used/100 students) | |||||||||
| 3 | Observational studies | Not seriousa | Not serious | Not seriousb | Not serious | None | One study (Elbel 2015,49 12 schools) reported a clear effect favoring the intervention, 1 study (Loughridge 2005,48 2 schools) reported an unclear effect potentially favoring the intervention, and 1 reported an unclear effect potentially favoring the control (Waite 2012,40 105 milk cartons) |
| CRITICAL |
| Consumption of discretionary FNABs—not reported | |||||||||
| — | — | — | — | — | — | — | — | — | CRITICAL |
| Diet: energy intake—not reported | |||||||||
| — | — | — | — | — | — | — | — | — | CRITICAL |
| Purchasing behavior/sales data (follow-up: range: 1 wk to 4 wk; assessed with: percentage of students selecting white milk; proportion of all online lunch orders that contained at least 1 target fruit or vegetable snack foods) | |||||||||
| 2 | Randomized trials | Seriousc | Not seriousd | Not serious | Seriouse | None | One cluster trial reported a clear effect favoring the intervention (Waite 201240; OR: 3.81; 95% CI: 2.4 to 6.1; P < 0.001) and 1 cluster trial reported an unclear effect potentially favoring the intervention (Wyse 201947; OR = 1.136; 95% CI: 0.791 to 1.632; P = 0.490). |
| CRITICAL |
| Nutrient content of available foods—not reported | |||||||||
| — | — | — | — | — | — | — | — | — | CRITICAL |
| Exposure to marketing of FNABs—not reported | |||||||||
| — | — | — | — | — | — | — | — | — | CRITICAL |
| Overweight/obesity—not reported | |||||||||
| — | — | — | — | — | — | — | — | — | IMPORTANT |
Abbreviations: FNAB, food and nonalcoholic beverage; GRADE, Grading of Recommendations Assessment, Development and Evaluation; OR, odds ratio.
Not downgraded due to risk of bias: observational studies already start at low risk of bias.
Not downgraded due to indirectness: although the 2 studies were in high-income countries and may not be representative of all settings, the guideline development group opted not to rate down due to indirectness.
Downgraded by 1 level due to risk of bias: 1 trial at high and 1 at unclear overall risk of bias.
Not downgraded due to inconsistency because, although there is heterogeneity in effect estimates and the CIs do not overlap, this can be explained by the different interventions implemented and different outcomes measured.
Downgraded by 1 level due to imprecision: both trials have wide CIs, ranging from 20% reduced odds to a 60% increased odds of the outcome in one of the trials.
Purchasing behavior or sales data
Nudging interventions that change how food is positioned may increase the selection of healthy target foods or beverages (2 trials, n = 2462 children; low-certainty evidence). Of the 2 trials, 1 reported a clear effect favoring the intervention (OR: 3.81; 95% CI: 2.4 to 6.1)40 and the other an unclear effect potentially favoring the intervention (OR: 1.136; 95% CI: 0.791 to 1.632).47 Two PCSs also reported this outcome, both assessing the placing of water coolers in school canteens. One reported an unclear effect potentially favoring the intervention on sales of SSBs48 and the other reported that the changes in SSB sales were similar in intervention and control schools but did not report effect measures.50
Comparison 5. Serving larger portion sizes vs reference portion sizes
Five cluster crossover trials assessed changes to portion sizes served on diet intake measures (Table 6).
Diet
Serving smaller portion sizes may reduce energy intake slightly (4 trials, n = 346 children; low-certainty evidence; Table 9).51,53–55 Two trials reported a clear reduction in energy intake with the reference portion size,54,55 1 study reported an unclear effect potentially favoring the smaller child-sized dishware (ie, lower energy intake),51 and 1 study reported no difference between the groups53 (seeFigure S3 in the Supporting Information online).
GRADE evidence profile for comparison 5
| Question: Nudging interventions that change portion size served compared with reference/standard portion size for health and other outcomes Setting: Pre–primary and primary schools in a high-income country (USA) | |||||||||
|---|---|---|---|---|---|---|---|---|---|
| Certainty assessment | Effect | Certainty | Importance | ||||||
| No. of studies | Study design | Risk of bias | Inconsistency | Indirectness | Imprecision | Other considerations | |||
| Consumption of healthy FNABs—not reported | |||||||||
| — | — | — | — | — | — | — | — | — | CRITICAL |
| Consumption of discretionary FNABs—not reported | |||||||||
| — | — | — | — | — | — | — | — | — | CRITICAL |
| Diet—energy intake (follow-up: range 5 d to 4 wk; assessed with: energy intake/meal and energy intake/d) | |||||||||
| 4 | Randomized trials | Seriousa | Not seriousb | Not seriousc | Seriousd | None | Two crossover trials (Kling 2016,54 Smethers 2019 55) reported a clear effect favoring the reference portion (ie, lower energy intake with the reference portion size), 1 trial (DiSantis 2013)51 reported an unclear effect potentially favoring the child-sized dishware (ie, lower energy intake with the smaller dishware), and 1 crossover trial (Huss 2013) 53 reported no difference in effect. |
| CRITICAL |
| Purchasing behavior/sales data—not reported | |||||||||
| — | — | — | — | — | — | — | — | — | CRITICAL |
| Nutrient/calorie content of food—not reported | |||||||||
| — | — | — | — | — | — | — | — | — | |
| Exposure to marketing of FNABs—not reported | |||||||||
| — | — | — | — | — | — | — | — | — | |
| Overweight/obesity—not reported | |||||||||
| — | — | — | — | — | — | — | — | — | IMPORTANT |
Abbreviations: FNAB, food and nonalcoholic beverage; GRADE, Grading of Recommendations Assessment, Development and Evaluation.
Downgraded by 1 level due to risk of bias: most studies at unclear overall risk of bias.
Not downgraded for inconsistency; although the effects are inconsistent, this can be explained by the different interventions and outcomes measured.
Not downgraded due to indirectness: although all studies were conducted in the USA and the setting may not be representative of all settings, the guideline development group opted for not downgrading for indirectness.
Downgraded by 1 level due to imprecision: most trials had wide CIs and included a small number of participants.
Comparison 7. Multiple nudging strategies
Three cluster trials57–59 and 2 PCSs60,61 assessed these multiple nudging strategies (Table 6). The harvest plot in Figure 4 illustrates effects on key outcomes.
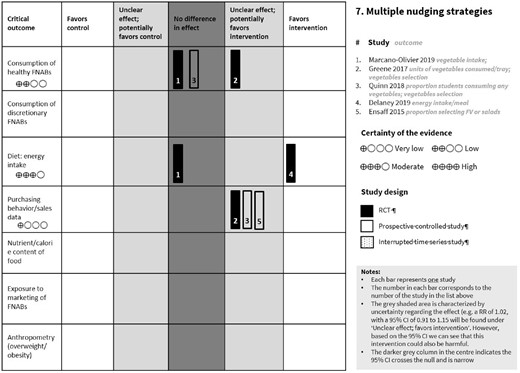
Harvest plot for comparison 7: multiple nudging strategies.Abbreviations: FNAB, food and nonalcoholic beverage; FV, fruit and vegetables; RCT, randomized controlled trial; RR, risk ratio
Consumption of healthy food and nonalcoholic beverages
Evidence from 2 trials58,59 shows that multiple nudging interventions result in little to no difference in vegetable intake (2 trials, n = 176 children/7752 trays; moderate-certainty evidence; Table 10,57–59,Figure 4). One PCS reported no difference in effect on the proportion of students consuming any vegetable.61
GRADE evidence profile for comparison 7
| Question: Multiple nudging interventions compared with no intervention for health and other outcomes Setting: Primary and secondary schools in high-income countries (USA, UK, Australia) | |||||||||
|---|---|---|---|---|---|---|---|---|---|
| Certainty assessment | Effect | Certainty | Importance | ||||||
| No. of studies | Study design | Risk of bias | Inconsistency | Indirectness | Imprecision | Other considerations | |||
| Consumption of healthy FNABs (follow-up: range: 3 wk to 6 wk; assessed with: mean vegetable consumption in grams; units of vegetables consumed per tray) | |||||||||
| 2 | Randomized trials | Seriousa | Not serious | Not seriousb | Not serious | None | One trial reported a small unclear effect potentially favoring the intervention (Greene 2017)59 (n = 7 schools). One trial reported no changes between the groups but did not report an effect estimate (Marcano Olivier 2019).58 |
| CRITICAL |
| Consumption of discretionary FNABs—not reported | |||||||||
| — | — | — | — | — | — | — | — | — | CRITICAL |
| Diet: energy intake | |||||||||
| 2 | Randomized trials | Not serious | Seriousc | Not seriousb | Not serious | None | One trial reported a clear effect favoring the intervention (multiple nudging interventions reduced energy intake: MD = –567.25; 95% CI: –697.95, –436.55; P < 0.001 [Delaney 201957]) and one did not report an effect measure but stated there was no difference in effect (Marcano Olivier 2019)58 |
| CRITICAL |
| Purchasing behavior/sales data (follow-up: 6 wk; assessed with: number of units of vegetables selected in an average tray) | |||||||||
| 1 | Randomized trials | Seriousd | Not serious | Not seriousb | Seriouse | None | One cluster trial reported an unclear effect potentially favoring the intervention (Greene 201759; percentage points = 24.6; difference-in-difference = 0.246; P = 0.074) (n = 7 schools) |
| CRITICAL |
| Nutrient and calorie content of available food—not reported | |||||||||
| — | — | — | — | — | — | — | — | — | CRITICAL |
| Exposure to marketing of FNABs—not reported | |||||||||
| — | — | — | — | — | — | — | — | — | CRITICAL |
| Overweight/obesity—not reported | |||||||||
| — | — | — | — | — | — | — | — | — | IMPORTANT |
Abbreviations: FNAB, food and nonalcoholic beverage; GRADE, Grading of Recommendations Assessment, Development and Evaluation; MD, mean difference.
Downgraded by 1 level due to risk of bias: 1 study at unclear and the other at high overall risk of bias.
Not downgraded due to indirectness: although the evidence is from only 1 study conducted in a high-income setting, which may not be representative of other settings, the expert guideline group (World Health Organization) opted for not downgrading for indirectness.
Downgraded by 1 level due to inconsistency: direction of effect varied between the studies.
Downgraded by 1 level due to risk of bias: 1 study at unclear overall risk of bias.
Downgraded by 1 level due to imprecision: 1 study with tray data and unclear number of participants analyzed and no CI reported.
Diet
Multiple nudging interventions promoting FV consumption probably reduce energy intake (2 studies, n = 2547 children; moderate-certainty evidence).57,58
Purchasing behavior or sales data
Implementing multiple nudging strategies to promote fruit consumption may result in little to no difference on the number of vegetable units selected in an average tray (1 trial, percentage points = 24.6; P = 0.074, n = 2108 students; low-certainty evidence). 59 Two PCSs60,61 reported an unclear effect potentially favoring multiple nudging strategies to promote selection of fruits, vegetables, and low-fat milk, on the proportion of students selecting FV or salads at 1 year (MD = 0.03servings, P = 0.3, n = 7 752 trays).
Intervention category: Direct food provision to students in schools (n = 43)
Comparison 8. Provision of fruits/vegetables at school vs no intervention
Sixteen studies assessed this intervention; they are briefly described in Table 11.62–77 The harvest plot in Figure 5 illustrates effects on key outcomes.
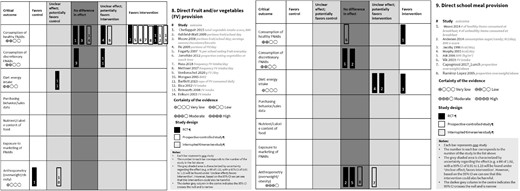
Harvest plot for comparisons 8 and 9: direct food provision.Abbreviations: FNAB, food and nonalcoholic beverage; FV, fruit and vegetables; RCT, randomized controlled trial; RR, risk ratio
Summary of studies assessing fruit and vegetable provision (n = 16)
| Interventions (n) | Study design (n), study ID (risk of bias) | Setting (country) |
|---|---|---|
| Provision of FV daily (n = 7) | Primary schools (UK ×2; Australia; New Zealand; USA; Germany) | |
| FV provision 2–4 d/wk (n = 8) |
| |
| Free vs paid FV subscription (n = 1) (5 wk) | PCS: Eriksen 200375 (-) | Primary schools (Denmark) |
Abbreviations: cRCT, cluster randomized controlled trial; FV, fruit and vegetables; PCS, prospective controlled study; ?, unclear overall risk of bias; -, high overall risk of bias; +, low overall risk of bias.
Consumption of healthy food and nonalcoholic beverages
Evidence from 5 trials 62–66 indicates that FV provision may result in little or no difference in the consumption of FV (5 trials, n = 8256 children; low-certainty evidence; Table 12).62–66 These trials reported a range of effects (Figure 5). In one of these studies fruits could be purchased from a fruit tuck shop at minimal cost. Eight PCSs reported on FV intake, with effects ranging from clearly favoring FV provision in 6 studies,67,69–72,77 to an unclear effect potentially favoring FV provision in 1 study, 74 and no difference in effect in 1 study that assessed a paid subscription for receiving FV at school.75
GRADE evidence profile for comparison 8
| Question: Direct provision of fruit and/or vegetables in schools compared with no intervention for health and other outcomes Setting: Primary schools in high-income countries (UK, Australia, New Zealand, Canada, USA) | |||||||||
|---|---|---|---|---|---|---|---|---|---|
| Certainty assessment | Effect | Certainty | Importance | ||||||
| No. of studies | Study design | Risk of bias | Inconsistency | Indirectness | Imprecision | Other considerations | |||
| Consumption of healthy FNABs (follow-up: range: 8 wk to 1 y; assessed with: vegetable/fruit intake score; number of portions of fruits and/or vegetables consumed; cups of FV consumed) | |||||||||
| 5 | Randomized trials | Seriousa | Not serious | Not serious | Seriousb | None | Two studies (Ashfield Watt 2009,62 Bartlett 201366) reported a clear effect favoring the intervention, 1 study (He 2009)64 reported an unclear effect potentially favoring the intervention, and 2 studies (Moore 2008,65 Chellappah 201563) reported no difference. |
| CRITICAL |
| Consumption of discretionary FNABs (follow-up: 1 y; assessed with: consumption of sweets, chocolates, and biscuits [mean servings consumed at school]; consumption of cookies and brownies in kcal) | |||||||||
| 2 | Randomized trials | Seriousc | Not serious | Not serious | Not serious | None | One study (Bartlett 2013)66 reported an unclear small effect potentially favoring the intervention (MD = –5.37, P = 0.444, n = 4696) and 1 study (Moore 2008)65 reported no difference in effect (MD = –0.116; 95% CI: –0.289 to 0.056; n = 1612). |
| CRITICAL |
| Diet: energy intake (follow-up: 1 y; assessed with: total energy intake [kcal/d]) | |||||||||
| 1 | Randomized trials | Seriousd | Not serious | Not serious | Not seriouse | None | One study (Bartlett 2013)66 reported a small increase in the energy intake with the intervention but the 95% CI crossed the null (MD = 47; 95% CI: –21.6 to 115.6; n = 4696 children) |
| CRITICAL |
| Purchasing behavior/sales data—not reported | |||||||||
| — | — | — | — | — | — | — | — | — | CRITICAL |
| Nutrient and calorie content of available foods—not reported | |||||||||
| — | — | — | — | — | — | — | — | — | CRITICAL |
| Exposure to marketing of FNABs—not reported | |||||||||
| — | — | — | — | — | — | — | — | — | |
| Anthropometric outcomes: overweight/obesity (follow-up: 8 wk; assessed with: BMI [kg/m2]) | |||||||||
| 1 | Randomised trials | Seriousd | Not serious | Not seriousf | Seriousg | None | One study (Chellapah 2015)63 reported a clear effect favoring the control (ie, increase in BMI with the intervention; MD = 0.92; 95% CI: 0.26 to 1.25) |
| IMPORTANT |
Abbreviations: BMI, body mass index; FNAB, food and nonalcoholic beverage; GRADE, Grading of Recommendations Assessment, Development and Evaluation; MD, mean difference.
Downgraded by 1 level due to risk of bias: 3 studies at high overall risk of bias and 2 studies at unclear overall risk of bias.
Downgrade by 1 level for imprecision: 2 studies with wide CIs.
Downgraded by 1 level due to risk of bias: 2 studies at unclear overall risk of bias.
Downgraded by 1 level due to risk of bias: 1 study at unclear overall risk of bias.
Not downgraded. The optimal information size was met.
Not downgraded due to indirectness: although the evidence is from a single study in the USA, which may not be representative of other settings, the guideline development group opted for not downgrading for indirectness.
Downgraded by 1 level due to imprecision: 1 study with a small sample of participants and a wide CI.
Consumption of discretionary food and nonalcoholic beverages
Direct FV provision in schools may result in little to no difference in the consumption of sweets and cakes (2 trials, n = 6308 children; low-certainty evidence). One trial, assessing the implementation of a fruit tuck shop at a primary school, reported a very small unclear effect potentially favoring the intervention66 on the consumption of cookies, cakes, and brownies in calories, and the other, assessing funding for schools to provide FV, reported no difference in effect on the consumption of sweets, chocolates, and biscuits.65
Diet
Evidence from 1 trial66 indicates that FV provision may make little to no difference to energy intake (MD = 47; 95% CI: –21.6 to 115.6; 1 study, n = 4696 children; low-certainty evidence).
Anthropometric outcomes
Evidence from 1 trial63 in primary school classrooms in Australia, aiming to reduce overweight/obesity, indicates that direct provision of fruit in schools may make little or no difference on BMI (kg/m2) (1 study, n = 267 children; very-low-certainty evidence). One PCS73 assessing the inclusion of vegetables from the school garden in primary school meals in South Africa, with the aim to reduce undernutrition, reported an unclear effect potentially favoring the control on BMI z scores.
Comparison 9. Provision of school meals vs no intervention
Twenty-five studies assessed school meal provision (Table 13).78–101 Two of these assessed a slightly different comparison: free universal access to school meals vs income-based access.86,101
Summary of studies assessing school meals provision vs no intervention (n = 25)
| Interventions (n) | Study design (n), study ID (Risk of bias) | Setting (country) |
|---|---|---|
| Breakfast provision (n = 11) | Pre–primary; primary, and secondary schools (UK; Norway; Jamaica; Kenya; Peru; New Zealand; Malawi; Mexico; south Africa; Colombia; Peru) | |
| Lunch provision (n = 8) | Pre–primary, primary, and secondary schools (Senegal; Kenya; Norway [n = 2]; USA [n = 3]; Denmark) | |
| Provision of more than 1 meal/d (n = 3) | Pre–primary, primary, and secondary schools (Ghana; Denmark; Australia) | |
| Provision of breakfast or lunch (n = 1) | RCT: Kazianga 200987 (?) | Primary and secondary schools (Burkina Faso) |
| Universal free access vs income-based access to school meals | Primary and secondary schools (USA; UK) |
Abbreviations: cRCT, cluster randomized controlled trial; NS, nutrition standards; NSLP, national school lunch program; PCS, prospective controlled study; RCT, randomized controlled trial; ?, unclear overall risk of bias; -, high overall risk of bias; +, low overall risk of bias.
Includes nutrition standards as part of intervention description.
Consumption of healthy food and nonalcoholic beverages
Evidence from 1 trial79 indicates that the breakfast provision in primary schools likely results in little to no difference in the consumption of healthy items at breakfast (including fruit, bread, cereal, and milk products; 1 RCT; MD = 0.16; 95% CI: 0.02 to 0.3; P < 0.05; n = 3068 children; moderate-certainty evidence; Table 14,79–81,84,88,Figure 5). Breakfast provided in this study included 1 item from 4 food groups—milk-based drinks or products, non–sugar-coated cereal, fruits, and breads. One PCS at high overall risk of bias97 assessing the provision of free primary school meals in Norway reported no effect on the number of FV portions consumed per day at 5 months (MD = –0.10; 95% CI: –0.66 to 0.46; n = 159 children). One PCS101 assessing the provision of universal free school meals in primary and secondary schools in the United Kingdom compared with income-based access reported a clear effect favoring the intervention on the consumption of vegetables at lunchtime (MD: 26 pp; P < 0.01) and a clear effect favoring the control on the consumption of whole fruits at lunchtime (MD: –19 pp; P < 0.01) after 2 years. However, the study reported that the overall consumption of FV of both groups did not differ.
GRADE evidence profile for comparison 9
| Question: Direct provision of school meals compared with no intervention for health and other outcomes Setting: Primary and secondary schools in high-income countries (UK, Denmark, Norway) | |||||||||
|---|---|---|---|---|---|---|---|---|---|
| Certainty assessment | Effect | Certainty | Importance | ||||||
| No. of studies | Study design | Risk of bias | Inconsistency | Indirectness | Imprecision | Other considerations | |||
| Consumption of healthy FNABs (follow-up: 1 y; assessed with: number of healthy items consumed at breakfast) | |||||||||
| 1 | Randomized trials | Seriousa | Not serious | Not seriousb | Not serious | None | One study (Moore 2014)79 reported a clear effect favoring the intervention (MD = 0.16. 95% CI: 0.02 to 0.3; P < 0.05, n = 3068). However, this effect is not clinically meaningful. |
| CRITICAL |
| Consumption of discretionary FNABs (follow-up: range: 3 mo to 1 y; assessed with: unhealthy items consumed at breakfast; consumption of sugar and candy) | |||||||||
| 2 | Randomized trials | Seriousa | Not serious | Not seriousc | Not serious | None | Two studies reported no difference in effect (Moore 201479: OR = 1.05; 95% CI: 0.86 to 1.29; P > 0.05, n = 3068; Andersen 201488: estimate = –3%, 95% CI: –9% to 3%; P = 0·29, n = 744). |
| CRITICAL |
| Diet: energy intake (follow-up: range: 1 mo to 3 mo; assessed with: mean kcal/d) | |||||||||
| 3 | Randomied trials | Seriousd | Seriouse | Not serious | Seriousf | None | Two trials aimed to reduce undernutrition (Jacoby 1996,81 Murphy 200384); 1 reported a clear effect favoring the intervention and the other reported an unclear effect potentially favoring the intervention. One trial (Andersen 2014)88 aimed to prevent obesity: it reported an unclear effect potentially favoring the intervention. |
| CRITICAL |
| Purchasing behavior/sales data—not reported | |||||||||
| — | — | — | — | — | — | — | — | — | CRITICAL |
| Nutrient and calorie content of available foods—not reported | |||||||||
| — | — | — | — | — | — | — | — | — | CRITICAL |
| Exposure to marketing of FNABs—not reported | |||||||||
| — | — | — | — | — | — | — | — | — | CRITICAL |
| Anthropometry: overweight/obesity | |||||||||
| 2 | Randomized trials | Seriousa | Not serious | Not serious | Not serious | None | Two trials aimed to prevent obesity (Ask 2006,80 Andersen 201488) reported no difference in effect on BMI (kg/m2) or BMI z score |
| IMPORTANT |
Abbreviations: BMI, body mass index; FNAB, food and nonalcoholic beverage; GRADE, Grading of Recommendations Assessment, Development and Evaluation; MD, mean difference; OR, odds ratio.
Downgraded by 1 level for risk of bias: 1 or more studies at unclear overall risk of bias.
Not downgraded due to indirectness: although the evidence is from only 1 study in a high-income setting, the guideline development group opted for not downgrading for indirectness.
Downgraded by 1 level for indirectness: 1 study is of breakfast provision to primary school children in Wales (Moore 2014) and the other is of provision of morning and afternoon snacks and lunch to primary school children in Denmark, with meals following the Nordic Nutrition Standards (Andersen 2014). These settings may not reflect low-resource settings.
Downgraded by 1 level due to risk of bias: 2 studies at high and 1 at unclear overall risk of bias.
Downgraded by 1 level due to inconsistency: although all 3 studies report the same direction of effect, the magnitude of the effect varies across them
Downgraded by 1 level due to imprecision: 2 of the 3 studies have wide CIs.
Consumption of discretionary food and nonalcoholic beverages
Evidence from 2 trials indicates that the provision of school meals likely results in little to no difference in the consumption of unhealthy items consumed at breakfast or of sugar or candy (2 studies, n = 3768 children; low-certainty evidence).79,88 One PCS,101 which assessed universal vs income-based access to school meals in the United Kingdom, reported a clear effect favoring the intervention on the percentage of students consuming soft drinks at lunchtime (MD = –16 pp; P < 0.05) and an unclear effect potentially favoring the control on the percentage of students consuming cakes and other types of sweets at lunchtime (MD = 2 pp; P > 0.05) after 2 years.
Diet
The evidence is very uncertain about the effect of direct provision of school meals on energy intake at 1 to 3 months (3 trials, n = 1643; very-low-certainty evidence). Two trials aimed to reduce undernutrition. Both reported an increase in energy intake; however, the effect was clear for 1 study assessing a breakfast program (4 cookies and an instant drink) in primary schools in Peru 81 and unclear for the other assessing the provision of a stew in primary schools in Kenya.90 The third trial aimed to prevent obesity through the provision of a morning and afternoon snack and lunch following the Nordic nutrition standards88; it reported an unclear effect potentially favoring the intervention. One cluster RCT, at unclear overall risk of bias, assessing free breakfast compared with an income-based breakfast program reported a small decrease in energy intake/day with the intervention (MD = −32 kcal; 95% CI: –54.17 to –9.83; n = 3347 children).86
Anthropometric outcomes
Of 5 trials reporting on BMI measures (kg/m2 or BMI z scores), 2 aimed to prevent obesity80,88 and evidence from these trials indicates that the provision of school meals likely results in little to no difference to BMI (2 trials, n = 798 children; moderate-certainty evidence). Of 7 PCSs reporting BMI or BMI z scores, 6 aimed to prevent obesity,91 with 2 reporting clear effects favoring the control,91,94 1 reporting unclear effects potentially favoring the control,90 and 3 studies reporting an unclear effect potentially favoring the intervention.100 A pooled analysis of 2 of these studies90,94 reporting on BMI (kg/m2) indicates that providing healthy school meals slightly increases BMI at 4 to 8 months (seeFigure S4 in the Supporting Information online). A pooled analysis of the other 2 of these studies reporting on BMI z scores91,97 shows that providing school meals results in a small increase in BMI z scores (MD = 0.13; 95% CI: 0.02 to 0.24; n = 1990 children; I2 = 0%) (seeFigure S5 in the Supporting Information online).
Comparison 10. Provision of milk at school vs no intervention
Two trials assessed the daily provision of milk, in primary schools in the United Kingdom over 21 months103 and in preschools in Sweden over 3 months.102 Baker et al103 was at unclear overall risk of bias and Koivisto et al102 was at high overall risk of bias.
Purchasing behavior/sales data
Milk provision likely increased the selection of milk with the school lunch instead of water (1 study, n = 132 children; moderate-certainty evidence; Table 15).102
GRADE evidence profile for comparison 10
| Question: Milk provision compared with no intervention for health and other outcomes Setting: Preschools in a high-income country (Sweden) | |||||||||
|---|---|---|---|---|---|---|---|---|---|
| Certainty assessment | Effect | Certainty | Importance | ||||||
| No. of studies | Study design | Risk of bias | Inconsistency | Indirectness | Imprecision | Other considerations | |||
| Consumption of healthy FNABs—not reported | |||||||||
| — | — | — | — | — | — | — | — | — | — |
| Consumption of discretionary FNABs—not reported | |||||||||
| — | — | — | — | — | — | — | — | — | — |
| Diet: energy intake—not reported | |||||||||
| — | — | — | — | — | — | — | — | — | — |
| Purchasing behavior/sales data (follow-up: 4 mo; assessed with: % of children who selected milk with school lunch) | |||||||||
| 1 | Randomized trials | Seriousa | Not serious | Not seriousb | Not serious | None | One trial (Koivisto 1994102) assessing the provision of milk with school lunch to children in preschool in Sweden reported a clear effect favoring the intervention on the percentage of children selecting milk with their school lunch instead of water. |
| CRITICAL |
| Nutrient and calorie content of available foods—not reported | |||||||||
| — | — | — | — | — | — | — | — | — | — |
| Exposure to marketing of FNABs—not reported | |||||||||
| — | — | — | — | — | — | — | — | — | — |
| Anthropometry: overweight/obesity—not reported | |||||||||
| — | — | — | — | — | — | — | — | — | — |
Abbreviations: FNAB, food and nonalcoholic beverage; GRADE, Grading of Recommendations Assessment, Development and Evaluation.
Downgraded by 1 level due to risk of bias: 1 study at unclear risk of selection bias and high risk of attrition bias.
Not downgraded due to indirectness: although evidence is only from 1 study in a high-income country, which may not be representative of other relevant settings where effects of milk provision could be different, the guideline development group opted not to rate down for indirectness.
Anthropometric outcomes
One trial103 reported an unclear effect potentially favoring the intervention on growth in height (MD = 0.28 cm; 95% CI: –0.01 to 0.57) and in weight (MD = 0.13; 95% CI: –0.23 to 0.49) at 21 months.
DISCUSSION
Summary of main results and comprehensiveness of the evidence
This review included 74 studies evaluating the effects of nutrition standards, nudging interventions, and direct food provision, across 10 comparisons.
Nutrition standards to increase availability of healthy food and beverages at school may increase the consumption of healthy foods and beverages and may reduce the consumption of unhealthy foods and beverages (low-certainty evidence), may reduce energy intake slightly (low-certainty evidence), may result in little to no difference to the proportion of children selecting target healthy foods (low-certainty evidence), and effects on obesity trends are very uncertain (very-low-certainty evidence). Nutrition standards to increase the availability of healthy beverages at school may make little to no difference in the consumption of SSBs (low-certainty evidence).
Nudging interventions that influence food presentation may increase intake of healthy foods (low-certainty evidence), may increase the selection of target foods (low-certainty evidence), and their effects on energy intake is very uncertain (very-low-certainty evidence). Nudging interventions that influence food positioning may increase the consumption of water (low-certainty evidence) and may increase the selection of target foods (low-certainty evidence). Nudging interventions that reduce portion sizes served may reduce energy intake slightly (low-certainty evidence). Implementing multiple nudging strategies likely makes little to no difference in vegetable intake (moderate-certainty evidence), probably reduces energy intake (moderate-certainty evidence), and may make little to no difference in selecting vegetables (low-certainty evidence).
Fruit or vegetable provision at school may increase their intake slightly (low-certainty evidence), likely makes little to no difference in the consumption of unhealthy foods or in energy intake (moderate-certainty evidence), and may increase BMI slightly (low-certainty evidence). Meal provision at school likely makes little to no difference in consuming healthy items at breakfast, in consuming unhealthy items, or in BMI (moderate-certainty evidence), and the effects on energy intake are very uncertain (very-low-certainty evidence). Milk provision at school likely increases selection of milk (moderate-certainty evidence).
No eligible studies assessing marketing restrictions of unhealthy food and beverages or pricing policies to promote healthier alternatives were identified. Some of the studies screened addressed these interventions but had ineligible study designs. Very few studies were conducted in low-income settings, which may affect the applicability of these interventions in these settings. Included studies did not report on 2 of the critical outcomes: nutrient and calorie content of available foods and exposure to marketing of FNABs. The latter was only relevant for 1 category of interventions for which no studies were included, which explains why it was not reported. For each included comparison, many critical and important outcomes were not reported in included studies. All of these gaps represent opportunities for future research.
Quality of the evidence
Across all comparisons, most of the evidence was of low certainty. Reasons for downgrading were related to high or unclear overall risk of bias and imprecision due to small sample sizes and large CIs that include both appreciable harm and benefit. Although most of the evidence was from HICs, which may not be representative of all relevant settings, the WHO guideline group opted not to downgrade due to indirectness.
Comparison with similar studies
Existing reviews in this field, some of which had limitations in the rigor of conduct, and which have included other types of study designs, have reported similar results to our review overall. A recent review assessing the impact of school food environment policies included 91 RCTs and quasi-experimental studies, all in HICs and with high heterogeneity18; we also included mostly studies from HICs and found the evidence base to be highly heterogeneous. This study reported that FV provision in schools slightly increased consumption of fruits or vegetables and no impact on calorie intake; our review also found little to no effect on energy intake, but we found little to no difference in FV intake. In terms of nutrition quality standards, they reported that these increased the consumption of healthy snacks and beverages and reduced consumption of unhealthy snacks and beverages, which our review also found. They reported no effect on energy intake, whereas our review found a slight reduction in energy intake with the intervention Another review assessing the effects of school wellness policies that increased access to healthy foods at schools, such as the US federally reimbursable meal programs, reported that 14 of 19 studies showed improved selection, intake, and sales of healthy foods, and decreased plate waste.19 This contrasts with our review, which found that school meal provision makes little to no difference in the consumption of healthy or unhealthy foods. A review of environmental interventions to reduce SSB consumption reported low-certainty evidence that reducing the availability of SSBs in schools was associated with reduced SSB consumption.104 Our review also found that nutrition standards for food and beverages in schools may reduce the consumption of SSBs. A review of population-level interventions for obesity prevention included studies in the school setting; some of these that evaluated physical activity interventions (3/6), food/beverage environment (8/14), and all 4 evaluating both types of interventions reported beneficial effects on body weight.105 We found that the evidence of effects on body weight was very uncertain for nutrition standards and FV provision, or that for meal provision there was little to no difference in effect. The obesity-prevention review also reported reduced SSB intake with state- or school-wide policies to decrease access to SSBs and a beneficial effect on FV intake with competitive food policies. These findings are similar to ours, as described above. Of 2 recent reviews evaluating nudging interventions in schools, 1 reported that results of the 12 studies were inconclusive,106 and the other, which included 25 studies assessing a variety of strategies, reported that most studies showed improved selection and intake of target foods.58 Our review found that implementing multiple nudging strategies makes little difference in vegetable intake or selection but that it probably reduces energy intake. Both studies reported problems with the quality of the evidence base, which we also report.
Strengths and limitations
Although Cochrane Review methodology was followed, potential biases could have been introduced due to pragmatic decisions we had to make during the review process.
Although we intended to search African Journals Online (AJOL), access to the database could not be secured; Africa Wide Info was searched instead. There had also been an intention to search WHO’s International Clinical Trials Registry Platform (ICTRP); however, due to COVID-19 demands this database was available only to WHO staff at the time the searches were conducted. The reference lists of included studies or systematic reviews identified were not searched, as initially intended. Given the extensive search results, it is unlikely relevant studies were missed.
Where multiple outcome measures for the same outcome were reported in the same study, measures were selected for the synthesis, which could have introduced selective reporting bias. To ensure transparency, all relevant measures reported in included studies are presented in S2 File.
When assessing risk of bias due to missing outcome data, an approach based on a threshold was used, which is no longer recommended. This could have caused the classification of more studies at risk of attrition bias.
As the main synthesis approach was based on ED, it was not possible to draw conclusions on mean effect size for many outcomes.
CONCLUSION
The body of evidence included in this review indicates that interventions that address the school food environment may have modest beneficial effects on certain key outcomes. Implementation of these interventions should consider the local context and factors that would enable or limit implementation. Most of the evidence currently included in the review is from HICs and it would therefore be important to take this into consideration when making decisions about implementation of these interventions in lower-income settings.
Acknowledgments
The authors thank Joy Oliver (Cochrane SA, SA Medical Research Council) for developing and implementing the search strategy; Anel Schoonees (Centre for Evidence-based Health Care, Stellenbosch University) for helping conduct the searches on some databases; Kerry Dwan (Cochrane Methods Support Unit) for methods advice regarding the inclusion of crossover trials; Yusentha Balakrishna and Charl Janse Van Rensburg (Biostatistics Unit, SA Medical Research Council) for support with statistical queries during data extraction; Selvan Naidoo (Cochrane SA) for support with screening titles and abstracts; Ntombi Blose (University of Cape Town) for help with drafting the characteristics of included studies document/matrix; and Elie Akl (American University of Beirut) for peer reviewing the report of this review before it was presented to the Guideline Development Group.
Funding. This review was commissioned and supported by the WHO (registration 2020/1001698–0). The WHO reviewed and approved the protocol for the systematic review and reviewed the initial report of the completed systematic review. S.D., T.K., M.W., and A.G. are partly supported by the Research, Evidence, and Development Initiative (READ-It; https://www.evidence4health.org/). READ-It (project number 300342–104) is funded by UK aid from the UK government; however, the views expressed do not necessarily reflect the UK government’s official policies. The authors are staff of Cochrane South Africa, which was commissioned to do the review by the WHO.
Declaration of interest. The authors have no relevant interests to declare.
Abbreviations: BMI, body mass index; ED, effect direction; FNAB, food and nonalcoholic beverage; FV, fruits and vegetables; HIC, high-income country; ITS, interrupted time-series; MD, mean difference; OR, odds ratio; PCS, prospective controlled study; RCT, randomized controlled trial; SSB, sugar-sweetened beverage; WHO, World Health Organization; pp: percentage points.
Supporting Information
The following Supporting Information is available through the online version of this article at the publisher’s website.
S1 File Search strategies
S2 File Results of individual studies
S3 File List of excluded studies
S4 File Summary of studies awaiting classification
S5 File Summary of ongoing studies
S6 File Characteristics of included studies
S7 File Detailed risk-of-bias assessment
S8 File Effects of interventions on outcomes other than key outcomes
S9 File Supplementary figures
S10 FilePRISMA checklist
Figure S1 Harvest plot for comparison 3
Figure S2 Harvest plot for comparison 4
Figure S3 Harvest plot for comparison 5
Figure S4 Forest plot for comparison 9: school meals provision vs no intervention. Outcome: BMI (kg/m2; prospective controlled studies)
Figure S5 Forest plot for comparison 9: provision of school meals vs no intervention. Outcome: BMI z scores (prospective controlled studies)
