


ABSTRACT
Ischaemic end-organ damage during haemodialysis (HD) is a significant problem that may be ameliorated by intradialytic cooling. A randomised trial was performed to compare standard HD (SHD; dialysate temperature 37°C) and programmed cooling of the dialysate [thermocontrolled HD (TCHD)] using multiparametric magnetic resonance imaging (MRI) to assess structural, functional and blood flow changes in the heart, brain and kidneys.
Prevalent HD patients were randomly allocated to receive either SHD or TCHD for 2 weeks before undergoing serial MRI at four time points: pre-, during (30 min and 180 min) and post-dialysis. MRI measures include cardiac index, myocardial strain, longitudinal relaxation time (T1), myocardial perfusion, internal carotid and basilar artery flow, grey matter perfusion and total kidney volume. Participants then crossed to the other modality to repeat the study protocol.
Eleven participants completed the study. Separation in blood temperature between TCHD (−0.1 ± 0.3°C) and SHD (+0.3 ± 0.2°C; P = .022) was observed, although there was no difference in tympanic temperature changes between arms. There were significant intradialytic reductions in cardiac index, cardiac contractility (left ventricular strain), left carotid and basilar artery blood flow velocities, total kidney volume, longitudinal relaxation time (T1) of the renal cortex and transverse relaxation rate (T2*) of the renal cortex and medulla, but no differences between arms. Pre-dialysis T1 of the myocardium and left ventricular wall mass index were lower after 2 weeks of TCHD compared with SHD [1266 ms (interquartile range 1250–1291) versus 1311 ± 58 ms, P = .02; 66 ± 22 g/m2 versus 72 ± 23 g/m2, P = .004].
HD adversely affects cardiac function, reduces carotid and basilar artery blood flow and total kidney volume, but mild dialysate cooling using a biofeedback module did not result in differences in intradialytic MRI measures compared with SHD.
What was known:
Cooling the dialysate has been shown to reduce dialysis-induced left ventricle wall motion abnormalities compared with standard dialysis.
The recent MyTEMP randomised controlled trial of a unit-wide application of individualised dialysate cooling was neutral, raising questions as to why the previously reported benefits of dialysis cooling on dialysis-associated cardiac dysfunction did not translate to improved patient outcomes.
This study adds:
Within the setting of a randomised trial, we used magnetic resonance imaging assessments during dialysis to assess the effects of dialysis on the structure, function and blood flow of multiple organs in parallel.
We used this approach to compare the organ-specific effects of dialysate cooling simultaneously on the heart, brain and kidneys. We observed significant intradialytic decreases in cardiac contractility, carotid and basilar blood flow and kidney volume and T1 relaxation, but no benefit from modest cooling.
Potential impact:
While cooled dialysate remains an evidence-based intervention for patients prone to intradialytic hypotension, it remains uncertain whether cooled dialysate should be recommended to reduce end-organ damage in all patients.
The degree of dialysate cooling required, and whether specific patient subgroups would benefit in this way, requires further study.
INTRODUCTION
The burden of organ dysfunction is high in haemodialysis (HD) populations. The prevalence of congestive heart failure can reach 43% [1], and cognitive dysfunction affects 7–70% of patients [2, 3] with deficits in attention, orientation and higher executive functioning [4]. These comorbidities are associated with high hospitalisation rates, poor quality of life and increased mortality [5]. Several HD treatment-related factors play a role in the aetiology of end-organ injury. Repeated intradialytic cardiac stunning (a reversible, subclinical ischaemia-driven myocardial dysfunction) during HD has been shown to increase left ventricular (LV) systolic dysfunction and the risk of mortality [6–8]. Similar recurrent ischaemic insults in the brain lead to neurological sequelae [9]. Transcranial Doppler studies have demonstrated reductions in middle cerebral artery blood flow velocity [10], and a 10% reduction in global cerebral blood flow was reported using intradialytic positron emission tomography (PET)-computed tomography (CT) [11] that associated with higher tympanic temperature and greater ultrafiltration volumes [11].
Dialysate cooling reduces haemodynamic instability [12, 13] and is recommended by the European Best Practice Guidelines for prevention of intradialytic hypotension (IDH) [14]. In some studies, cooling the dialysate has been shown to have protective effects on HD-induced ischaemic organ injury [15, 16]. However, shivering and discomfort are experienced more frequently with cooled compared with standard dialysis [17]. Biofeedback systems have been developed to automatically adjust dialysate temperature in response to blood temperature to achieve isothermic dialysis [15] or deliver a prescribed rate of programmed cooling.
Recently, the MyTEMP cluster randomised trial, performed between April 2017 and April 2021, reported that unit-wide dialysate cooling across 84 dialysis centres comprising 15 413 patients did not improve a combined endpoint of cardiovascular death or hospital admission with a major cardiovascular event [18]. There was a separation of 0.61°C between groups in prescribed dialysate temperature, with a dialysate temperature of 36.5°C in the control group and individualised dialysate temperature cooling in the intervention arm (0.5°C below pre-dialysis body temperature); however, MyTEMP's design did not allow body temperature measurements. Results from this trial do not preclude a benefit of dialysate cooling for individual patients but do raise questions as to which patients may benefit and how dialysate cooling should be administered [19].
We aimed to study organ-specific effects of dialysate cooling using quantitative magnetic resonance imaging (MRI) of the heart, brain and kidney to assess structure, function and blood flow. We performed a randomised controlled crossover trial comparing standard dialysis with programmed cooled dialysis using a biofeedback device.
MATERIALS AND METHODS
Study design and participants
HD-REMODEL (HaemoDialysis interventions to Reduce MultiOrgan Dysfunction and Effect on quality of Life assessed by MRI scanning; NCT03280901) was a prospective, randomised, open-label, blinded endpoint, crossover study in prevalent HD participants. Participants were recruited from a single site (University Hospitals of Derby and Burton NHS Foundation Trust, UK) between March 2018 and May 2019. The study was approved by an independent ethics committee (East Midlands Research Ethics Committee reference 17/EM/0235) and procedures followed were in accordance with the Helsinki Declaration of 1975, as revised in 2013; all participants provided written informed consent.
Participants 18–80 years of age with kidney failure and treated with HD for >3 months were eligible. All patients had a functioning arteriovenous fistula (AVF) as dialysis access. Exclusion criteria were hypotension during HD in the 4 weeks prior to recruitment, bilateral nephrectomy, New York Heart Association stage IV heart failure, active infection or malignancy, contraindications to MRI, pregnancy or medical conditions/physical frailty that precluded participation.
Sample size estimation
The sample size was defined using data from our previous intradialytic cardiac MRI study [20], in which we measured cardiac index pre- and during standard dialysis, with observed values of 3.6 ± 0.2 L/min/m2 [standard deviation (SD) 0.7] pre-dialysis and 2.6 ± 0.2 L/min/m2 (SD 0.7) at 230 min through dialysis. For these data, the within-subject SD was 0.39 L/min/m2, calculated from repeat measures of pre-dialysis cardiac index (unpublished data). For an improvement in cardiac index of 0.35 L/min/m2 at 230 min using TCHD compared with SHD, a sample size of 10 would be the minimum required (80% power, matched paired t-test with 0.05 one-sided significance). This calculation was performed with G*Power 3.1.9.2.
Randomisation and blinding
Participants were randomised to one of two study arms: SHD with a fixed 37°C dialysate temperature or TCHD using a commercial programmed biofeedback system [body temperature monitor (BTM); Fresenius Medical Care, Bad Homburg, Germany] to deliver a change in blood temperature of −0.5°C during dialysis. Block randomisation was used with varying block sizes to reduce predictability (Sealed Envelope). After randomisation, participants underwent six sessions of the initial dialysis modality before crossing over to receive six sessions of the alternative dialysis modality. MRI was performed on the final dialysis treatment of each arm (dialysis sessions 6 and 12), collecting serial scans before, during and after dialysis (Fig. 1A). MRI acquisition and analysis team members were blinded to treatment allocation.
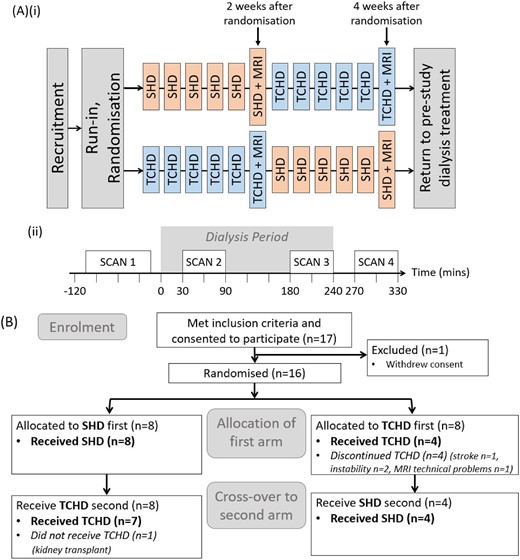
(A) Study treatment schedule (i) with schematic of MRI study day schedule with the timing of the four MRI scans in relation to the dialysis period (ii). (B) Consort diagram of flow of participants in the study.
Study procedures and schedules
Dialysis sessions were conducted using a Fresenius 5008 machine. Dialysate flow was 500 ml/min with a minimum blood pump speed of 300 ml/min. The participant's usual anticoagulation was used and the dialysate composition was sodium 137 mmol/L, potassium 2.0 mmol/L, calcium 1.25 mmol/L, magnesium 0.5 mmol/L and glucose 1.0 g/L.
MRI study sessions were performed at the Sir Peter Mansfield Imaging Centre (University of Nottingham, Nottingham, UK), where scanner facilities were adapted to enable intradialytic MRI. The dialysis machine was situated outside the scanner room, adjacent to a wave guide. Bloodlines were extended by 0.6 m on both arterial and venous sides and run through the wave guide, connected to non-ferrous 15 G silicon dialysis needles used to cannulate the AVF. Participants underwent serial MRI (Fig. 1A(ii)): pre-dialysis (scan 1), 30 and 180 minutes into dialysis (scans 2 and 3) and 30 min post-dialysis (scan 4).
Blood pressure (BP) was recorded every 15 min during dialysis using the integrated BP cuff and IDH defined as a decrease in systolic BP to <90 mmHg or a decrease in systolic BP of >20 mmHg from baseline. Clinical measurements were taken before and after dialysis of body weight; bioimpedance measurements of total body, intracellular and extracellular water (Fresenius body composition monitor); tympanic temperature and laboratory tests (haematology and biochemistry panels, N-terminal prohormone of brain natriuretic peptide and troponin-T). Ultrafiltration volume and relative blood volume change were recorded. Routine clinical data and demographic details were collected from medical records. The Qa:cardiac output (CO) ratio was calculated to identify participants with a high-flow AVF (Qa:CO >20%) [21].
MRI acquisition and analysis
Heart, brain and kidney MRI measures were collected on a 3.0 T Ingenia wide bore scanner (Philips Healthcare Systems, Best, The Netherlands) using a Torso coil combined with posterior coil and HeadSpine coil as summarised below. A complete description is provided in Appendix 1.
Cardiac structure and function
Cardiac MRI assessed LV function, myocardial wall strain, longitudinal relaxation time (T1) and myocardial perfusion. LV short-axis cine data were collected to calculate stroke volume, cardiac output and LV wall mass using Intellispace software (Philips Medical Systems). Measures were indexed to patient body size by dividing by body surface area (BSA) to compute the stroke volume index (ml/m2), cardiac index (L/min/m2) and LV wall mass index (LVMI; g/m2). MR tagging through the LV (long and short axis) assessed myocardial wall strain using CIMv8.1Tag2D (Auckland UniServices, Auckland, NZ) software to calculate peak longitudinal and circumferential strain (%). A native 5s-(3s)-3s shortened modified Look-Locker inversion recovery (shMOLLI) scheme assessed myocardial T1 (ms) using in-house MATLAB (MathWorks, Natick, MA, USA) software. A cardiac-gated shMOLLI-based [5b-(7s)-3b scheme] FAIR (flow alternating inversion recovery) arterial spin labelling (ASL) technique, analysed using in-house MATLAB software, assessed myocardial perfusion (ml/100 g/min).
Brain structure and function
FAIR ASL with in-house MATLAB software was used to calculate grey matter perfusion (ml/100 g/min). Phase contrast (PC)-MRI computed right and left internal carotid and basilar artery flow [mean over cardiac cycle of vessel cross-sectional area (mm2), blood velocity (cm/s), and blood flow (ml/s)] using Viewforum Qflow software (Philips Medical Systems).
Kidney structure and function
Structural scans were used to compute total kidney volume (TKV; ml) (MIPAV version 8.0.2 software [22]) adjusted for body size by dividing by BSA. Inversion recovery spin echo-echo planar imaging with respiratory triggering quantified cortex and medulla T1, and a multi-echo fast field echo determined blood oxygenation level–dependent (BOLD)-MRI transverse relaxation time (T2*) of the cortex and medulla. Renal perfusion was quantified using a respiratory-triggered FAIR ASL scheme. In-house MATLAB software generated T1 (ms), T2* (ms) and perfusion (ml/100 g/min) maps.
Outcomes
Primary outcomes were cardiac index and cerebral and renal perfusion. Secondary outcomes included LV strain, myocardial T1, carotid and basilar artery blood flow, TKV and renal cortex T1 and T2*.
Safety endpoints were collected to determine the tolerability of intradialytic MRI, symptoms during TCHD and frequency of adverse events.
Statistical analysis
Statistical analysis was performed using SPSS (version 24; IBM, Armonk, NY, USA) and PRISM 9 (GraphPad Software, San Diego, CA, USA), with P < .05 considered significant. Continuous variables are expressed as mean ± SD for normally distributed data or median {25th–75th percentiles [interquartile range (IQR)]} for data not normally distributed. Categorical variables are expressed as percentages. For clinical data, paired sample tests compared SHD and TCHD for pre- and post-dialysis, and pre- and post-dialysis for each modality (t-test for normal data, Wilcoxon for non-normal data). For MRI data, paired sample tests were performed to compare baseline pre-dialysis parameters from both visits (t-test for normal data, Wilcoxon for non-normal data).
To assess the interaction of dialysis modality and time for BP measures, a repeated measures analysis of variance (ANOVA) was used. To assess the interaction of dialysis modality and time for MRI measures, a mixed-effects model analysis of repeated measures data was used (PRISM 9), since repeated measures ANOVA cannot handle missing values. This mixed model uses a compound symmetry covariance matrix and is fit using restricted maximum likelihood. In the presence of missing values (missing completely at random), the results can be interpreted like repeated measures ANOVA. Sphericity was not assumed and the Geisser–Greenhouse correction was used.
RESULTS
Enrolment and participant characteristics
A total of 17 participants were recruited (Fig. 1B): 1 withdrew consent prior to commencing, 4 were withdrawn before completion of the first arm (3 with intercurrent illness, 1 due to MRI technical problems) and 1 received a kidney transplant during the second arm.
Therefore, 11 participants completed both arms to compare SHD and TCHD. Their demographics and clinical characteristics are shown in Table 1. Two participants had a Qa >1000 ml/min and only one participant had a Qa:CO >20%. Five participants had their MRI study days on the first dialysis session of their week (Monday or Tuesday), five on their second session (Thursday) and one on their third session (Friday). The two scan sessions for a given subject were always performed on the same dialytic day of their week. There were no clinically meaningful differences between SHD and TCHD in the majority of clinical or laboratory variables measured pre- and post-dialysis (Supplementary Table S1). There was a difference in the change in body temperature (measured by BTM) during TCHD (−0.1 ± 0.3°C) compared with SHD (+0.3 ± 0.2°C; P = .02), although this was not matched by a difference in the change in tympanic temperature between arms (SHD: +0.18 ± 0.27°C versus TCHD: +0.07 ± 0.46°C; P = .7). There were no differences in BP or ultrafiltration volume between arms.
Demographics and clinical characteristics of the 11 participants who completed the study.
| Characteristics | Values |
|---|---|
| Age (years), median (IQR) | 55 (50–77) |
| Male, n (%) | 9 (82) |
| Ethnicity, n (%) | |
| White | 8 (73) |
| Black | 1 (9) |
| Asian | 2 (18) |
| Aetiology of kidney disease, n (%) | |
| Diabetes | 3 (27) |
| Glomerulonephritis | 2 (18) |
| Hypertension/ischaemic nephropathy | 2 (18) |
| Chronic pyelonephritis | 2 (18) |
| Interstitial nephritis | 1 (9) |
| Unknown | 1 (9) |
| Time since (months), median (IQR) | |
| Kidney failure | 10 (5–56) |
| Haemodialysis initiation | 6 (5–23) |
| Comorbid conditions, n (%) | |
| Ischaemic heart disease | 2 (18) |
| Cerebrovascular disease | 1 (9) |
| Hypertension | 10 (91) |
| Ischaemic/neuropathic ulcers | 1 (9) |
| Previous fracture | 2 (18) |
| Taking antihypertensive medication, n (%) | 6 (55) |
| Smoking status, n (%) | |
| Current | 1 (9) |
| Previous | 5 (45) |
| Never | 5 (45) |
| Vascular access, n (%) | |
| Left arm AVF | 9 (82) |
| Right arm AVF | 2 (18) |
| Brachiocephalic (proximal) AVF | 5 (45) |
| Radiocephalic (distal) AVF | 6 (55) |
| AVF blood flow (Qa, ml/min), median (IQR) | 719 (601–919) |
| Qa:CO ratio (%), median (IQR) | 15 (11–16) |
| Residual renal function | |
| Urine output >500 ml/24 h, n (%) | 4 (36) |
| Creatinine clearance (ml/min), median (IQR) | 0.42 (0–8.0) |
| Anthropomorphic measurements, mean ± SD | |
| Euvolaemic body weight (kg) | 80.3 ± 15.8 |
| Height (m) | 1.71 ± 0.08 |
| BMI (kg/m2) | 27.4 ± 4.5 |
Median (25th–75th percentile) values are reported for non-parametric data, Means ± standard deviation (SD) for normally distributed data; numbers (percentages) are reported for categorical data. HD, Haemodialysis, AVF, arteriovenous fistula, Qa, arteriovenous fistula blood flow, BMI, body mass index.
Systolic BP (SBP) and diastolic BP (DBP) decreased significantly during dialysis treatment (both P < .001; Fig. 2A), with no difference between SHD and TCHD (P = .80 for SBP, P = .6 for DBP). There were 5 episodes of IDH in three participants in the TCHD arm and 16 episodes in four participants in the SHD arm during the entire study.
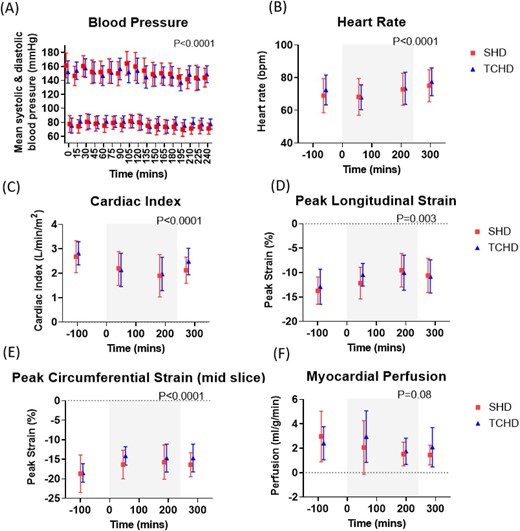
Changes during SHD and TCHD sessions in (A) SBP and DBP, (B) heart rate, (C) cardiac index measured from the short-axis cine, (D) peak longitudinal strain and (E) peak circumferential strain measured from MR tagging and (F) myocardial perfusion measured from MOLLI-based arterial spin labelling. Grey box indicates period of dialysis. P-values shown for effect of time; there were no differences between modalities in any of the measures.
Outcomes
Cardiac MRI
Figure 2 shows absolute cardiac MRI measures during dialysis (Supplementary Fig. S1 shows the percentage change), with statistical results provided in Supplementary Table S2. Cardiac index was the outcome used to power the study. The baseline cardiac index was 2.7 ± 0.7 L/min/m2 for SHD and 2.8 ± 0.5 L/min/m2 for TCHD (P > .99, Supplementary Table S5). There was a significant intradialytic reduction in the cardiac index in both arms, but no difference between SHD and TCHD. The largest reduction in the cardiac index was seen at scan 3 (SHD: 26 ± 8%, TCHD: 28 ± 6%), with partial recovery observed at scan 4, post-dialysis. A similar pattern was observed for the stroke volume index.
Myocardial longitudinal and circumferential strain decreased during dialysis (became less negative, indicating a reduction in myocardial contractility) in both arms. Longitudinal strain was more negative before dialysis in the SHD arm (−13.7 ± 2.8%) compared with TCHD (−12.9 ± 3.6%; P = .02).
Myocardial perfusion decreased during dialysis (P = .08), but there was no difference between SHD and TCHD (P = .6).
Myocardial T1 and LVMI were lower pre-dialysis in the TCHD arm compared with SHD [T1: 1266 ms (IQR 1250–1291) in TCHD, 1311 ± 58 ms in SHD, P = .02; LVMI: 66 ± 22 g/m2 in TCHD, 72 ± 23 g/m2 in SHD, P = .004]. Individual subject comparisons are provided in Supplementary Fig. S4. Neither measure changed during dialysis in either arm.
Cerebral MRI
Grey matter ASL perfusion pre-dialysis was 56.9 ± 6.8 ml/100 g/min on SHD and 60.6 ± 9.4 ml/100 g/min on TCHD (P = .1; Supplementary Table S5). There was no change in grey matter perfusion during dialysis and no difference between arms (Fig. 3A, Supplementary Fig. S2A). In contrast, extracranial cerebral haemodynamic changes occurred during dialysis, with significant reductions in left carotid artery and basilar artery velocity (Fig. 3B), along with a reduction in left carotid artery flux (Fig. 3C), although these were not different between arms. Statistical results are provided in Supplementary Table 3.
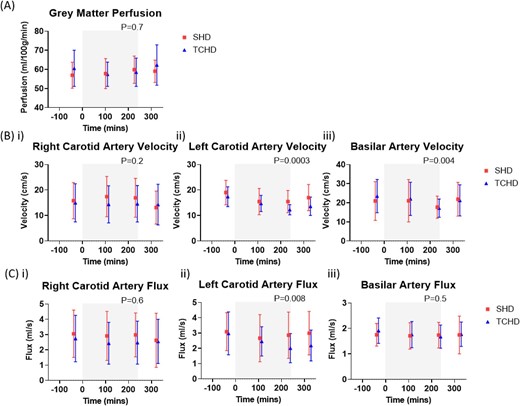
Changes in cerebral haemodynamics for SHD and TCHD sessions. (A) Grey matter perfusion measured using arterial spin labelling, (B) velocity and (C) flux of the (i) right carotid artery, (ii) left carotid artery and (iii) basilar artery measured using phase-contrast MRI. Grey box indicates period of dialysis. P-values shown for effect of time; there were no differences between modalities in any of the measures.
Renal MRI
Due to anatomical kidney abnormalities, reliable measurements of renal ASL-MRI perfusion were not possible. Data were collected on TKV and renal cortex T1 and T2* (Fig. 4, Supplementary Fig. 3). All three measures declined significantly during dialysis, with the largest reductions at scan 3 (180 mins during HD), and partial recovery in cortex T1 and T2* post-dialysis. There were no differences between arms (statistical results provided in Supplementary Table 4).
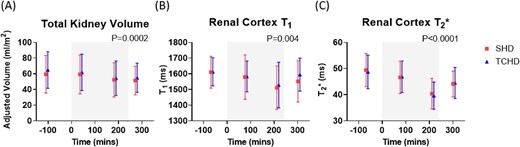
Changes in renal MRI parameters for SHD and TCHD sessions of (A) TKV measured from localiser images adjusted for subject BSA, (B) renal cortex T1 measured using spin-echo echo planar imaging and (C) renal cortex T2* measured using a multi-echo fast field echo sequence. Grey box indicates period of dialysis. P-values shown for effect of time; there were no differences between modalities in any of the measures.
Safety endpoints
Patients tolerated intradialytic MRI, with the exception of one who did not fit in the head coil. During MRI with TCHD, one subject reported feeling cold and another reported severe leg cramps at 140 and 230 min into dialysis for which treatment was provided (90-ml saline bolus at each episode). Another subject reported leg cramps during MRI with SHD, for which intervention was paused.
DISCUSSION
This study used intradialytic MRI to study the acute effects of dialysis on the heart, brain and kidneys. We observed a significant reduction in cardiac function, carotid and basilar artery blood flow and total kidney volume during dialysis. However, there was no change in tympanic temperature between TCHD and SHD and no significant differences in intradialytic MRI changes were observed. Nevertheless, small but significant differences were demonstrated in pre-dialysis structural measures of the heart, with lower myocardial T1 and LVMI in TCHD compared with SHD.
Previous studies have reported that dialysate cooling helps restore the expected physiological vasoconstrictor response to hypovolaemic stress related to ultrafiltration [23] and improves intradialytic haemodynamic stability. In a meta-analysis of 26 randomised trials, cooled dialysis reduced the risk of IDH {relative risk 0.32 [95% confidence interval (CI) 0.18–0.56]} and was associated with a 12-mmHg higher mean arterial pressure (95% CI 8–16) compared with standard dialysis [12]. Previous studies have reported reduced dialysis-induced myocardial stunning during cooled dialysis [15, 24]. In 1-year follow-up studies of cooled dialysis, preservation of LV strain parameters along with reduced LV mass [25] and protective effects on brain cortical white matter with fewer ischaemic changes [16] have been reported with cooled dialysis. Furthermore, observational studies suggest improved survival [26, 27].
In contrast, the recent MyTEMP trial did not show a benefit on hard endpoints of cardiovascular events or mortality with dialysate cooling. Explanations include that not all HD patients benefit from dialysate cooling or that the cooling ‘dose’ was insufficient (dialysate temperature 0.5°C below pre-dialysis body temperature) [19]. These hypotheses are supported by the results of our study. While we observed significant deterioration in cardiac function during dialysis in this cohort of patients who were not prone to IDH, there were no differences in intradialytic changes between arms. Further, the lack of change in tympanic temperature reflects that achieved cooling was mild and the intervention was more akin to isothermic dialysis than programmed cooling. We can therefore postulate that cooled dialysate may benefit patients prone to IDH or with a greater magnitude of cooling.
The intradialytic cardiac MRI findings we observed are consistent with previous results [20], showing reduced myocardial contractility, cardiac output and stroke volume during dialysis and a trend towards reduced myocardial perfusion, consistent with subclinical dialysis-induced ischaemia [20, 28, 29]. Despite no observed intradialytic differences in TCHD versus SHD, there were small differences in pre-dialysis structural cardiac measures, with lower myocardial T1 and LVMI with TCHD. This could reflect cardioprotective effects of dialysate cooling during the 2-week run-in phase, during which there were fewer recorded episodes of IDH with TCHD. Small reductions in myocardial T1 following HD have been reported [30]. T1 is sensitive to tissue oedema that can arise after ischaemic injury, so it is therefore plausible that if cooled dialysis was protective against subclinical dialysis-induced ischaemia during the 2-week run-in period, this mechanism might result in less tissue oedema and underlie the lower pre-dialysis myocardial T1 values in the TCHD arm. However, this needs confirmation with longitudinal studies to determine the clinical significance of these observations.
The decrease in cardiac output is likely a contributing factor in the reduction of carotid and basilar artery blood flow, consistent with previously demonstrated decreases in middle cerebral artery flow velocity using transcranial Doppler [31, 32]. Lateralisation of changes in the extracranial vascular haemodynamics to the side of HD access along with a negative correlation with access flow were reported by Chung et al. [33]. A similar phenomenon may have led to the observed differential changes in the right and left carotid artery changes in our study (Fig. 3), as 82% of our participants had vascular access on the left. Despite changes in carotid and basilar artery blood flow, we did not observe a change in grey matter ASL perfusion, in contrast to a previous PET-CT study that demonstrated a 10% decrease in cerebral perfusion in elderly dialysis patients during HD [11]. However, the average age of our participants was ≈20 years younger.
Acquisition of renal measures was challenging due to anatomical abnormalities in participants, including atrophy, acquired cystic disease and autosomal dominant polycystic kidney disease. Despite this, we demonstrated a significant reduction in TKV and renal cortex T1 and T2* during HD. These changes likely reflect reduced kidney water content and may indirectly represent an alteration in renal blood flow during HD, or the effects of ultrafiltration. These findings support previous suggestions that a loss of residual renal function in HD patients could be related to renal ischaemia driven by ultrafiltration [34] and are in keeping with a CT study demonstrating an intradialytic decrease in renal perfusion [35].
The strengths of our study include its novelty in obtaining synchronous structural and functional MRI assessments of multiple organs during dialysis and the efficient randomised crossover design with each participant acting as their own control. Weaknesses are that only modest separation in blood temperature was achieved on the MRI study days (less than in studies that have observed benefits). This might have limited the extent of physiological responses and potentially influenced our results with a bias towards the null hypothesis. It should be noted that intradialytic MRI was not performed in a hospital environment, so for safety reasons the study protocol excluded unstable HD patients (with recent IDH) who perhaps would have benefitted more from cooled dialysis. Here we investigated acute effects of dialysis but did not study longer-term organ dysfunction. We performed the final scan at 30 min post-dialysis rather than immediately after dialysis to allow time for the patient to be disconnected from the dialysis machine. No MRI data were acquired prior to patients starting the first study arm. Finally, it must also be acknowledged that high-flow vascular access may influence the systemic circulation and flow competition between vascular access and cardiac output has been described previously [36]. However, only two participants evidenced a high Qa and only one had a high Qa:CO ratio. Furthermore, the crossover study design mitigates this having a major effect on comparisons between treatments.
In conclusion, this study provides novel insights into the adverse structural and haemodynamic effects of dialysis on the heart, brain and kidneys. Mild dialysate cooling using a biofeedback module did not result in significant differences in intradialytic MRI measures compared with dialysis at 37°C, but it did result in reductions in pre-dialysis myocardial T1 and LVMI that may reflect less dialysis-induced cardiac injury over the preceding 2 weeks.
ACKNOWLEDGEMENTS
We are grateful to our study participants for taking part in this study. We acknowledge support from our research nursing colleagues and research fellows for their contribution in the conduct of this study.
FUNDING
This work was funded by Fresenius Medical Care.
AUTHORS’ CONTRIBUTIONS
B.C., M.W.T., N.M.S. and S.T.F. contributed to study conception and design. V.R.L.G. performed patient recruitment. V.R.L.G. and K.W. acquired clinical data. E.F.C., C.E.B. and S.T.F. performed MRI acquisition and analysis. V.R.L.G., E.F.C., C.E.B., M.W.T., N.M.S. and S.T.F. performed data interpretation. V.R.L.G., E.F.C., M.W.T., N.M.S. and S.T.F. drafted and edited the article. All authors approved the final version of the article and are accountable for all aspects of the work.
DATA AVAILABILITY STATEMENT
Please contact the corresponding author for data access.
CONFLICT OF INTEREST STATEMENT
B.C. reports being a past scientific consultant for Fresenius Medical Care, Bad Homburg, Germany. M.W.T. received a research grant from Fresenius Medical Care (paid to institution), consulting fees from Boehringer Ingelheim (paid to institution), speaker payment from Bayer (paid to institution) and travel support from Bayer (payment direct to conference secretarit) and has a leadership role for the International Society of Nephrology. N.M.S. reports grants from the National Institute for Health and Care Research (NIHR) and Kidney Research UK; received speaker payment from GE, Fresenius Medical Care and AstraZeneca; has a patent pending; participates on trial steering committees (TOP-CKD, STOP-ACEi, H4RT) and has leadership roles in the NIHR (renal disorders speciality lead) and Kidney Research UK Grants Committee. These sources of funding are not necessarily related to the content of the present manuscript. The other authors declare no competing interests.
REFERENCES
Author notes
Joint first authors.


Comments