


ABSTRACT
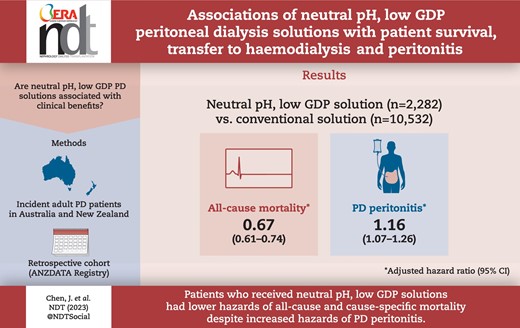
Peritoneal dialysis (PD) solutions containing low levels of glucose degradation products (GDPs) are associated with attenuation of peritoneal membrane injury and vascular complications. However, clinical benefits associated with neutral-pH, low-GDP (N-pH/L-GDP) solutions remain unclear.
Using data from the Australia and New Zealand Dialysis and Transplant Registry, we examined the associations between N-pH/L-GDP solutions and all-cause mortality, cause-specific mortality, transfer to haemodialysis (HD) for ≥30 days and PD peritonitis in adult incident PD patients in Australia and New Zealand between 1 January 2005 and 31 December 2020 using adjusted Cox regression analyses.
Of 12 814 incident PD patients, 2282 (18%) were on N-pH/L-GDP solutions. The proportion of patients on N-pH/L-GDP solutions each year increased from 11% in 2005 to 33% in 2017. During the study period, 5330 (42%) patients died, 4977 (39%) experienced transfer to HD and 5502 (43%) experienced PD peritonitis. Compared with the use of conventional solutions only, the use of any form of N-pH/L-GDP solution was associated with reduced risks of all-cause mortality {adjusted hazard ratio [aHR] 0.67 [95% confidence interval (CI) 0.61–0.74]}, cardiovascular mortality [aHR 0.65 (95% CI 0.56–0.77)], infection-related mortality [aHR 0.62 (95% CI 0.47–0.83)] and transfer to HD [aHR 0.79 (95% CI 0.72–0.86)] but an increased risk of PD peritonitis [aHR 1.16 (95% CI 1.07–1.26)].
Patients who received N-pH/L-GDP solutions had decreased risks of all-cause and cause-specific mortality despite an increased risk of PD peritonitis. Studies assessing the causal relationships are warranted to determine the clinical benefits of N-pH/L-GDP solutions.
What was known:
Peritoneal dialysis (PD) is associated with numerous complications, including local and systematic effects of glucose degradation products (GDPs).
The use of neutral-pH, low-GDP (N-pH/L-GDP) solutions is known to preserve residual kidney function. However, the benefits of other clinical outcomes are not fully elucidated.
This study adds:
The pattern of N-pH/L-GDP solution use had marked temporal and geographical variability in Australia and New Zealand.
Compared with conventional PD solutions, the use of N-pH/L-GDP solutions was associated with reduced risks of all-cause mortality, cardiovascular mortality and infection-related mortality despite an increased risk of PD peritonitis.
Potential impact:
The positive associations between N-pH/L-GDP solutions and mortality benefits provide additional evidence for the clinical outcomes of N-pH/L-GDP solutions and may influence the decision on the type of PD solution to use.
INTRODUCTION
Peritoneal dialysis (PD) provides life-saving kidney replacement therapy for patients with kidney failure. However, PD is associated with various complications, including local and systemic effects of glucose degradation products (GDPs) [1]. Studies have shown that exposure to GDPs is associated with mesothelial denudation, fibroblast cytotoxicity and induction of profibrotic cytokine and vascular endothelial growth factor (VEGF) synthesis [2–7]. In the early 2000s, neutral-pH, low-GDP (N-pH/L-GDP) PD solutions were developed in an attempt to minimise the adverse effects of GDP [8]. Morphological and functional studies comparing N-pH/L-GDP and conventional PD solutions showed retardation of peritoneal membrane alterations and diminished effects on small solute transport and free water transport in patients receiving long-term N-pH/L-GDP solutions [9].
Despite the functional benefits, the clinical outcomes of N-pH/L-GDP solution use have not been fully elucidated. Systematic reviews have demonstrated high-certainty evidence supporting the use of N-pH/L-GDP solutions for preserving residual kidney function [10–12], leading to a level 1A recommendation for their use in the International Society for Peritoneal Dialysis Guidelines [13]. However, the effects on mortality, transfer to haemodialysis (HD) and PD peritonitis remain uncertain [10]. Since the publication of the balANZ trial in 2012 [14], the use of N-pH/L-GDP solutions for prevalent PD patients in Australia and New Zealand increased from 4% in 2012 to 18% in 2020 [15, 16]. This shift in PD prescription provides an opportunity to assess the clinical outcomes of N-pH/L-GDP solutions and to better understand their long-term effects.
The aims of this study were three-fold. First, we examined the temporal and geographical trends of N-pH/L-GDP solution use in Australia and New Zealand. Second, we assessed the associations of N-pH/L-GDP solutions with PD clinical outcomes, including all-cause mortality, cause-specific mortality, transfer to HD and PD peritonitis. Third, the interactive effects between N-pH/L-GDP solutions and PD modality [continuous ambulatory PD (CAPD) versus automatic PD (APD)] with PD clinical outcomes were examined.
MATERIALS AND METHODS
Study cohort
Incident adult patients (≥18 years of age) commencing PD as the first kidney replacement therapy in Australia and New Zealand between 1 January 2005 and 31 December 2020 were included using data from the Australia and New Zealand Dialysis and Transplant (ANZDATA) Registry. Patients who had recovered kidney function or whose PD solution types had not been reported were excluded. Patients were censored at kidney transplantation, loss to follow-up or 31 December 2020, whichever came first, in all analysis models. Death was also censored in the transfer to HD and PD peritonitis models. The conduct of this study was approved by the Illawarra Shoalhaven Local Health District Research Review Committee in Australia. The study was conducted in accordance with Strengthening the Reporting of Observational Studies in Epidemiology (STROBE) guidelines [17].
Data collection
Baseline characteristics at the time of dialysis initiation were extracted from the ANZDATA Registry, including age, sex, ethnicity, body mass index (BMI), geographical location (urban/regional/remote), socio-economic status (SES, measured by the Index of Relative Socio-economic Advantage and Disadvantage using postcode and categorised into tertiles) [18], PD modality, smoking status, comorbid medical conditions (coronary artery disease, peripheral vascular disease, cerebrovascular disease, chronic lung disease, diabetes mellitus and cancer), late nephrologist referral (defined as <3 months before dialysis initiation), primary cause of kidney failure (diabetic kidney disease, glomerular disease, hypertensive nephrosclerosis, cystic kidney disease and other) and jurisdiction (state/territory/country) at dialysis initiation. Jurisdictions were included because the costs of PD solutions and equipment vary between different jurisdictions based on local contracts with the supply companies. Baseline centre-level characteristics included centre size (calculated as the mean annual number and categorised into tertiles for incident patients on PD, prevalent patients on PD and the proportion of all dialysis patients on PD) and transplant centre. The dialysis centre did not consider the potential transfer to alternative dialysis centre(s) over time.
Exposure factor
The exposure factor was types of PD solutions, comparing patients who received N-pH/L-GDP solutions anytime during the PD treatment course and patients who received conventional glucose solutions only. Types of PD solutions were reported annually using the ANZDATA end-of-year survey on 31 December. ANZDATA defined N-pH/L-GDP solutions as any glucose-containing solutions with low GDP. Icodextrin was considered as a separate type of PD solution with no influence on the exposure factor.
Clinical outcomes
The primary outcome was all-cause mortality. The secondary outcomes were cause-specific mortality (cardiovascular and infection-related mortality), transfer to HD for ≥30 days and the time to the first episode of PD peritonitis. The definitions of cause-specific mortality were included in the ANZDATA survey form [19].
Statistical analysis
The baseline data were expressed as number (percentage) for categorical data, mean [standard deviation (SD)] for normally distributed continuous data and median [interquartile range (IQR)] for non-normally distributed continuous data. The annual trends of N-pH/L-GDP solution use were examined and expressed as proportions of all patients on PD. The all-cause and cause-specific mortality and transfer to HD incidence rates were expressed as events [95% confidence interval (CI)] per 1000 patient-years. The PD peritonitis rates were expressed as episodes (95% CI) per patient-year.
The associations between N-pH/L-GDP solutions and PD clinical outcomes (all-cause mortality, cause-specific mortality, transfer to HD and PD peritonitis) were examined using adjusted Cox proportional hazards regressions via model building, expressed as the hazard ratio (HRs) and 95% CI. The starting time in all models was the time of dialysis initiation. The proportional hazards assumptions of all models were checked graphically by plotting the Schoenfeld residuals. Model 1 included non-modifiable patient-level characteristics and model 2 included additional modifiable patient-level characteristics. PD peritonitis and transfer to HD were considered as time-varying covariates in models 3–5. Centre-level characteristics were examined in models 4 and 5 using an adjusted γ-distributed Cox shared frailty model, considering initial dialysis centre as the cluster. SES and residual kidney function were included in model 5 only because missing data for these variables was >10%. Sensitivity analysis on confounding was evaluated using the E-value, which represented the minimal effect of association that an unmeasured confounder needed to have to fully explain the observed exposure–outcome associations [20].
Competing risk regression analyses were conducted using the method described by Fine and Gray [21], expressed as subdistribution hazard ratios (SHRs). Covariates included in the competing risk models were identical to those included in model 3 of the Cox proportional hazards regression models, except PD peritonitis and transfer to HD were not considered as time-varying covariates due to intrinsic limitations of competing risk analysis methodology. Kidney transplantation was considered as a competing event in all models. Causes of death other than the outcome were considered as competing events in the cause-specific mortality models. Considering the difference in equipment for N-pH/L-GDP and conventional solutions, an interactive effect between types of PD solutions and PD modality was examined using two-way interaction. Sensitivity analysis restricted to patients initiated on PD between 2016 and 2020 was conducted because of temporal differences in the use of N-pH/L-GDP solutions. Statistical evaluation was performed using SPSS version 28 (IBM, Armonk, NY, USA) and Stata version IC15.1 (StataCorp, College Station, TX, USA) statistical programmes. P-values <.05 were considered statistically significant.
RESULTS
The study cohort comprised 12 814 incident patients who commenced PD as the first kidney replacement therapy between 2005 and 2020 in Australia and New Zealand. Of these, 10 532 (82%) patients received conventional solutions only and 2282 (18%) patients received N-pH/L-GDP solutions during the course of PD therapy (Fig. 1). The median follow-up time was 2.55 years (IQR 2.22–6.94), with a total follow-up time of 41 619 person-years. Compared with patients who received conventional solutions only, patients who received N-pH/L-GDP solutions were more likely to be commenced on CAPD (83% versus 72%, P < .001) and had fewer comorbid medical conditions at the time of dialysis initiation, including coronary artery disease (23% versus 27%, P = .002) and cerebrovascular disease (8% versus 10%, P = .001) (Table 1). The differences in comorbid conditions were not observed when restricted to the years 2016–2020.
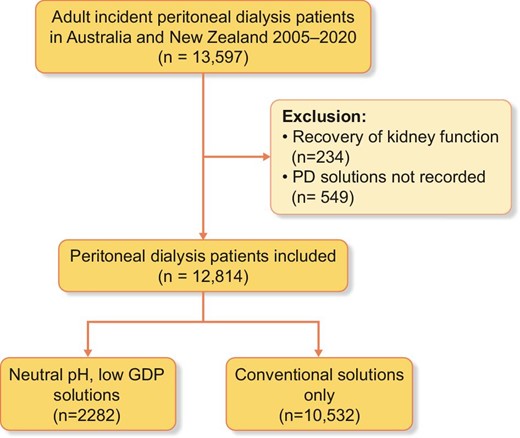
Patient flowchart for adult incident PD patients in Australia and New Zealand between 2005 and 2020.
Baseline: characteristics of adult incident PD patients in Australia and New Zealand between 2005 and 2020.
| Characteristics | N-pH/L-GDP solutions | Standard glucose solutions only | All |
|---|---|---|---|
| Patient level | |||
| Patients, n | 2282 | 10 532 | 12 814 |
| Age (years), mean ± SD | 58.1 ± 15.3 | 59.8 ± 14.7 | 59.6 ± 14.9 |
| Male, n (%) | 1339 (59) | 6382 (61) | 7721 (60) |
| Ethnicity, n (%) | |||
| Asian | 356 (16) | 1654 (16) | 2010 (16) |
| Caucasian | 1419 (62) | 6452 (61) | 7871 (61) |
| Indigenous Australian | 114 (5) | 505 (5) | 621 (5) |
| Māori | 102 (5) | 840 (8) | 942 (7) |
| Other/unknown | 289 (13) | 1081 (10) | 1370 (11) |
| BMI (kg/m2), mean ± SD | 27.9 ± 6.0 | 27.7 ± 6.1 | 27.7 ± 6.1 |
| BMI category, n (%) | |||
| Underweight | 51 (2) | 251 (2) | 302 (2) |
| Normal | 706 (32) | 3309 (32) | 4015 (32) |
| Overweight | 771 (35) | 3707 (36) | 4478 (35) |
| Obese | 709 (32) | 3176 (30) | 3885 (31) |
| Smoking status, n (%) | |||
| Non-smoker | 1120 (50) | 5102 (49) | 6222 (49) |
| Current smoker | 251 (11) | 1242 (12) | 1493 (12) |
| Ex-smoker | 872 (39) | 4120 (39) | 4992 (39) |
| Comorbid medical conditions, n (%) | |||
| Coronary artery disease | 525 (23) | 2791 (27) | 3316 (26) |
| Chronic lung disease | 174 (8) | 1043 (10) | 1217 (10) |
| Peripheral vascular disease | 248 (11) | 1457 (14) | 1705 (13) |
| Cerebrovascular disease | 174 (8) | 1051 (10) | 1225 (10) |
| Cancer | 161 (7) | 878 (8) | 1039 (8) |
| Diabetes mellitus | |||
| Type 1 | 119 (5) | 580 (6) | 699 (6) |
| Type 2 | 903 (40) | 4428 (42) | 5331 (42) |
| Late referral, n (%) | 199 (9) | 1021 (10) | 1220 (10) |
| Primary kidney disease, n (%) | |||
| Diabetic kidney disease | 808 (35) | 3975 (38) | 4783 (37) |
| Glomerular disease | 516 (23) | 2429 (23) | 2945 (23) |
| Hypertension | 306 (13) | 1488 (14) | 1794 (14) |
| Polycystic kidney disease | 178 (8) | 672 (6) | 850 (7) |
| Reflux nephropathy | 67 (3) | 296 (3) | 363 (3) |
| Other/unknown | 407 (18) | 1672 (16) | 2079 (16) |
| Socio-economic statusa, n (%) | |||
| Low tertile | 547 (28) | 2639 (33) | 3186 (32) |
| Middle tertile | 780 (39) | 3008 (38) | 3788 (38) |
| High tertile | 662 (33) | 2347 (29) | 3009 (30) |
| Geographic locationa, n (%) | |||
| Major city | 1503 (76) | 5491 (69) | 6994 (70) |
| Regional | 405 (20) | 2164 (27) | 2569 (26) |
| Remote | 81 (4) | 430 (4) | 421 (4) |
| PD modality, n (%) | |||
| CAPD | 1903 (83) | 7619 (72) | 9522 (74) |
| APD | 379 (17) | 2913 (28) | 3292 (26) |
| State at PD initiation, n (%) | |||
| New South Wales | 348 (15) | 3407 (32) | 3755 (29) |
| Victoria | 341 (15) | 1962 (19) | 2303 (18) |
| Queensland | 536 (24) | 1395 (13) | 1931 (15) |
| South Australia | 23 (1) | 647 (6) | 670 (5) |
| Western Australia | 592 (26) | 324 (3) | 916 (7) |
| Northern Territory | 27 (1) | 101 (1) | 128 (1) |
| Australian Capital Territory | 123 (5) | 5 (0) | 128 (1) |
| Tasmania | 15 (1) | 166 (2) | 181 (1) |
| New Zealand | 277 (12) | 2525 (24 | 2802 (22) |
| Era, n (%) | |||
| 2005–2010 | 337 (15) | 3511 (33) | 3848 (30) |
| 2011–2015 | 789 (35) | 3306 (31) | 4095 (32) |
| 2016–2020 | 1156 (51) | 3715 (35) | 4871 (38) |
| Icodextrin use, n (%) | |||
| At dialysis initiation | 616 (27) | 4012 (38) | 4628 (36) |
| During treatment course | 1046 (46) | 5922 (56) | 6968 (54) |
| Centre-level characteristics | |||
| Centres, n | 54 | 65 | 65 |
| Transplant centres, n (%) | 19 (35) | 19 (29) | 19 (29) |
| Centre size, median (IQR) | |||
| Incident PD patients/year (n) | 30 (17–50) | 24 (13–38) | 25 (14–40) |
| Prevalent PD patients/year (n) | 85 (50–164) | 79 (41–135) | 79 (43–143) |
| Proportion of patients on PD (%) | 24 (17–32) | 25 (18–33) | 24 (18–33) |
aData not collected in New Zealand.
Temporal and geographical trends of PD solution use
The number of patients receiving N-pH/L-GDP solutions increased gradually from 42 (11%) in 2005 and peaked at 319 (33%) in 2017 (Supplemental Fig. 1). The 12 814 incident patients received PD in 65 centres. All centres provided conventional solutions during the study period. Eleven centres did not provide N-pH/L-GDP solutions to any patients and 42 centres provided N-pH/L-GDP solutions to <10% of their patients. There was significant geographical variability in the use of N-pH/L-GDP solutions, with 100% conversion from conventional solutions to N-pH/L-GDP solutions in Western Australia (Supplemental Figs. 2 and 3).
All-cause mortality
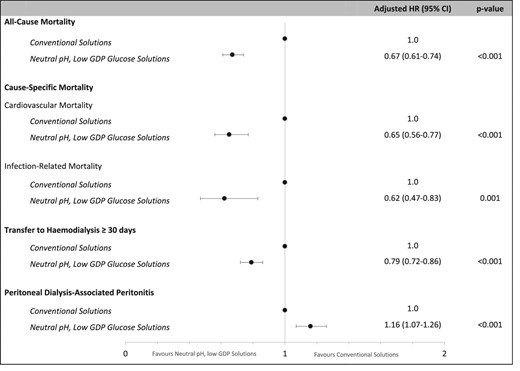
During the study period, 5330 (42%) patients died, with an all-cause mortality rate of 128/1000 person-years (95% CI 125–131) (Table 2). A lower proportion of kidney transplantation was observed in patients who received conventional solutions (27%) compared with N-pH/L-GDP solutions (29%) (P = .01). After adjusting for patient- and centre-level covariates, the use of N-pH/L-GDP solutions was associated with a lower risk of all-cause mortality [adjusted hazard ratio (aHR) 0.67 (95% CI 0.61–0.74)] compared with conventional solutions (Fig. 2). The E-value was 1.96 for the estimated aHR and 1.77 for the lower confidence limit. Table 3 shows estimates of univariate analysis and stepwise Cox regression models. For competing risk analysis of all-cause mortality, the adjusted SHR for N-pH/L-GDP solutions was 0.82 (95% CI 0.75–0.89) compared with conventional solutions (Supplemental Fig. 4a).
Associations between the type of PD solution and PD clinical outcomes (model 4).
Clinical outcomes of adult incident PD patients in Australia and New Zealand between 2005 and 2020.
| Outcomes | N-pH/L-GDP solutions (n = 2282) | Standard glucose solutions only (n = 10 532) | All (N = 12 814) | |||
|---|---|---|---|---|---|---|
| n (%) | Incidence rate/1000 person-years (95% CI) | n (%) | Incidence rate/1000 person-years (95% CI) | n (%) | Incidence rate/1000 person- years (95% CI) | |
| All-cause mortality | 707 (31) | 96 (90–103) | 4623 (44) | 135 (131–139) | 5530 (42) | 128 (125–131) |
| Cause-specific mortality | ||||||
| Cardiovascular mortalitya | 190 (8) | 26 (22–30) | 1398 (13) | 41 (39–43) | 1588 (12) | 38 (36–40) |
| Infection-related mortalityb | 65 (3) | 9 (7–11) | 446 (4) | 13 (12–14) | 511 (4) | 12 (11–13) |
| Transfer to HD for 30 days | 902 (40) | 181 (169–193) | 4075 (39) | 188 (182–194) | 4977 (39) | 186 (181–191) |
| n (%) | Peritonitis rate, episode/person-years (95% CI) | n (%) | Peritonitis rate episode/person-years (95% CI) | n (%) | Peritonitis rate episode/person- years (95% CI) | |
| PD peritonitis | 1061 (47) | 0.68 (0.67–0.70) | 4439 (42) | 0.48 (CI 0.47–0.49) | 5500 (43) | 0.52 (0.51–0.52) |
Cardiovascular mortality consisted of myocardial ischaemia, cardiac arrest, cardiac failure, pulmonary oedema, haemorrhagic pericarditis, cerebrovascular accident and pulmonary embolus.
Infection-related mortality consisted of bacterial, viral, fungal and protozoa infections.
Associations between N-pH/L-GDP solutions and PD clinical outcomes.
| Model | Variables | All-cause mortality, HR (95% CI) | Cardiovascular mortality, HR (95% CI) | Infection-related mortality, HR (95% CI) | Transfer to HD for ≥30 days, HR (95% CI) | PD peritonitis, HR (95% CI) |
|---|---|---|---|---|---|---|
| Univariate | Neutral pH, low GDP solutions | 0.72 (0.67–0.78) | 0.65 (0.56–0.75) | 0.68 (0.53–0.89) | 0.96 (0.89–1.03) | 1.13 (1.05–1.21) |
| Multivariate model 1 | Univariate + age, gender, ethnicity | 0.76 (0.70–0.82) | 0.67 (0.58–0.78) | 0.73 (0.56–0.95) | 0.95 (0.89–1.02) | 1.14 (1.07–1.22) |
| Multivariate model 2 | Model 1 + late nephrology referral, era, BMI, primary kidney disease, comorbid medical conditions, PD modality | 0.74 (0.68–0.81) | 0.67 (0.57–0.78) | 0.74 (0.56–0.97) | 0.94 (0.87–1.02) | 1.23 (1.15–1.32) |
| Multivariate model 3 | Model 2 + time varying covariates (PD peritonitis, transfer to HD for >180 days) | 0.71 (0.66–0.77) | 0.65 (0.56–0.76) | 0.66 (0.50–0.87) | 0.77 (0.71–0.85)a | |
| Multivariate model 4 | Model 3 + centre characteristics (centre size, transplant centre) | 0.67 (0.61–0.74) | 0.65 (0.56–0.77) | 0.62 (0.47–0.83) | 0.79 (0.72–0.86) | 1.16 (1.07–1.26)b |
| Multivariate model 5 | Model 4 + socio-economic status + residual kidney function | 0.79 (0.72–0.86) | 0.72 (0.62–0.85) | 0.82 (0.61–1.09) | 0.93 (0.86–1.00) | 1.20 (1.09–1.32) |
Only PD peritonitis included as time-varying covariate.
Model 2 + centre characteristics.
Cause-specific mortality
The predominant causes of death were cardiovascular disease [n = 1588 (30%)] and dialysis withdrawal [n = 1599 (30%)], followed by infection [n = 511 (9.6%)] (Supplemental Fig. 5a). The cardiovascular mortality and infection-related mortality rates were 38/1000 patient-years (95% CI 36–40) and 12/1000 patient-years (95% CI 11–13), respectively (Table 2). Compared with conventional solutions, the use of N-pH/L-GDP solutions was associated with lower risks of cardiovascular mortality [aHR 0.65 (95% CI 0.56–0.77)] and infection-related mortality [aHR 0.62 (0.47–0.83)] (Fig. 2, Table 3). The E-values were 2.08 and 2.09 for the estimated aHRs and 1.74 and 1.51 for the lower confidence limits for cardiovascular mortality and infection-related mortality, respectively. For competing risk analyses, the adjusted SHRs for N-pH/L-GDP solution use were 0.81 (95% CI 0.67–0.95) for cardiovascular mortality and 0.85 (95% CI 0.61–1.13) for infection-related mortality compared with conventional solution (Supplemental Fig. 4b, c).
Transfer to HD
During the study period, 4977 (39%) patients were transferred to HD for 30 days. Infection was the most common cause of HD transfer [n = 1852 (37%)] followed by inadequate dialysis [n = 965 (19%)] and mechanical failure [n = 603 (12%)]. Causes of HD transfer are shown in Supplemental Fig. 5b. Compared with the use of conventional solutions, the use of N-pH/L-GDP solutions was associated with a lower risk of transfer to HD [aHR 0.79 (95% CI 0.72–0.86)] (Fig. 2, Table 3). The E-value was 1.63 for the estimated aHR and 1.46 for the lower confidence limit. For competing risk analysis of transfer to HD, no difference was observed between use of N-pH/L-GDP solution and conventional solutions [SHR 1.01 (95% CI 0.94–1.09)] (Supplemental Fig. 4d).
Peritonitis
During the first treatment course of PD, 5500 (43%) patients experienced at least one episode of PD peritonitis. The peritonitis rates were 0.52 (95% CI 0.51–0.52) episodes per patient-year overall: 0.48 (95% CI 0.47–0.49) in conventional solutions use and 0.68 (95% CI 0.67–0.70) in N-pH/L-GDP solutions use (Table 2). Compared with the use of conventional solutions, the use of N-pH/L-GDP solutions was associated with a higher hazard of PD peritonitis [aHR 1.16 (95% CI 1.07–1.26)] (Fig. 2, Table 3). The E-value was 1.46 for the estimated aHR and 1.28 for the lower confidence limit. For competing risk analysis of PD peritonitis, the adjusted SHR for N-pH/L-GDP solution use was 1.33 (95% CI 1.25–1.43) compared with conventional solutions (Supplemental Fig. 4e).
Interactions between type of PD solutions and PD modality for PD clinical outcomes
Of the 12 814 incident PD patients, 9522 (74%) were initiated on CAPD and 3292 (26%) on APD. There were no interactive effects observed between the type of PD solutions and PD modality for all-cause mortality (Pinteraction = .53), cardiovascular mortality (Pinteraction = .97), infection-related mortality (Pinteraction = .26), transfer to HD (Pinteraction = .18) and time to the first PD peritonitis (Pinteraction = .12).
Sensitivity analysis
Between 2016 and 2020, a total of 4871 patients were initiated on PD in Australia and New Zealand. Of these, 3715 (76%) received conventional solutions only and 1156 (24%) received N-pH/L-GDP solutions. Compared with the use of conventional solutions, the aHRs for the use of N-pH/L-GDP solutions were 0.78 (95% CI 0.64–0.95) for all-cause mortality, 0.65 (95% CI 0.46–0.93) for cardiovascular mortality, 0.51 (95% CI 0.27–0.96) for infection-related mortality, 1.01 (95% CI 0.88–1.17) for transfer to HD and 1.37 (95% CI 1.18–1.59) for PD peritonitis (Fig. 3).

Sensitivity analysis for the associations between the type of PD solution and PD clinical outcomes, restricted to 2016–2020 (model 4).
DISCUSSION
In this longitudinal observational study of incident PD patients in Australia and New Zealand between 2005 and 2020, the proportion of patients on N-pH/L-GDP solutions tripled during the study period. Compared with patients who received conventional solutions only, patients who received N-pH/L-GDP solutions had reduced mortality risks despite an increased risk of PD peritonitis. These findings suggest that N-pH/L-GDP solutions were associated with survival benefits through mechanisms unrelated to PD peritonitis.
To date, systematic reviews have shown low-certainty evidence in relation to the use of N-pH/L-GDP solutions and clinical outcomes, except for the preservation of residual kidney function [10, 11]. One of the key reasons for this is the imprecision of estimated effects from randomised controlled trials (RCTs) with relatively small sample sizes and short follow-up times. Due to intrinsic barriers in conducting high-quality RCTs with adequate power for patients on PD, large observational studies have been proposed as an alternative strategy for generating evidence [1, 22]. Our study is the largest observational study of N-pH/L-GDP solution use to date, showing statistically significant estimates for all-cause mortality, cause-specific mortality and PD peritonitis.
In our study, N-pH/L-GDP solution use was associated with a >30% lower risk of all-cause mortality. A Korean study of 1909 incident PD patients also showed that N-pH/L-GDP solution use was associated with reduced mortality risk [risk reduction (RR) 0.61 (95% CI 0.50–0.74)] compared with the use of conventional solutions [23]. In that study, the age difference was >2 years, which might have accounted for half of the risk reduction favouring N-pH/L-GDP solution [24]. Our study also had a 1.7-year age difference between the study cohorts. However, every additional year in age was associated with 4% increase (upper limit of the 95% CI) in all-cause mortality. Both studies suggested a >20% reduction in mortality risk after accounting for the age difference.
Besides decreased all-cause mortality, N-pH/L-GDP solution use was associated with decreased risks of cardiovascular and infection-related mortality in our study. Due to the nature of observational studies, we were unable to determine the causes and mechanisms of the mortality benefits. Theoretical pathways may include the preservation of residual kidney function, downregulation of chronic inflammation and diminished vascular effects. N-pH/L-GDP solutions are associated with the preservation of residual kidney function, which could reduce the risk of left ventricular hypertrophy and improve blood pressure control, electrolyte balance and fluid status [10, 11, 13, 25]. Compared with N-pH/L-GDP solutions, conventional solutions are associated with increased pro-inflammatory cytokines in patients receiving PD [26, 27]. Chronic inflammation is a well-known risk factor for atherothrombosis and cardiovascular disease, as well as impaired immunity resulting in increased susceptibility to infection [28, 29]. The higher levels of systemic circulating GDPs and advanced glycation end-products in patients receiving conventional solutions may result in increased cardiovascular mortality, similar to patients with diabetes mellitus [30]. Future studies of the effects of GDPs in patients receiving PD will provide a better understanding of the causality of the survival benefits observed in our study.
Although the primary analysis in our study showed N-pH/L-GDP solution use was associated with a reduced risk of transfer to HD, such was not observed in the sensitivity analysis or competing risk analysis. The positive finding may have been a result of lead time bias, as more patients received N-pH/L-GDP solutions in recent years and were censored before transfer to HD could occur. RCTs comparing N-pH/L-GDP and conventional solutions also showed no difference in transfer to HD, but underpowered studies with type II error might be a contributing factor [14, 31]. With the inconsistent findings, it remains unclear whether N-pH/L-GDP solution use is associated with transfer to HD.
Our study showed that N-pH/L-GDP solution use was associated with an increased risk of PD peritonitis, consistent with the findings of a previous ANZDATA study [32]. The international TRIO trial also showed increased peritonitis rates in patients receiving N-pH/L-GDP solutions compared with conventional solutions [33]. However, the balANZ trial showed contradicting findings with reduced PD peritonitis rates and longer time to first peritonitis episode in patients receiving N-pH/L-GDP solutions [14]. A Cochrane review suggested that, compared with conventional solutions, N-pH/L-GDP solution use was associated with a decreased risk of PD peritonitis in RCTs with low attrition bias risk (<20% dropout rate) [RR 0.65 (95% CI 0.47–0.90)], whereas RCTs with high attrition bias risk showed the opposite [RR 1.58 (95% CI 1.28–1.96)] [10]. A possible explanation may be selection bias. Dialysis is now offered to older and frailer patients who are more likely to experience PD peritonitis but less likely to participate or complete follow-ups in RCTs [16, 34]. Further assessment of N-pH/L-GDP solution use in elderly, frail patients may provide additional insights regarding the discrepancy in PD peritonitis risks.
There are several inherent limitations in our study. First, the type of N-pH/L-GDP solutions was not specified nor verified by ANZDATA and might be prescribed as Balance (Fresenius Medical Care), Physioneal (Baxter Healthcare) or both. Second, the type of solution used was reported at the end of the year. Patients on short-term N-pH/L-GDP solutions might not be captured and might be misclassified as conventional solutions. Third, we included patients on N-pH/L-GDP solutions at any time during their PD treatment, which might have resulted in immortal bias. Nonetheless, our sensitivity analysis restricted to 2016–2020 showed similar findings despite the fact that a majority of these patients were initiated on N-pH/L-GDP solutions rather than transferred from conventional solutions. Fourth, ANZDATA did not collect information on centre-level adoption or reasons for prescribing N-pH/L-GDP solutions. In Australia and New Zealand, the cost of N-pH/L-GDP solutions varied based on local contracts with the supply companies and were identical to conventional solutions in Western Australia and Queensland. Fifth, there are unmeasured confounders that may be dissimilar between the patient groups. Information on frailty scores, availability of assisted PD and dialysis caregivers and PD therapy adherence were not collected by the ANZDATA Registry. Centre-level differences including PD peritonitis prevention strategies, the decision for transfer to HD and dialysis initiation in elderly patients were also not reported. It is plausible that these unmeasured confounders could explain the E-values for the associations with both N-pH/L-GDP solutions and clinical outcomes examined in our study. Finally, the observational nature of the study meant that causal inferences could not be drawn.
In conclusion, the use of N-pH/L-GDP PD solutions was associated with reduced all-cause mortality, attributed to a reduction of both cardiovascular and infection-related mortality, which was independent of an increased risk of PD peritonitis. Our findings provide additional evidence on the clinical outcomes of N-pH/L-GDP solutions that is not currently available from well-designed, high-quality RCTs. As N-pH/L-GDP solutions are well-developed and accessible in clinical settings, research addressing the clinical effects of N-pH/L-GDP solutions is essential to provide guidance for high-quality, goal-directed PD prescription.
ACKNOWLEDGEMENTS
The authors thank the entire Australian and New Zealand nephrology community (physicians, surgeons, nurses, database managers, operators and patients), which provides information to and maintains the ANZDATA Registry database, for their substantial contributions. The data reported here have been supplied by the ANZDATA Registry. The interpretation and reporting of these data are the responsibility of the authors and should not be seen as an official policy or interpretation of the ANZDATA1 Registry.
FUNDING
None.
AUTHORS’ CONTRIBUTIONS
All authors have contributed to this manuscript and approve of this submission. JC and CD participated in the design and analysis of this study. All authors participated in the interpretation of data and drafting/revising the paper.
DATA AVAILABILITY STATEMENT
The data underlying this article were provided by the ANZDATA Registry by permission. Data will be shared upon request to the corresponding author with permission from ANZDATA Registry.
CONFLICT OF INTEREST STATEMENT
J.H.C. received speaker's honoraria from Baxter Healthcare outside the submitted work. D.W.J. received consultancy fees, speaker's honoraria and research grants from Baxter Healthcare and Fresenius Medical Care, travel sponsorship from Amgen, consultancy fees from AstraZeneca and AWAK, research grants from National Health and Medical Research Council of Australia, speaker's honoraria from Ono and consultancy fees from Bayer outside the submitted work and is the current recipient of an Australian National Health and Medical Research Council (NHMRC) Leadership Level 3 Investigator Grant. Y.C. received speaker's honoraria and research grants from Baxter Healthcare and Fresenius Medical Care, research grants from National Health and Medical Research Council of Australia and is the current recipient of an Australian National Health and Medical Research Council Emerging Leadership Level 2 Investigator Grant and Advancing Queensland Health Fellowship. K.S. received speaker's honoraria from Baxter Healthcare and is on the medical advisory board of Fresenius Medical Care for Australia and New Zealand N.B. received consultancy fees from AstraZeneca and Baxter Healthcare and travel grants from Roche Pharmaceuticals and Amgen outside the submitted work.


Comments