


ABSTRACT
Microvascular structural alteration and dysfunction is a hallmark of arterial hypertension. So far, the visualization and the quantification of renal microcirculation in humans has been hampered by the lack of non-nephrotoxic and non-invasive radiologic techniques. Contrast-enhanced ultrasonography (CEUS) is an appealing method to investigate renal microcirculation and has not been investigated in this setting. We aimed to compare renal microcirculation in normotensive (NT) and hypertensive (HT) participants using CEUS at rest and during a sympathetic stress test.
We measured the renal perfusion index (PI, primary outcome), the renal resistive index (RRI), beat-to-beat systemic hemodynamics and plasma catecholamines before and during a 2-min cold pressor test (CPT) in NT and HT participants. Linear mixed model analysis was used to compare the effect of the CPT on the variables of interest.
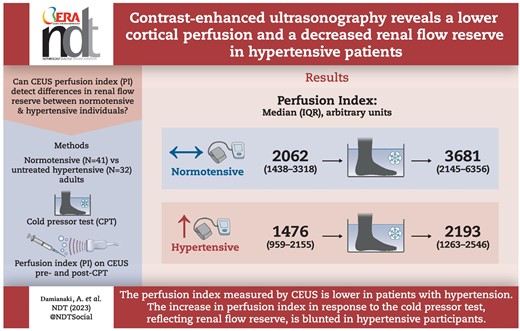
Seventy-three participants (32 HT) with normal kidney function were included. HT participants had a lower baseline PI compared with NT participants [median (interquartile range) 1476 (959–2155) arbitrary units (a.u.) vs 2062 (1438–3318) a.u., P < .001]. The CPT increased blood pressure, heart rate and catecholamines in all participants. The increase in PI observed in NT during the CPT was blunted in HT [+504 (117–920) a.u. vs +1159 (678–2352) a.u in NT, interaction P = .013]. Age, sex and body mass index did not modify these results.
HT patients had a lower basal renal cortical perfusion. During the cold pressor test, HT participants had a smaller increase in the PI, suggesting that renal cortical flow reserve is impaired.
What was known:
In the kidney, functional changes of small resistance arteries such as a predominant constrictive tone and structural changes like capillary rarefaction are commonly found in arterial hypertension.
Renal sympathetic nerve activity is commonly increased in hypertensive states and may contribute to renal function decline.
Imaging of the renal microvasculature in humans is challenging as non-nephrotoxic and non-invasive techniques are lacking. Contrast enhanced ultrasonography can detect changes in renal microcirculation during physical or pharmacological stress in normotensive individuals but has not been studied thoroughly in hypertensive patients.
This study adds:
Contrast-enhanced ultrasonography (CEUS) and Doppler ultrasound reveal differences in renal macro- and microcirculation between healthy normotensives and hypertensives, both at rest and during a physical stress test.
Hypertensive patients have lower cortical renal perfusion than normotensive participants.
The renal vasodilatory response to a CPT seen in normotensives is less pronounced in hypertensive patients, suggesting impaired cortical flow reserve.
Potential impact:
Doppler ultrasound and CEUS are bedside non-invasive kidney imaging techniques that coupled with a physical stress reveal pathophysiological differences between normotensive and hypertensive patients. Thus, both Doppler ultrasound and CEUS may be used to test whether physiological states or responses can be restored using antihypertensive drugs and interventions.
Quantifying changes in renal microcirculation is valuable as it may be possible to detect vascular damage of the kidneys before classical biomarkers such as creatinine and albuminuria start to rise.
INTRODUCTION
Microcirculation is essential for nutrients and oxygen supply to organs. It is responsible for most of the local and the overall peripheral resistance. Thus, microcirculation has been considered as a potential mechanistic link between arterial hypertension (AH) and target organ damage [1]. In addition, abnormalities of the microvascular structure and function in combination with the sympathetic nervous system (SNS) activity play a central role in several forms of AH [2].
Recent advances in renal imaging, such as contrast-enhanced ultrasound (CEUS), allow the detection and the quantification of changes in renal cortical perfusion by measuring the perfusion index (PI). Changes in renal cortical perfusion have been detected by CEUS in studies using pharmacological and dietary interventions. These studies have included healthy participants and patients with chronic kidney disease (CKD) but not hypertensive (HT) participants [3–10]. Therefore, we hypothesized that renal micro- and macrocirculation responses to a cold pressor test (CPT) would be modified in HT compared with normotensive (NT) participants.
MATERIALS AND METHODS
Study population
Adult healthy participants and HT patients were recruited in the outpatient clinic of the Service of Nephrology and Hypertension of the Lausanne University Hospital. For the healthy NT participants, inclusion criteria were office blood pressure (BP) <135/85 mmHg and no concomitant medications. For the HT patients, inclusion criteria were 24-h ambulatory BP ≥130/80 mmHg or treated AH. Subjects with prior allergy to ultrasound contrast agent, ongoing pregnancy, acute or chronic disease other than AH affecting renal function, lower limb sensitive neuropathy, taking drugs affecting renal hemodynamics or antihypertensive treatment other than calcium channel blockers during the wash-out period, or with office BP >180/100 mmHg during the wash-out period were excluded.
Methods
This study was part of a single-center prospective, controlled (HT vs NT) study evaluating the effect of a CPT on brain and renal function (NCT03473275). In the present study, the PI measured by CEUS was the primary outcome. The study was approved by the local ethics committee “Commission cantonale d’éthique de la recherche sur l’être humain” and conducted according to the Declaration of Helsinki and local regulatory requirements. All subjects provided written informed consent prior to inclusion.
Study visits
All participants underwent a screening visit. In the HT group, antihypertensive treatment was standardized before the study visit as follows: no antihypertensive drugs for moderately hypertensive patients (BP <160/100 mmHg) and amlodipine 5–10 mg only for patients with more severe hypertension. All other drugs were withheld 10 days before study days.
Smoking, alcohol intake in the last 48 h, strenuous physical activity 24 h before the study day and consumption of caffeine-containing products, energy drinks, from 6 p.m. the day before the study were prohibited. On the study day, fasting participants arrived at the investigation center between 8 and 10 a.m. A venous catheter was inserted in one arm to allow blood sampling and intravenous administration of the contrast agent (Sonovue®, Bracco International B.V., Milan, Italy).
Systemic hemodynamic variables and determination of hormonal levels
The pulsatile hemodynamics were recorded using the Mobil-O-Graph (IEM, Stolberg, Germany) in supine position after 15 min of rest [11, 12]. Ambulatory brachial BP, indices of wave reflection [Aix; augmentation index defined as the ratio of augmentation pressure to aortic pulse pressure (PP) and Aix75 as heart rate (HR)-adjusted augmentation index] and pulse wave velocity (PWV) were estimated with this device. At least five consecutive measurements, separated by 2-min intervals, were taken in each participant.
BP and HR were measured continuously using the Finapres® NOVA (Finapres Medical Systems, Enschede, The Netherlands). After 5 min of signal stabilization, the finger BP was calibrated with a brachial oscillometric BP measurement. This calibration was repeated at least 2 min before each CPT.
The baseline systemic hemodynamic variables [systolic BP (SBP), diastolic BP (DBP), mean MP (MBP) and HR] were calculated as the average of 2 min continuous recording before the CPT. During the CPT, the systemic hemodynamic variables were calculated as the mean of continuous recordings (up to 2 min). Maximal CPT (CPTmax) systemic hemodynamic variables were calculated as the mean of the last 30 s of the CPT. Recovery systemic hemodynamic variables were calculated as the mean of the last 60 s of the 2-min recovery period after the CPT.
Blood samples were taken before the CPT, at 30 s and 2 min of the CPT, and 2 min after the end of the CPT. Norepinephrine (NE), epinephrine (E) and neuropeptide Y (NPY) 1–36 and its metabolites, were determined using a liquid chromatography tandem mass spectrometry method as reported previously [13, 14]. Plasma renin activity (PRA) and plasma aldosterone concentration (PAC) were determined by a radioimmunoassay kit for the quantitative determination of Angiotensin I in human plasma (REN-CT2, Cisbio Bioassays, Codolet, France) and by a commercial RIA kit (Aldo-Riact, CIS Bio International, Yvette, Cedex, Saclay, France) respectively.
The cold pressor test
A modified CPT was applied as previously described [7]. Both feet were placed in a footbath filled with water at body temperature (35–37°C, sham) for baseline measurements. The water was replaced by ice-cold water (2–4°C) for 2 min during which ultrasound measurements were repeated. Thereafter, the ice-cold water was substituted by water at body temperature (recovery phase). This procedure was repeated three times [(i) blood sampling, (ii) Doppler ultrasound for RRI determination and (iii) CEUS for PI determination] with at least 10 min between the three phases (Supplementary data, Fig. S1).
Renal ultrasound measurements
Renal ultrasound was performed on a Samsung RS80A device using a dedicated abdominal probe (3–5 MHz) as described previously [7]. The RRI was measured in a segmental artery with the easiest accessibility and highest quality of waveforms, and in expiratory breath-hold. The right kidney was chosen to determine the RRI in all participants except two, in whom the left kidney was used for anatomical/technical reasons. At least four measurements of RRI were obtained at baseline and during the CPT with special care to select the same segmental artery at each measurement. RRI was calculated as [peak systolic velocity (PSV) – end diastolic velocity (EDV)]/PSV in the color Doppler mode.
After 10-min of recovery phase, we performed a CEUS at low mechanical index (MI = 0.08). The same kidney was chosen for image acquisition in a sagittal plane, and the probe was oriented so that renal length was highest, to guarantee the largest cortical surface area. Sonovue® was injected as a continuous infusion with a special rotating pump (Vueject®, Bracco SA, Milan, Italy) at a continuous rate of 0.015 mL/kg/min (∼1 mL/min for a 70 kg person). Image depth, focus, gain and frame rate were optimized and held constant during the experiment. Once saturation was reached after 1–2 min, the destruction–replenishment (DR) technique was used to quantify intra-renal perfusion, as described previously [10, 15]. A minimum of four consecutive DR sequences were performed during each condition in breath-hold to avoid movement artifacts. Special attention was paid to obtain zero luminance (no visible microbubbles) after each flash.
Image analysis
Images were exported in Digital Imaging and Communication in Medicine (DICOM) format and analyzed with the dedicated software Vuebox® (Bracco Research, Geneva, Switzerland) using the replenishment model. Regions of interest (ROI) were drawn manually and included the largest part of the renal cortex, as published previously [10, 16]. Compensation of movement (minor breathing artifacts or small movements of the probe) was applied to all sequences before analysis. The DICOM data in each ROI were converted into echo-power data that are directly proportional to the concentration of the contrast agent. For each ROI, the rate at which microbubbles replenish renal tissue after destruction by pulses at high MI is proportional to the local blood flow and is expressed as time-intensity curve (TIC). The mean transit time (mTT) is the time needed, after microbubble destruction, to reach 50% of the maximal intensity signal (point at maximum slope or wash-in rate). The ratio of relative blood volume (rBV) to mTT allows the calculation of the PI (PI = rBV/mTT), which was the primary outcome of the study [6]. Only sequences with a quality of fit of >85% between the echo-power signal and the TIC in a specific ROI were used.
Statistics
Data are expressed as means ± standard deviation (SD) or median (interquartile range) if non-normally distributed. A paired Student's t-test or a Wilcoxon signed rank test was used to test for differences between demographic variables depending on the normality of the data. To compare the effect of the CPT on renal hemodynamics outcomes between NT and HT participants, we used a linear mixed model analysis. Non-normally distributed outcomes were first transformed to be normally distributed. Tested covariates included group (NT vs HT), exposure (baseline vs CPT) and their interaction (group * exposure). The following confounding factors were also tested: age, sex and body mass index (BMI). Correlations between changes in renal and systemic hemodynamics during CPT were assessed by Spearman test, followed by linear regression to account for possible effects of sex, age and BMI. A P-value of <.05 was considered statistically significant. Statistical analysis was performed with Stata 16 (StataCorp, College Station, TX, USA).
RESULTS
Participants
Thirty-two HT patients and 41 NT participants were included. Blood samples were missing for three participants due to venous catheter placement failure or dysfunction. Three NT and two HT participants had no blood sampling at 30 s and/or 2 min of CPT due to a possible vasoconstriction in response to CPT.
Baseline characteristics of the participants are presented in Table 1. HT participants were older, had a higher BMI, a higher systolic and diastolic BP, and a higher PWV.
Demographic characteristics of the participants.
| NT, n = 41 | HT, n = 32 | P | |
|---|---|---|---|
| Sex male (%) | 20 (48.8) | 21 (65.6) | .15 |
| Age (years) | 33.5 ± 10.5 | 46.3 ± 12.9 | <.001 |
| BMI (kg/m2) | 22.9 ± 2.4 | 26.3 ± 3.9 | <.001 |
| Current smoking (%) | 5 (12.2) | 3 (9.4) | .72 |
| eGFR (mL/min/1.73 m2) | 101 ± 15 | 94 ± 19 | .13 |
| Supine SBP (mmHg) | 116 ± 9 | 130 ± 16 | <.001 |
| Supine DBP (mmHg) | 71 ± 9 | 84 ± 11 | <.001 |
| Supine PWV (m/s) | 5.4 (5.1–6.0) | 7.5 (6.4–8.6) | <.001 |
| Supine Aix75 (%) | 10.8 (6.3–21.6) | 17.7 (9.2–25.9) | .16 |
Data are presented as mean ± SD, percentage (%) or median (interquartile range).
eGFR, estimated glomerular filtration rate by Chronic Kidney Disease Epidemiology Collaboration.
Continuous systemic hemodynamics
During the study day, SBP, DBP and MBP were significantly higher in the HT group compared with the NT group, whereas HR was similar between groups (Table 2, Supplementary data, Fig. S2). In both groups, the CPT increased SBP, DBP, MBP and HR. During the recovery period all the hemodynamic variables returned to baseline values. Multivariate analyses of BP and HR indicated no significant interaction between groups and exposure to the CPT. BP responses in both groups were independent of age, sex and BMI. HR responses in both groups were independent of age and BMI. In both groups women had a higher HR than men, but a similar magnitude of response to the CPT.
Changes in systemic hemodynamics during the CPT—analyses are performed with the maximal CPT (last 30 s of CPT).
| Univariate analysis | Adjusted analysis | |||||||
|---|---|---|---|---|---|---|---|---|
| Baseline | CPT | CPTmax | Recovery | Group β (P-value) | Exposure β (P-value) | β (P-value) | Group × exposure β (P-value) | |
| SBP (mmHg) | ||||||||
| NT | 121 ± 9 | 136 ± 14 | 146 ± 18 | 127 ± 14 | 29.91 (P < .001) | 26.99 (P < .001) | Group: 27.08 (P < .001) | BL vs CPTmax: No interaction |
| HT | 148 ± 15 | 167 ± 24 | 178 ± 28 | 155 ± 16 | BL vs CPTmax: 24.38 (P < .001) | 5.64 (P = .228) | ||
| DBP (mmHg) | ||||||||
| NT | 70 ± 9 | 84 ± 13 | 92 ± 16 | 77 ± 10 | 20.68 (P < .001) | 21.54 (P < .001) | Group: 20.76 (P < .001) | BL vs CPTmax: No interaction |
| HT | 91 ± 11 | 106 ± 18 | 113 ± 19 | 96 ± 12 | BL vs CPTmax: 21.62 (P < .001) | –0.174 (P = .964) | ||
| MBP (mmHg) | ||||||||
| NT | 89 ± 10 | 105 ± 14 | 114 ± 17 | 97 ± 11 | 25.30 (P < .001) | 25.31 (P < .001) | Group: 24.74 (P < .001) | BL vs CPTmax: No interaction |
| HT | 114 ± 12 | 132 ± 21 | 140 ± 23 | 120 ± 13 | BL vs CPTmax: 24.80 (P < .001) | 1.11 (P = .801) | ||
| HR (b.p.m.) | ||||||||
| NT | 63 ± 10 | 76 ± 14 | 74 ± 14 | 63 ± 10 | –2.88 (P = .207) | 9.17 (P < .001) | Group: –1.47 (P = .575) | BL vs CPTmax: No interaction |
| HT | 62 ± 7 | 70 ± 12 | 69 ± 12 | 61 ± 7 | BL vs CPTmax: 10.47 (P < .001) | –2.79 (P = .296) | ||
Data are presented as mean ± SD.
CPTmax: maximal CPT; BL, baseline.
Renal hemodynamics assessed by Doppler ultrasound and CEUS
There was no difference in RRI between the two groups. However, PSV and EDV were significantly lower in the HT patients compared with the NT participants.
The CPT decreased RRI, driven mostly by the decrease in PSV, whereas EDV did not change significantly (Table 3). In multivariate analysis, a significant interaction was observed between exposure and group, with less decrease in RRI during the CPT in the HT group (Fig. 1a). Univariate and adjusted analysis showed that PSV was lower during the CPT compared with baseline. There was a significant interaction between exposure and group, with less decrease in PSV during CPT in HT group. In univariate and adjusted analysis, EDV was lower in the HT group compared with the NT group. There was no effect of the CPT on EDV and no interaction between exposure and group. In univariate analysis, we found that RRI and PSV were higher in women compared with men, but there was no interaction between sex and response to the CPT and between sex and group. No effects of age, BMI or sex on RRI, PSV and EDV were observed in multivariate analysis for exposure and group.
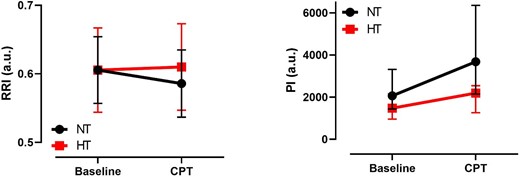
RRI and PI per group during baseline and CPT. a.u.: arbitrary units.
Changes in renal ultrasound parameters during the experiment.
| Univariate analysis | Adjusted analysis | |||||
|---|---|---|---|---|---|---|
| Baseline | CPT | Group β (P-value) | Exposure β (P-value) | β (P-value) | Group × exposure β (P-value) | |
| RRI (a.u.) | ||||||
| NT | 0.61 ± 0.05 | 0.59 ± 0.05 | 0.01 (P = .329) | –0.009 (P = .012) | Group: 0.0000 (P = .997) | 0.0241 (P < .001) |
| HT | 0.61 ± 0.06 | 0.61 ± 0.06 | Exposure: –0.0195 (P < .001) | |||
| PSV (cm/s) | ||||||
| NT | 39.0 ± 13.1 | 36.3 ± 13.5 | –4.76 (P = .087) | –1.243 (P = .046) | Group: –6.516 (P = .022) | 3.509 (P = .003) |
| HT | 32.5 ± 11.2 | 33.3 ± 10.3 | Exposure: –2.782 (P < .001) | |||
| EDV (cm/s) | ||||||
| NT | 15.3 ± 5.1 | 14.9 ± 5.4 | –2.48 (P = .016) | –0.135 (P = .594) | Group: –2.764 (P = .009) | No interaction |
| HT | 12.5 ± 3.6 | 12.7 ± 3.4 | Exposure: –0.383 (P = .253) | 0.567 (P = .264) | ||
| PI (a.u.) | ||||||
| NT | 2062 (1438–3318) | 3681 (2145–6356) | –14.38 (P < .001) | 11.25 (P < .001) | Group: –11.03 (P = .011) | –6.695 (P = .013) |
| HT | 1476 (959–2155) | 2193 (1263–2546) | Exposure: 14.22 (P < .001) | |||
| rBV (a.u.) | ||||||
| NT | 4149 (2553–7096) | 6417 (4477–9294) | –11.89 (P = .011) | 12.73 (P < .001) | Group: –10.96 (P = .028) | No interaction |
| HT | 3438 (2298–4408) | 4576 (2876–6735) | Exposure: 13.55 (P < .001) | –1.86 (P = 0.571) | ||
| mTT (s) | ||||||
| NT | 1.95 (1.45–2.70) | 1.74 (1.44–2.23) | 0.227 (P = .004) | –0.79 (P = .032) | Group: 0.142 (P = .101) | 0.170 (P = .017) |
| HT | 2.12 (1.61–3.31) | 2.31 (1.88–3.05) | Exposure: –0.155 (P = .001) | |||
Data are presented as mean ± SD or median (interquartile range).
a.u., arbitrary units.
PI was lower in the HT group compared with the NT group (Table 3, Supplementary data, Fig. S3). The CPT increased the PI but multivariate analysis showed a significant interaction between exposure and group, with an attenuated response in PI during the CPT in HT patients (Fig. 1b). A sensitivity analysis with age-matched groups confirmed these findings (Supplementary data, Table S1). In univariate and adjusted analysis rBV was lower in the HT group compared with the NT group. It increased during CPT compared with baseline. No significant interaction was observed between exposure and group for rBV. In univariate analysis, mTT was higher in the HT group compared with the NT group. mTT decreased during CPT compared with baseline. A blunted decrease of mTT during CTP was observed in HT. A significant interaction between exposure and group was observed for mTT. In univariate analysis, PI and rBV were higher in women compared with men, but there was no interaction between sex and exposure nor between sex and group (Supplementary data, Table S2). No effects of age, BMI or sex on PI, rBV and mTT were observed on multivariate analysis for exposure and group.
Neuroendocrine and hormone responses
PRA and PAC were similar between groups (Table 4). The CPT had no effect on PRA or PAC.
Changes in PRA and PAC during the experiment.
| Univariate analysis | Adjusted analysis | |||||
|---|---|---|---|---|---|---|
| Baseline | After CPT | Group β (P-value) | Exposure β (P-value) | β (P-value) | Group × exposure β (P-value) | |
| PRA (ng/mL/h) | ||||||
| NT | 0.40 (0.17–0.80) | 0.58 (0.17–1.06) | –0.128 (P = .627) | 0.134 (P = .096) | Group: –0.088 (P = .750) | No interaction |
| HT | 0.27 (0.14–0.65) | 0.33 (0.15–0.94) | Exposure: 0.170 (P = .116) | –0.081 (P = .617) | ||
| PAC (pg/mL) | ||||||
| NT | 95.0 (66.3–151.0) | 83.0 (65.7–16.5) | –0.123 (P = .451) | –0.019 (P = .359) | Group: –0.130 (P = .431) | No interaction |
| HT | 80.4 (62.9–103.2) | 78.1 (60.5–115.0) | Exposure: –0.025 (P = .372) | 0.013 (P = .751) | ||
Data are presented as median (interquartile range).
NE concentrations were similar between groups (Table 5). NE concentrations already after 30 s of the CPT and remained increased after 2 min of CPT and during the recovery period. No difference in the magnitude of the response was observed. Moreover, an inverse correlation was found between NE at 2 min and PI but only for the HT group (Spearman's rho = –0.4032, P = .0221).
NE, E and NPY 1–36 concentrations during the experiment.
| Univariate analysis | Adjusted analysis | |||||||
|---|---|---|---|---|---|---|---|---|
| Baseline | CPT 30 s | CPT 2 min | After CPT | Group β (P-value) | Exposure β (P-value) | β (P-value) | Group × exposure β (P-value) | |
| NE (nmol/L) | ||||||||
| NT | 1.13 (0.8 –1.46) | 1.46 (0.97 –1.88) | 1.7 (1.12 –2.08) | 1.74 (1.21 –2.19) | 0.106 (P = .374) | BL vs CPT 30 s; 0.135 (P < .001) | Group: 0.141 (P = .257) | No interaction |
| HT | 1.36 (0.90 –1.18) | 1.36 (1.0 –2.07) | 1.75 (1.21 –2.72) | 1.85 (1.22 –2.63) | BL vs CPT 2 min: 0.352 (P < .001) | BL vs CPT 30 s: 0.181 (P < .001) | CPT 30 s: –0.105 (P = .069) | |
| BL vs after CPT 0.379 (P < .001) | BL vs CPT 2 min: 0.357 (P < .001) | CPT 2 min: –0.011 (P = .846) | ||||||
| BL vs after CPT: 0.396 (P < .001) | After CPT: –0.038 (P = .512) | |||||||
| E (nmol/L) | ||||||||
| NT | 0.11 (0.07 –0.18) | 0.13 (0.08 –0.19) | 0.15 (0.1 –0.22) | 0.13 (0.09 –0.19) | –0.405 (P = .005) | BL vs CPT 30 s: 0.144 (P = .070) | Group: –0.400 (P = .021) | No interaction |
| HT | 0.07 (0.04 –0.12) | 0.08 (0.05 –0.11) | 0.10 (0.07 –0.15) | 0.10 (0.06 –0.14) | BL vs CPT <2 min: 0.401 (P < .001) | BL vs CPT 30 s: 0.197 (P = .062) | CPT 30 s: –0.122 (P = .443) | |
| BL vs after CPT: 0.234 (P = .003) | BL vs CPT 2 min: 0.431 (P < .001) | CPT 2 min: –0.065 (P = .682) | ||||||
| BL vs after CPT: 0.164 (P = .123) | After CPT: 0.155 (P = .325) | |||||||
| NPY 1–36 (pM) | ||||||||
| NT | 0.13 (0.12 –0.18) | 0.13 (0.12 –0.2) | 0.18 (0.13 –0.25) | 0.19 (0.13 –0.26) | 0.287 (P < .001) | BL vs CPT 30 s: 0.044 (P = .424) | Group: 0.297 (P = .004) | No interaction |
| HT | 0.20 (0.15 –0.28) | 0.23 (0.17 –0.29) | 0.23 (0.17 –0.34) | 0.21 (0.14 –0.34) | BL vs CPT 2 min: 0.194 (P < .001) | BL vs CPT 30 s: 0.013 (P = .858) | CPT 30 s: 0.071 (P = .520) | |
| BL vs after CPT: 0.180 (P = .001) | BL vs CPT 2 min: 0.197 (P = .008) | CPT 2 min: –0.011 (P = .919) | ||||||
| BL vs after CPT: 0.226 (P = .002) | After CPT: –0.103 (P = .348) | |||||||
Data are presented as median (interquartile range).
BL, baseline.
E concentrations were lower in the HT group. The CPT increased E concentrations after 2 min only. No interaction was found between groups and the effect of the CPT.
NPY 1–36 concentrations were higher in HT participants. However, in age-matched group analysis, the difference was lost. The CPT increased NPY 1–36 concentrations at 2 min of the CPT and during recovery. The magnitude of the response was similar in both groups.
Correlation between systemic and renal hemodynamic changes induced by the CPT
The changes in RRI were negatively associated with changes in SBP, DBP, MBP and HR in the NT group but only with HR in the HT group (Supplementary data, Fig. S4). These correlations were independent of age, BMI and sex.
No correlations between changes in PI and changes in SBP, DBP, MBP or HR were observed in any group.
DISCUSSION
In this study, we found that HT patients have a lower baseline renal cortical PI than NT participants. When exposed to a CPT, HT patients increase their renal cortical PI to a lesser degree than NT participants. In addition, the decrease of the RRI observed in NT participants during the CPT is not seen in HT participants. These findings highlight that microcirculatory responses to a stress test are different in the hypertensive setting.
This is the first demonstration that CEUS-assessed renal cortical microperfusion is lower in HT patients compared with NT participants. The decreased PI is secondary to both a decreased rBV and an increase in mTT. An increased sympathetic tone at resting state might explain the lower baseline PI found in HT patients possibly secondary to vasoconstriction. Indeed, HT patients presented higher NPY 1–36 concentrations, known to potentiate the action of NE post-synaptically. Its co-transmitter, NE, was however similar in both groups, confirming findings in previous studies [17, 18]. Nevertheless, HT patients were older, and the age difference was found to contribute to the elevated NPY 1–36 concentrations. Progressive microvascular damage and loss occur during AH development as shown in spontaneously hypertensive rats and in normotensives with a familial predisposition to AH [19–21]. Hence, microvasculature remodeling at the kidney level may also contribute to the lower baseline PI found in HT patients. Capillary rarefaction has been associated with renal hemodynamics modification and dysfunction in experimental renovascular disease [22–26]. Additionally, arteriolar nephrosclerosis is closely related to the duration and severity of AH and to other systemic hemodynamic factors like age and PP which are considered important determinants of renal blood flow [27, 28]. In our study age, PP, PWV or Aix75 were not associated with PI.
Previous studies in healthy volunteers or CKD patients with varying kidney dysfunction reported a decreased CEUS-assessed cortical microperfusion [6–8, 10]. These findings suggest that HT patients may already present signs of microcirculatory dysfunction or damage. In line with our findings, Jia et al. reported lower cortical blood flow in essential HT than in healthy controls using dynamic 4D spiral scanning [29].
The increase in the PI seen in NT participants was less pronounced in HT patients. This capacity to increase flow upon stimulation may be interpreted as a functional marker of cortical flow reserve. CPT typically evokes alpha-adrenergic receptor–mediated vasoconstriction, but this phenomenon also depends on cold exposure duration and individual characteristics like age, atherosclerotic burden and residence's altitude [30–32]. Evidence for regional vasodilation of central vessels in healthy participants during CPT comes from studies examining coronary vascular responses [30, 33]. An intact endothelium seems to be crucial for this normal response, as in atherosclerotic coronary arteries the CPT induces vasoconstriction [34]. Local vasodilation has been described in carotid arteries in NT subjects but not in borderline HT or elderly subjects [35, 36]. At the kidney level, evidence supporting regional vasodilation in response to SNS stimulation by CPT is lacking. However, in an animal study noradrenaline perfusion in sheep with septic shock increased cortical perfusion measured with laser Doppler flow, pointing towards vasodilation of renal arterioles upon SNS stimulation [37].
Taken together, the lower baseline PI and the blunted increase in PI during CPT observed in HT might be secondary to a combination of a SNS overactivity, to some degree of endothelium dysfunction with imbalance of endothelium-derived relaxing and constrictor factors and impaired renal autoregulation under powerful sympathoexcitatory stressors. The inverse correlation of NE concentration at 2 min of the CPT with the change in PI suggests that the above factors may interact to weaken the vasodilator responses in the hypertensive setting. Finally, the increase in renal PI during CPT observed in both groups was not associated with the increases in BP or HR, in accordance with previous studies using a pharmacological stimulus [10, 15].
In NT participants, the decrease in RRI during the CPT combined with the increased PI suggests vasodilation rather than vasoconstriction. In contrast, HT patients presented a paradoxical response with no decrease in RRI during CPT. As RRI is the result of many intra-renal and extra-renal systemic determinants [38], complex interactions of all these factors and compensation mechanisms can concur to modulate RRI values in HT compared with NT participants. In our study, both groups had similar changes in HR and the increase in HR was inversely correlated with the change in RRI in both groups. Consequently, it seems less likely that HR responses during CPT explains the different RRI responses. Besides, the RRI—also influenced by the PP—was similar between the two groups at baseline and no correlation was found between the change in RRI and the change in PP for both groups. Finally, although the increased arterial stiffness might predispose the renal circulation to a higher renal vascular resistance during CPT in AH, we found no correlation between the change in RRI and the indices of arterial stiffness in both groups.
Limitations of our study include the increased age and proportion of men in the HT group. However, in regression analysis neither sex nor age influenced BP, RRI and PI responses during CPT. Secondly, the protocol was designed in a way that renal cortical perfusion was always measured after Doppler ultrasound, hence a habituation effect to the CPT could have affected CEUS responses. However, the magnitude of BP rise with each three stimulations was similar, which speaks against such an effect.
In conclusion, the lower baseline cortical PI, the paradoxical response in RRI and the attenuated increase in cortical PI seen in HT during CPT adds new evidence of impaired renal microcirculation in patients with hypertension. Coupling these bedside techniques with a physiological stress could provide new information for pathophysiological changes in AH. Given the mounting interest in the relevance of renal hemodynamics in the pathogenesis of AH, diabetes and CKD, an area of future investigation would be the evaluation of real-time changes of renal perfusion upon a stimulus or during drug challenges.
ACKNOWLEDGEMENTS
The authors warmly thank Marielle Dunand, Caroline Seghezzi and Abdulla Ahmed for their technical help and The Bryn Turner-Samuels Foundation (Lausanne, Switzerland) for the funding of J.M.’s doctoral thesis.
FUNDING
This study was supported by grant no SNF 320030_179 379 from the Swiss National Science Foundation and a grant from the Swiss Heart Foundation.
AUTHORS’ CONTRIBUTIONS
M.H.-B. and G.W. conceived and designed the study. M.H.-B., A.D., E.P., K.T., W.B., M.M., J.M. and P.E. contributed to data collection. A.D., M.H.-B., M.P. and G.W. analyzed and interpreted the results. A.D., M.H.-B. and G.W. drafted the manuscript. All authors provided critical feedback and approved the final version of the manuscript.
CONFLICT OF INTEREST STATEMENT
The authors have declared no conflicts of interest. The results presented in this article have not been published previously in whole except in abstract format.
DATA AVAILABILITY STATEMENT
The raw data supporting the conclusions of this article can be made available by the authors after data transfer agreement with the institution.
REFERENCES
Author notes
A.D. and M.H.-B. contributed equally.


Comments