


ABSTRACT
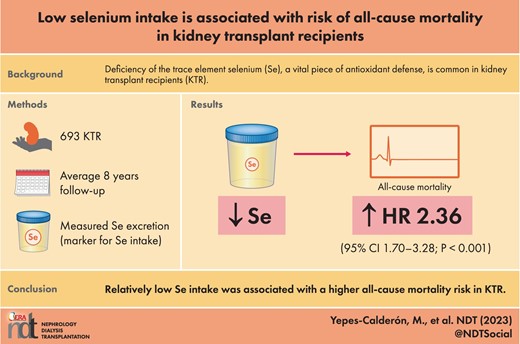
Deficiency of the essential trace element selenium is common in kidney transplant recipients (KTR), potentially hampering antioxidant and anti-inflammatory defence. Whether this impacts the long-term outcomes of KTR remains unknown. We investigated the association of urinary selenium excretion, a biomarker of selenium intake, with all-cause mortality; and its dietary determinants.
In this cohort study, outpatient KTR with a functioning graft for longer than 1 year were recruited (2008–11). Baseline 24-h urinary selenium excretion was measured by mass spectrometry. Diet was assessed by a 177-item food frequency questionnaire, and protein intake was calculated by the Maroni equation. Multivariable linear and Cox regression analyses were performed.
In 693 KTR (43% men, 52 ± 12 years), baseline urinary selenium excretion was 18.8 (interquartile range 15.1–23.4) μg/24-h. During a median follow-up of 8 years, 229 (33%) KTR died. KTR in the first tertile of urinary selenium excretion, compared with those in the third, had over a 2-fold risk of all-cause mortality [hazard ratio 2.36 (95% confidence interval 1.70–3.28); P < .001], independent of multiple potential confounders including time since transplantation and plasma albumin concentration. The most important dietary determinant of urinary selenium excretion was protein intake (Standardized β 0.49, P < .001).
Relatively low selenium intake is associated with a higher risk of all-cause mortality in KTR. Dietary protein intake is its most important determinant. Further research is required to evaluate the potential benefit of accounting for selenium intake in the care of KTR, particularly among those with low protein intake.
What is already known about this subject?
Selenium is a trace element required for antioxidant and anti-inflammatory defence.
Selenium deficiency is frequent in patients with end-stage kidney disease and is not corrected by kidney transplantation.
Selenium deficiency has been associated with a higher mortality risk in other populations. Whether this association is also present in kidney transplant recipients (KTR) remains unknown.
What this study adds?
Urinary selenium excretion, a biomarker of selenium intake, is lower in KTR than what has been previously reported for healthy individuals.
Relatively low urinary selenium excretion is independently associated with a higher risk of long-term all-cause mortality in KTR.
Protein intake is the most significant determinant of urinary selenium excretion in KTR.
What impact this may have on practice or policy?
Clinical practice can potentially benefit from considering selenium intake in the care of outpatient KTR to decrease the burden of premature mortality among this population, particularly among the most vulnerable KTR, such as those with low protein intake.
INTRODUCTION
Kidney transplantation leads to better patient outcomes than chronic dialysis [1]. Still, the survival of kidney transplant recipients (KTR) remains materially lower than that of age-matched controls in the general population [2]. Beyond traditional risk factors, chronic inflammation and oxidative stress likely contribute to the increased mortality risk in KTR; however, the underlying risk factors remain incompletely understood [3, 4].
Selenium is an essential trace element that participates in anti-inflammatory defence by regulating B-cell function, cell-mediated immunity, and the production of inflammatory mediators in the cyclo-oxygenase and lipoxygenase pathways [5, 6]. In addition, it is a crucial component of major antioxidant enzymes, including glutathione peroxidase and thioredoxin reductases, which inhibit lipid oxidation and protect against the propagation of free radical reactions [7, 8]. After intake, selenium is absorbed, and a proportion is transported to the liver for the synthesis of selenoproteins. The rest of the selenium daily intake, approximately 73% in men and 77% in women, is excreted through urine [9]. There is a strong correlation between dietary selenium intake and urinary excretion. Thus, selenium excretion is considered a good marker of selenium intake [9, 10].
Deficiency of essential trace elements, including selenium, is common in patients with decreased kidney function, including KTR [5, 11, 12]. Risk factors for selenium deficiency include low dietary intake, longer dialysis vintage and mycophenolate use [13, 14]. Selenium deficiency has been associated with adverse clinical outcomes in the general population, including Alzheimer’s development, cardiovascular disease, diabetes and malnutrition [8, 15–17]. Furthermore, data from patients on hemodialysis have linked selenium deficiency with an enhanced pro-inflammatory and pro-oxidative status [6], and notably with a higher risk of all-cause mortality [5, 18].
Whether low selenium intake is associated with poor outcomes in KTR remains unknown, yet worth investigating because it is potentially correctable [5, 6]. In the current study, we tested the hypothesis that lower urinary selenium excretion, as a biomarker of selenium intake, is associated with an increased long-term risk of all-cause mortality in outpatient KTR. Next, we explored the dietary determinants of urinary selenium excretion in this population.
MATERIALS AND METHODS
Study design
In this cohort study, all adult KTR with a functioning graft for at least 1 year, without a history of addiction or malignancy, who visited the University Medical Center Groningen (The Netherlands) outpatient clinic between November 2008 and March 2011, were invited to participate. In total, 707 KTR were included after signing informed consent. KTR with missing measurements of urinary selenium excretion (n = 14) were excluded from statistical analyses, resulting in 693 KTR, whose information is presented here. The endpoint of interest was all-cause mortality, and data were collected until December 2017. We contacted general practitioners or referring nephrologists in cases where the status of a patient was unknown. No participants were lost to follow-up. The current study was approved by the institutional review board (METc 2008/186) and adhered to the Declarations of Helsinki and Istanbul.
Data collection
Baseline clinical data were collected during a visit to the outpatient clinic, following a detailed protocol described previously [19]. Relevant transplant, donor and recipient data were extracted from the Groningen Renal Transplant Database [20]. Data collection is ensured by the continuous surveillance system of the outpatient clinic at our university hospital in close collaboration with affiliated hospitals.
KTR dietary intake was recorded through a semi-quantitative self-administered food frequency questionnaire (FFQ) of 177 items. This FFQ was developed at Wageningen University (The Netherlands) and previously validated for the Dutch population [21]. It records dietary intake information during the past month in natural units (e.g. slice of bread) or household measures (e.g. a teaspoon). After submission by the patient, the questionnaire was reviewed with the assistance of a health professional. Data were then converted into total energy and nutrient intake per day using the 2006 Dutch Food Composition Table [22]. Specific nutrient intakes were afterward adjusted for total energy intake according to the residual method [23].
Laboratory measurements and calculations
According to a strict protocol, all KTR were also asked to collect a 24-h urine sample during the day before they visited the outpatient clinic, and on the same visit, fasting blood samples were withdrawn. Urinary selenium excretion was measured by inductively coupled plasma mass spectrometry (ICPMS) ICAP Q instrument (Thermo Fisher Scientific, Waltham, MA, USA) at Synalb (Jena, Germany). The test has a detection limit of 0.3 μg/L, intra-assay variability of 0.8% and inter-assay variability of 1%. Measurements were conducted following DIN EN ISO 17294-2:2017-01 [24].
The Maroni equation based on 24-h urea excretion was used to calculate protein intake [25]. Low-density lipoprotein cholesterol was calculated by using the Friedewald equation, and estimated glomerular filtration rate (eGFR) by the serum creatinine-based Chronic Kidney Disease Epidemiology collaboration equation [26].
Statistical analysis
Data analyses, computations and graphs were performed with R 4.0.5 (R Foundation for Statistical Computing, IN, USA). The distribution of quantitative variables was assessed by Quantile-Quantile plots. For descriptive statistics, data are presented as mean (standard deviation [SD]) for normally distributed data and as median (interquartile range [IQR]) for variables with a non-normal distribution. Categorial data are expressed as number (percentage). Differences at baseline among subgroups of KTR according to tertiles of urinary selenium excretion were tested by one-way ANOVA for continuous variables with normal distribution, Mann–Whitney U test for continuous variables with skewed distribution and χ2 test for categorical variables.
The association of urinary selenium excretion with all-cause mortality was assessed by Cox proportional hazards regression analyses, which were performed by contrasting the risk of the first and second tertile of urinary selenium excretion against the third and by introducing urinary selenium excretion as a continuous variable. Adjustment was performed for age, gender and body surface area (Model 1). To maintain the number of variables proportional to the number of events, further adjustments were additive to Model 1 in the following manner: (i) protein, fruit, vegetable, bread and nuts intake in Model 2, (ii) eGFR, proteinuria and 24-h urinary volume in Model 3, (iii) pre-emptive transplantation, time since transplantation and donor type in Model 4, and (iv) prednisolone dose, use of calcineurin inhibitors and use of proliferation inhibitors in Model 5. Visualization was performed by survival curves by tertiles of urinary selenium excretion with adjustment according to Model 1. In addition, urinary selenium excretion, as a continuous variable, was plotted against the risk of all-cause mortality.
To assess the dietary determinants of urinary selenium excretion, we performed univariable linear regression analyses testing the association of urinary selenium excretion with the intake of macronutrients (protein, fat and carbohydrates intake), food groups (meat, fish, vegetable, fruit, bread, dairy and nuts intake) and reference variables that, according to the literature, correlate with urinary selenium excretion (sex, body surface area, eGFR, urinary volume and plasma albumin concentration) [9, 10, 27]. Next, to test these associations’ independence and select the stronger predictors of urinary selenium excretion, we performed two multivariable linear regression analyses, one for macronutrients and one for food groups, in which adjustment was performed for the reference variables.
Secondary analyses
We performed pre-specified interaction analyses to evaluate whether known risk factors for mortality in KTR (e.g. age, eGFR, plasma albumin concentration and protein intake) modified the association between urinary selenium excretion and all-cause mortality [28–31]. To do so, we introduced multiplicative interaction terms in the Cox regression analyses. We also explored the association of urinary selenium excretion with cause-specific mortality employing univariable Cox regression analyses. Infectious disease, cardiovascular disease and malignancy were discriminated as categories of cause-specific mortality. These analyses were adjusted according to Model 1 to avoid overfitting due to the reduced number of events. Furthermore, we evaluated the association between urinary selenium excretion in relation to energy and protein intake and the risk of all-cause mortality.
Finally, as sensitivity analyses, we replicated the dietary analyses using the calculated protein intake according to the FFQ instead of estimated by the Maroni equation and with the exclusion of patients who were outliers (outside the –2 and 2 SD) regarding 24-h urinary selenium excretion. We also evaluated the association of urinary selenium excretion with the risk of all-cause mortality after the exclusion of KTR (i) with eGFR <30 mL/min/1.73 m2, (ii) with proteinuria >0.5 g/24-h, (iii) who died within the first year of follow-up, (iv) who were outliers regarding the 24-h urinary selenium excretion and (v) with nonoptimal nutrition state according to their plasma albumin concentration (<40 g/L) [32].
For all regression analyses, urinary selenium excretion was log2 transformed; therefore, estimated regression coefficients are expressed per doubling of urinary selenium excretion. Models were checked for the fulfilment of linear and Cox regression analysis assumptions. A statistical significance level of P < .05 (two-tailed) was used.
RESULTS
Baseline characteristics
The baseline characteristics of the study population are presented in Table 1. In total, 693 KTR (43% men, 52 ± 12 years old, 99% Caucasian) were included in the analyses. Median urinary selenium excretion was 18.8 (IQR 15.1–23.4) μg/24-h. Mean eGFR was 52 ± 20 mL/min/1.73 m2, and 156 (23%) KTR had a urinary protein excretion >0.5 g/24-h. Compared with the first and second tertile of urinary selenium excretion, KTR in the third tertile were less often male (P < .001), and had higher body surface area (P < .001), higher urinary volume (P < .001), higher eGFR (P = .003) and higher urinary urea excretion (P < .001). These patients also received more frequent transplantation from a living donor (P = .01), were more recently transplanted (P = .01) and had higher plasma albumin concentration (P = .01). Regarding diet, KTR on the third tertile of urinary selenium excretion had a higher total caloric intake (P < .001), higher protein intake as calculated by the Maroni equation (P < .001) and the FFQ (P < .001), higher fat intake (P < .001), and higher meat (P = .003), fish (P = .001) and bread intake (P = .01).
Baseline characteristics of the study population and by tertiles of urinary selenium excretion.
| Tertiles of urinary selenium excretiona | |||||
|---|---|---|---|---|---|
| Overall KTR | Tertile 1 | Tertile 2 | Tertile 3 | Pb | |
| n | 693 | 231 | 231 | 231 | |
| Urinary selenium excretion, μg/24-h | 18.8 (15.1‒23.4) | 13.6 (11.4‒15.1) | 18.8 (17.6‒20.1) | 25.5 (23.4‒29.8) | |
| Demographics | |||||
| Age, years | 52 (12) | 53 (14) | 53 (13) | 52 (12) | .69 |
| Gender (male), n (%) | 299 (43) | 137 (59) | 98 (42) | 64 (28) | <.001 |
| Caucasian ethnicity, n (%) | 690 (99) | 230 (99) | 230 (99) | 230 (99) | 1.00 |
| Body surface area, m2 | 26.6 (4.78) | 25.8 (4.87) | 26.6 (4.71) | 27.6 (4.62) | <.001 |
| Kidney allograft function | |||||
| Urinary volume, mL/24-h | 2439 (799) | 2209 (777) | 2472 (784) | 2635 (780) | <.001 |
| eGFR, mL/min/1.73 m2a | 52 (20) | 49 (21) | 54 (20) | 55 (20) | .003 |
| Proteinuria ≥0.5 g/24-h, n (%) | 156 (23) | 58 (25) | 54 (23) | 44 (19) | .28 |
| Urinary urea excretion, mmol/24-h | 398 (114) | 304 (82) | 394 (83) | 468 (111) | <.001 |
| Kidney transplant characteristics | |||||
| Pre-emptive transplantation, n (%) | 106 (15) | 37 (16) | 40 (17) | 29 (13) | .34 |
| Living donor, n (%) | 234 (34) | 61 (26) | 85 (37) | 88 (38) | .01 |
| Time since transplantation, years | 5.39 (1.98‒12.0) | 6.40 (2.49‒14.2) | 5.62 (2.24‒12.2) | 4.64 (1.33‒9.99) | .01 |
| Immunosuppressive therapy | |||||
| Prednisolone usage, n (%) | 686 (99) | 229 (99) | 231 (100) | 226 (98) | .08 |
| Calcineurin inhibitor usage, n (%) | 397 (57) | 135 (58) | 126 (54) | 136 (59) | .59 |
| Proliferation inhibitor usage, n (%) | 573 (83) | 193 (84) | 187 (81) | 193 (84) | .70 |
| Acute rejection, n (%) | 185 (27) | 62 (27) | 63 (27) | 60 (26) | .95 |
| Cardiovascular history | |||||
| Systolic blood pressure, mmHga | 136 (18) | 135 (18) | 137 (18) | 136 (17) | .61 |
| Use of antihypertensives, n (%) | 611 (88) | 200 (87) | 206 (89) | 205 (89) | .65 |
| High-density lipoprotein‒cholesterol, mmol/Lb | 1.39 (0.48) | 1.39 (0.47) | 1.42 (0.51) | 1.36 (0.45) | .39 |
| Low-density lipoprotein, mmol/Lb | 2.98 (0.93) | 3.00 (0.94) | 2.97 (0.99) | 2.98 (0.87) | .92 |
| Use of statins, n (%) | 366 (53) | 122 (53) | 124 (54) | 120 (52) | .93 |
| Diabetes mellitus, n (%) | 162 (23) | 60 (26) | 47 (20) | 55 (24) | .35 |
| Current smoker, n (%)c | 81 (13) | 21 (10) | 31 (15) | 29 (13) | .27 |
| Inflammation | |||||
| High-sensitivity C-reactive protein, mg/Ld | 1.60 (0.70‒4.57) | 1.60 (0.70‒4.43) | 1.40 (0.80‒3.80) | 1.70 (0.78‒5.10) | .66 |
| Plasma albumin concentration, g/La | 43.0 (2.99) | 42.6 (3.23) | 42.9 (2.90) | 43.4 (2.78) | .01 |
| Dietary intake | |||||
| Total caloric intake, kcal/daye | 2093 (1713‒2536) | 1979 (1669‒2424) | 2093 (1665‒2531) | 2208 (1879‒2672) | <.001 |
| Protein (Maroni), g/day | 85.4 (20.6) | 70.1 (14.7) | 86.5 (15.0) | 99.6 (19.9) | <.001 |
| Protein (FFQ), g/daye | 82.0 (20.3) | 76.8 (18.2) | 80.7 (20.5) | 88.5 (20.4) | <.001 |
| Carbohydrates, g/daye | 249 (79) | 242 (74) | 248 (83) | 257 (78) | .17 |
| Fat, g/daye | 84 (64‒105) | 79 (62‒100) | 84 (60‒105) | 90 (71‒111) | <.001 |
| Meat, g/dayf | 95.6 (39.3) | 89.1 (40.5) | 95.5 (38.9) | 102 (37.5) | .003 |
| Fish, g/dayf | 11.4 (4.18‒20.7) | 9.97 (3.00‒16.7) | 12.4 (4.68‒20.0) | 15.0 (4.68‒23.9) | .001 |
| Fruits, g/dayf | 123 (64.9‒232) | 117 (63.7‒232) | 120 (58.0‒232) | 132 (80.4‒246) | .09 |
| Vegetables, dayf | 90.5 (53.8‒123) | 90.5 (45.9‒122) | 90.5 (52.3‒115) | 91.1 (59.4‒133) | .39 |
| Bread, g/dayf | 131 (92.1‒168) | 112 (82.8‒153) | 133 (98.7‒170) | 136 (102‒172) | .01 |
| Dairy intake, dayg | 124 (62.1‒145) | 124 (62.1‒145) | 124 (62.1‒145) | 124 (41.4‒145) | .93 |
| Nuts intake, dayh | 0.00 (0.00‒3.93) | 0.00 (0.00‒2.63) | 0.39 (0.00‒3.93) | 0.39 (0.00‒4.34) | .15 |
Tertile 1: <16.4 μg/24-h; tertile 2: 16.4‒21.6 μg/24-h; tertile 3: >21.6 μg/24-h.
Differences were tested by ANOVA for continuous variables with normal distribution, Mann–Witney U test for continuous variables with non-normal distribution and by χ2 test for categorical variables. Data available in a690, b683, c647, d650, e631, f632, g630 and h633 patients.
HbA1c, glycated haemoglobin.
Data are presented as mean (SD), median (IRQ) or n (%).
Longitudinal analyses
During a median follow-up of 8.2 (IQR 4.7–8.9) years, 229 KTR (33%) died. Cox regression analyses revealed that being on the first tertile of urinary selenium excretion when compared with the third tertile was directly associated with over double risk of all-cause mortality {hazard ratio (HR) 2.36 [95% confidence interval (CI) 1.70‒3.28]; P < .001}. Adjustment for the variables included in the pre-defined models previously described did not materially change the association (Fig. 1, Table 2). The results were consistent when urinary selenium excretion was analysed as a continuous variable, with a doubling of urinary selenium excretion being associated with a decreased risk of all-cause mortality [HR 0.57 (95% CI 0.43‒1.76); P < 0.001], also independent of adjustment for the variables included in the pre-defined models previously described (Fig. 2, Table 2).
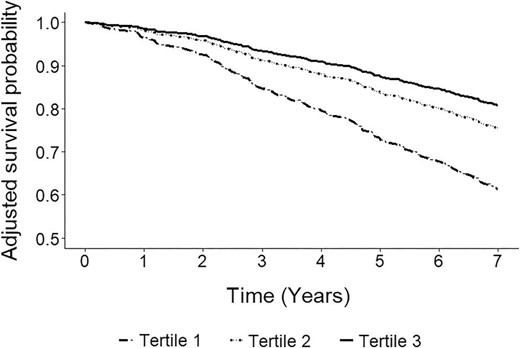
Adjusted survival curves by tertiles of urinary selenium excretion. Tertile 1: <16.4 μg/24-h; tertile 2: 16.4‒21.6 μg/24-h; tertile 3: >21.6 μg/24-h. In total, 229 (33%) KTR died (tertile 1: 107, tertile 2: 68, tertile 3: 54). Adjustment was performed by age, sex and body surface area.
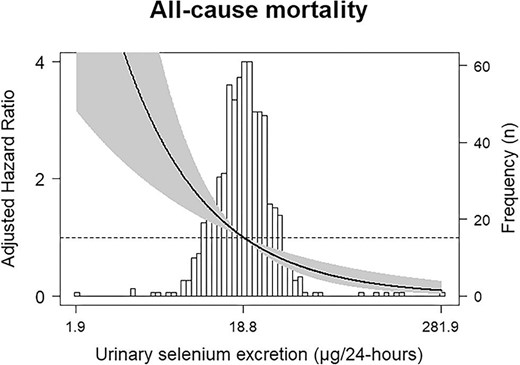
Associations between urinary selenium excretion and all-cause mortality in KTR. Data were fit by a Cox proportional hazards regression model that was based on cubic splines. Adjustment was performed by age, sex and body surface area. The reference value was the median of urinary selenium excretion: 18.8 μg/24-h. The solid line represents HR. The grey area represents the 95% CI.
Association between urinary selenium excretion and all-cause mortality in KTR.
| Tertiles of urinary selenium excretiona | ||||||||||
|---|---|---|---|---|---|---|---|---|---|---|
| Tertile 1 | Tertile 2 | Tertile 3 | Urinary selenium excretion, log2 | |||||||
| Models | HR | 95% CI | P | HR | 95% CI | P | Ref | HR | 95% CI | P |
| Crude | 2.36 | 1.70‒3.28 | <.001 | 1.34 | 0.94‒1.91 | .11 | Ref | 0.55 | 0.44‒0.70 | <.001 |
| Model 1 | 2.49 | 1.76‒3.54 | <.001 | 1.35 | 0.94‒1.93 | .11 | Ref | 0.55 | 0.42‒0.71 | <.001 |
| Model 2 | 2.12 | 1.45‒3.11 | <.001 | 1.18 | 0.79‒1.75 | .41 | Ref | 0.63 | 0.48‒0.84 | .001 |
| Model 3 | 2.18 | 1.52‒3.12 | <.001 | 1.23 | 0.86‒1.77 | .26 | Ref | 0.62 | 0.48‒0.81 | <.001 |
| Model 4 | 2.46 | 1.73‒3.49 | <.001 | 1.36 | 0.94‒1.95 | .10 | Ref | 0.57 | 0.44‒0.73 | <.001 |
| Model 5 | 2.47 | 1.74‒3.50 | <.001 | 1.33 | 0.93‒1.91 | .12 | Ref | 0.55 | 0.43‒0.71 | <.001 |
Tertile 1: <16.4 μg/24-h; tertile 2: 16.4‒21.6 μg/24-h; tertile 3: >21.6 μg/24-h. In total, 229 (33%) KTR died (tertile 1: 107, tertile 2: 68, tertile 3: 54). Model 1: adjustment for age, sex and body surface area. Model 2: Model 1 + plasma albumin concentration, and protein, bread, fruit, vegetable and bread intake. Model 3: Model 1 + proteinuria, eGFR and urinary volume. Model 4: Model 1 + pre-emptive transplantation, living donor and time since transplantation. Model 5: Model 1 + calcineurin inhibitor usage, proliferation inhibitor usage and acute rejection treatment.
Dietary determinants of urinary selenium excretion
In univariable linear regression analyses, urinary selenium excretion was significantly associated with protein [Standardized (Std) β 0.54, P < .001] and fat intake (Std β 0.11, P = .01), among the macronutrients; with meat (Std β 0.12, P = .003), fish (Std β 0.15, P < .001), vegetable (Std β 0.11, P = .01) and bread intake (Std β 0.08, P = .04), among the food groups; and with male sex (Std β –0.18, P < .001), body surface area (Std β 0.27, P < .001), urinary volume (Std β 0.23, P < .001), eGFR (Std β 0.10, P = 0.01) and plasma albumin concentration (Std β 0.13, P < .001) among the reference variables (Supplementary data, Table S1).
In multivariable linear regression analyses, protein intake remained the variable with the stronger association with urinary selenium excretion in the macronutrient model (Std β 0.48, P < .001), independent of adjustment for other macronutrients intake and the reference variables. In this model, fat intake was no longer significantly associated with urinary selenium excretion (P = .20). In the food groups model, fish intake was still significantly associated with urinary selenium excretion after adjustment for other food groups and the reference variables (Std β 0.12, P < .001). In this model, meat and vegetable intake were no longer significantly associated with urinary selenium excretion (Std β 0.06, P = .13 and Std β 0.05, P = .16, respectively; Table 3).
Multivariable association of macronutrients and food groups intake with urinary selenium excretion in KTR.
| Urinary selenium excretion, log2 | ||
|---|---|---|
| Std β | P | |
| Macronutrients, g/24-h | ||
| Protein (Maroni) | 0.48 | <.001 |
| Fat | 0.06 | .20 |
| Carbohydrates | −0.06 | .22 |
| R2 = 0.30, all VIF < 4 | ||
| Food groups, g/24-h | ||
| Fish | 0.12 | .001 |
| Meat | 0.06 | .13 |
| Vegetable | 0.05 | .16 |
| Fruit | 0.04 | .35 |
| Bread | −0.001 | .99 |
| Dairy | 0.05 | .21 |
| R2 = 0.17, all VIF < 4 | ||
Multivariable linear regression analyses were performed. Adjustment was performed in each linear regression analysis by sex, body surface area, eGFR, urinary volume and plasma albumin concentration.
VIF, variance inflation factor.
Secondary analyses
The association between urinary selenium excretion and all-cause mortality was not significantly modified by factors previously associated with mortality in KTR (e.g. age, eGFR, plasma albumin concentration and protein intake; Supplementary data, Table S2). When exploring cause-specific mortality, among KTR who died during follow-up, 61 (27%) died from infectious causes, 82 (35%) from cardiovascular causes, 43 (19%) from causes related to malignancy and 43 (19%) due to other reasons. In univariable Cox regression analyses, KTR in the first tertile of urinary selenium excretion, when compared with the third tertile, were at increased risk of death due to infectious disease [HR 4.49 (95% CI 2.07‒9.73); P < .001] and cardiovascular events [HR 1.83 (95% CI 1.04‒3.19); P = .04]. There was no increased risk of malignancy-related mortality [HR 1.75 (95% CI 0.83‒3.71); P = .14]. When introducing selenium as a continuous variable, a doubling in urinary selenium excretion was associated with a lower risk of infectious mortality [HR 0.44 (95% CI 0.28‒0.71); P < .001], and there was no longer an association between urinary selenium excretion and cardiovascular mortality (P = .07; Supplementary data, Table S3). Finally, we assessed urinary selenium excretion in relation to energy and protein intake. The median urinary selenium excretion per 100 kcal ingested was 0.89 (IQR 0.69–1.18) μg. A doubling in the urinary selenium excretion/energy intake ratio was associated with a lower risk of all-cause mortality [HR 0.79 (95% CI 0.64‒0.98); P = .03]. Likewise, the median urinary selenium excretion per 100 g protein ingested was 23.24 (IQR 18.54–30.36) μg. A doubling in the urinary selenium excretion/protein intake ratio was also associated with a lower risk of all-cause mortality [HR 0.66 (95% CI 0.52‒0.95); P < .001]. Both associations were independent of adjustment according to the pre-defined models (Supplementary data, Table S4).
Sensitivity analyses
In sensitivity analyses of the association between protein intake and urinary selenium excretion, introducing protein intake as measured by the FFQ in the macronutrient model did not materially change the results. Protein intake remained the variable most strongly associated with urinary selenium excretion, independent of other macronutrients intake and the reference variables (Std β 0.34, P < .001; Supplementary data, Table S5). Next, in total, 7 (1%) KTR were outliers regarding 24-h urinary selenium excretion. Excluding these patients from the analyses also did not materially change the results (Std β 0.56, P < .001; Supplementary data, Table S6). In further sensitivity analyses, urinary selenium excretion as a continuous variable remained inversely associated with the risk of all-cause mortality after the exclusion of KTR (i) with eGFR <30 mL/min/1.73 m2 [HR 0.60 (95% CI 0.44‒0.80); P < .001], (ii) with proteinuria ≥0.5 g/24-h [HR 0.54 (95% CI 0.40‒0.72); P < .001], (iii) who died within the first year of follow-up [HR 0.53 (95% CI 0.41‒0.70); P < .001], (iv) outliers regarding 24-h urinary selenium [HR 0.50 (95% CI 0.39‒0.65); P < .001] and with nonoptimal nutrition state according to their plasma albumin concentration [HR 0.55 (95% CI 0.41‒0.73); P < .001; Supplementary data, Table S7].
DISCUSSION
In a large cohort of outpatient KTR, we found that urinary selenium excretion, a biomarker of selenium intake, was lower than reported in healthy individuals [10]. Furthermore, we found that a relatively low selenium excretion is associated with a higher risk of all-cause mortality, independent of several potential confounders, including age, eGFR, transplant vintage, protein intake and plasma albumin concentration. The primary determinant of urinary selenium excretion in KTR was protein intake. These findings agree with previous studies reporting selenium deficiency in KTR compared with healthy individuals [11, 33]. The current results also align with data in hemodialysis patients, where selenium deficiency was associated with increased mortality risk [5]. However, to our knowledge, this is the first study to assess the association between urinary selenium excretion and long-term survival in the outpatient kidney transplant setting.
A deficiency of trace elements, namely selenium, has been previously reported in KTR [5, 11, 12]. This phenomenon is considered partly a remanent effect of end-stage kidney disease, where selenium is decreased due to low intake caused by uremia-related anorexia and removal during dialysis [5, 12]. After kidney transplantation, a previous study reported that in the initial phase, selenium further decreases, potentially because of post-operatory dietary restrictions. However, in this study, at the end of the 90 days of follow-up, when dietary restrictions were no longer present, selenium still remained lower among these patients compared with healthy individuals [33]. Among KTR, mycophenolate use has also been shown to enhance deficient selenium status by increasing oxidation and selenoproteins requirements [13]. According to our results, decreased selenium intake also contributes to selenium deficiency in outpatient KTR since urinary selenium excretion, highly correlated with selenium intake, was lower in our cohort than previously reported for healthy individuals [10].
Selenium is mainly present in organ meats, meat, fish, seafood and Brazilian nuts [34]. In this study, protein intake was the primary determinant of urinary selenium excretion in KTR, above other macronutrients and important patient characteristics such as sex and graft function. Of note, several previous studies have found a harmful effect of low protein intake with a diminished patient and graft survival in KTR [35]. Decreased selenium intake might be a potential mediator in these associations. In our analyses, intake of food groups of animal origin, mainly fish and meat, were the ones strongly associated with urinary selenium excretion. These results suggest that evaluating and guaranteeing proper selenium intake among KTR following plant-based diets is particularly important [36]. Importantly, selenium deficiency must not be considered as a surrogate marker for malnutrition. First, as shown by this study and reported before, selenium intake is related to particular food groups, therefore it does not reflect general diet quality [37]. Furthermore, in populational studies assessing healthy individuals without clinical or laboratory signs of malnutrition, selenium deficiency has been identified in an important proportion of subjects, indicating that these two processes can occur independently [38].
It is important to mention that although selenium intake is the main determinant of urinary selenium excretion [9, 27], it is also influenced by other parameters. A strong correlation between creatinine and selenium clearance has been reported before, suggesting that urinary selenium excretion is dependent on GFR [27]. After filtration, there is also evidence suggesting that selenium reabsorption in the proximal tubules occurs, mainly reflected by the relatively low clearance of selenium when compared with that of creatinine, and the role of the proximal tubules as the main source of synthesis of the selenoprotein glutathione peroxidase in the human body [27, 39, 40]. Regarding a potential role of urinary protein excretion in modifying the urinary selenium excretion, previous studies have not found consistent associations between the two, suggesting that most of the excreted selenium via urine is not protein bound. However, under conditions of increased urinary protein excretion, selenium losses via urine may be concomitant with protein losses in urine [27]. Finally, skeletal muscle is an important site of selenium storage, accounting for nearly 30%–50% of the whole body content of selenium [40, 41]. An association between urinary creatinine and selenium excretion has been consistently reported and is an indicator that muscle mass also influences urinary selenium excretion [40, 41]. The selenium–creatinine excretion ratio has been proposed as a potential useful marker when muscle-derived selenium is to be investigated [27, 42].
We also found that KTR with a relatively low urinary selenium excretion had a higher risk of long-term all-cause mortality. These results are consistent with previous studies that linked selenium deficiency with a higher risk of all-cause mortality in hemodialysis patients [5]. Furthermore, meta-analyses studying the effect of selenium supplementation in other clinical scenarios, such as patients in the intensive care unit, have shown benefits in patient survival [43, 44]. Selenium is vital for body homeostasis. It regulates redox balance by incorporating selenium-dependent enzymes such as selenoproteins P, thioredoxin reductase and the potent antioxidant glutathione peroxidase [9, 15]. It works as a redox center and reduces hydrogen peroxide and damaging lipid and phospholipid hydroperoxides to harmless products like water and alcohol, avoiding the propagation of oxidative damage [8]. Selenium also influences the innate and acquired immune systems [45]. Animal experiments have shown that in selenium-depleted environments, there is impaired lymphocytic proliferation, macrophages’ effective production of leukotriene B4 synthesis, and neutrophil chemotaxis [45, 46]. Human studies also showed a decrease in immunoglobulin G and immunoglobulin M titers in individuals with selenium deficiency [45]. In agreement, we found that infectious mortality events were significantly higher in patients with a relatively low urinary selenium excretion, suggesting less immunocompetence in these KTR. Current dietary guidelines recommend a selenium dietary allowance of 55 μg/day [34]. It has been reported that a urinary selenium excretion higher than 20 μg/24-h is indicative of appropriate selenium intake [10]. This cut-off point is very similar to what we found in our cohort to be the inferior limit of the third tertile of urinary selenium excretion, which was also the group at lower risk of all-cause mortality. Whether these values are applicable for KTR requires further research.
The present study has several strengths. To our knowledge, it comprises the largest KTR cohort in which the association between selenium intake and all-cause mortality has been evaluated. Moreover, our extensively phenotyped cohort allowed us to control for several potential confounders, among which demographic measurements, graft function and immunosuppressive therapy were taken into account. Furthermore, we have a long-term follow-up without losses. The present study also has several limitations. We did not possess repeated measurements of urinary selenium excretion. However, previous studies suggest that accounting for intra-individual variability of biomarkers increases their predictive properties. Therefore, the higher the intra-individual variation of urinary selenium excretion is, the bigger the expected benefit of repeated measurements in strengthening the association we describe in this study [47]. Also, the study was carried out in a center with an over-representation of the Caucasian population, which calls for prudence in extrapolating our results to people of other ethnicities. Next, although we assessed the most discriminatory biomarker for low selenium dietary intake [48], we lacked other measurements such as plasma selenium, selenoproteins and erythrocyte selenium content to also assess selenium status and body pool [48, 49]. Finally, the observational nature of this study makes it difficult to discern whether high urinary selenium excretion is a protector against all-cause mortality or merely a marker of lower risk. However, the interventional evidence obtained in other populations favours a potential protective role of selenium. Finally, as with any observational study, residual confounding may have existed despite the substantial number of potentially confounding factors for which we adjusted.
In conclusion, in outpatient KTR, relatively low urinary selenium intake is associated with a higher risk of long-term all-cause mortality. The most crucial determinant of selenium intake in this population was protein intake. These results offer a rationale for further studies exploring potential selenium monitoring and selenium-directed nutritional interventions aimed to improve the long-term survival in KTR, particularly those with low protein intake. The observational nature of this study does not allow us to support selenium supplementation in KTR at the moment.
FUNDING
This study was based on the TransplantLines Food and Nutrition Biobank and Cohort Study (TxL-FN), funded by the Top Institute Food and Nutrition of the Netherlands (grant A-1003). This collaboration project is co-financed by the Dutch Ministry of Economic Affairs and Climate Policy through the PPP allowance made available by the Top Sector Life Sciences & Health to stimulate public–private partnerships.
AUTHORS’ CONTRIBUTIONS
G.J.N., G.R. and S.J.L.B. designed the study; D.K., U.S., P.H., T.J.K., K.L. and G.R. performed the measurements and provided the data; M.Y.-C., D.K., M.H.B. and S.J.L.B. analyzed the data; C.G.S., A.P., M.F.E., E.C., M.H.B. and S.J.L.B. provided critical review, advice and consultation throughout; M.Y.-C. and A.P. made the figures; M.Y.-C., A.P., M.H.B. and S.J.L.B. drafted and revised the paper; all authors approved the final version of the manuscript.
CONFLICT OF INTEREST STATEMENT
None declared.
DATA AVAILABILITY STATEMENT
The data underlying this article will be shared on reasonable request to the corresponding author.


Comments