


ABSTRACT
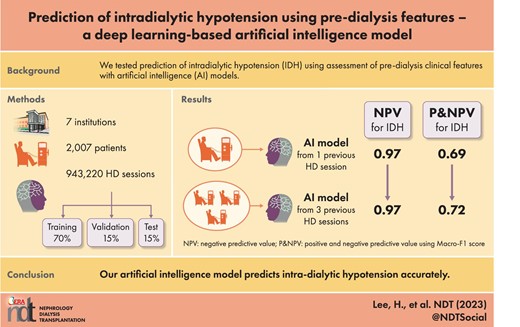
Intradialytic hypotension (IDH) is a serious complication of hemodialysis (HD) that is associated with increased risks of cardiovascular morbidity and mortality. However, its accurate prediction remains a clinical challenge. The aim of this study was to develop a deep learning–based artificial intelligence (AI) model to predict IDH using pre-dialysis features.
Data from 2007 patients with 943 220 HD sessions at seven university hospitals were used. The performance of the deep learning model was compared with three machine learning models (logistic regression, random forest and XGBoost).
IDH occurred in 5.39% of all studied HD sessions. A lower pre-dialysis blood pressure (BP), and a higher ultrafiltration (UF) target rate and interdialytic weight gain in IDH sessions compared with non-IDH sessions, and the occurrence of IDH in previous sessions was more frequent among IDH sessions compared with non-IDH sessions. Matthews correlation coefficient and macro-averaged F1 score were used to evaluate both positive and negative prediction performances. Both values were similar in logistic regression, random forest, XGBoost and deep learning models, developed with data from a single session. When combining data from the previous three sessions, the prediction performance of the deep learning model improved and became superior to that of other models. The common top-ranked features for IDH prediction were mean systolic BP (SBP) during the previous session, UF target rate, pre-dialysis SBP, and IDH experience during the previous session.
Our AI model predicts IDH accurately, suggesting it as a reliable tool for HD treatment.
What is already known about this subject?
Intradialytic hypotension (IDH) is one of the most frequent complications of hemodialysis (HD) and is associated with increased risks of cardiovascular morbidity and mortality.
However, due to the complex and multifactorial mechanisms, predicting the occurrence of IDH prior to HD is a challenge for clinicians.
Although few artificial intelligence (AI) models have been developed to predict IDH, they are mostly based on standard machine learning algorithms and were developed using data from a single institution.
What this study adds?
The performance of this deep learning-based AI model was superior to previously reported results.
Combining clinical data from the most recent three sessions created a deep learning–based AI model to achieve the best predictive performance.
What impact this may have on practice or policy?
This deep learning–based AI model predicts IDH accurately, thus it would be a reliable and easy screening tool for IDH.
This AI model could allow clinicians to identify vulnerable patients and adjust HD settings before HD treatment.
INTRODUCTION
Intradialytic hypotension (IDH) is one of the most frequent complications of hemodialysis (HD), with a reported incidence of about 10%–12% according to the applied diagnostic criteria [1, 2]. IDH results in inadequate dialysis doses with subsequent volume overload; hence, it is ultimately associated with increased cardiovascular morbidity and mortality rates in patients under maintenance HD [3, 4]. Prior studies have suggested an imbalance between intravascular volume reduction and intracellular refilling; an inadequacy of compensatory mechanisms, such as an increase in heart rate or myocardial contractility; and the constriction of resistance or capacitance vessels as the main cause of IDH [5, 6]. In other words, both patient-related and dialysis-related factors are associated with the hypotension during HD [4, 7, 8]. Due to the complex and multifactorial mechanisms, predicting the occurrence of IDH prior to HD is a challenge for clinicians [9].
Recently, various medical fields have begun to rely on artificial intelligence (AI) due to its ability to integrate and interpret the complexity and the large volume of big data. Recent advancements in deep learning allow feature extraction without the feature selection required for standard machine learning algorithms [10], and interpretation of unstructured forms of data such as images and sounds. In the field of nephrology, studies have applied AI to interpret data derived from dialysis and kidney transplant patients [11, 12], including developments of AI models to predict IDH. The studied IDH prediction models are mostly based on standard machine learning algorithms and were developed using data from a single institution [13–16].
Considering the previous AI studies on IDH, we aimed to develop deep learning algorithms to predict its occurrence using electronic medical records (EMRs) from seven independent general hospitals extracted from the well-established clinical data warehouse (CDW) of the Catholic Medical Center (CMC) [17]. For this, we preprocessed a large dataset of HD patients from each dialysis unit and then developed a deep learning–based prediction model. Use of multi-center data minimizes the clinician bias present in single-institution data, providing a model applicable to all seven hospital dialysis systems. Using the developed AI model, we intended to present a useful screening tool to guide clinicians to identify patients vulnerable to IDH and to help them perform preventive interventions prior to initiation of HD treatment.
MATERIALS AND METHODS
Data sources
All data were extracted from the CDW of the CMC, which provided access to an EMR database of patients from seven affiliated hospitals constituting the CMC, the largest healthcare network in Korea, including the Seoul, Bucheon, Eunpyeong, Incheon, Uijeongbu, and Yeouido St Mary's Hospitals and St Vincent's Hospital. We retrieved data for the following categories consisting of multiple features: demographics, comorbidities, medications, laboratory findings and HD records including HD settings, and vital signs during HD treatment. Since the data were encoded and anonymized, informed consent was not required. The study protocol was reviewed and approved by the Institutional Review Board of Catholic University of Korea (XC20WIDI0025).
Study population
We extracted the medical records of patients who underwent HD at CMC between 1 March 2009 and 31 December 2019. We initially identified 1 359 117 HD sessions among 16 914 patients. We excluded individuals who did not undergo consecutive HD sessions for at least 90 days or were <18 years of age (383 206 sessions in 14 751 patients). After data preprocessing as described later, a total of 943 220 sessions from 2007 patients remained. The selected patients were randomly divided into a training set (70%, 651 380 sessions in 1404 patients) to develop a prediction model, a validation set (15%, 146 808 sessions in 301 patients) to validate the model and a test set (15%, 145 032 sessions in 302 patients) to test the classification performance of the model. The dataset was split in such a way that similar proportions of IDH occurrence remained in each dataset. The training set included 34 616 IDH sessions (≈5.31% of total sessions), the validation set included 7911 IDH sessions (≈5.39% of total sessions) and the test set included 8357 IDH sessions (≈5.76% of total sessions). The flowchart of study population retrieval and splitting is shown in Fig. 1. Even though the number of digits in the session number is very large, the percentage is rounded to only two decimal places. Therefore, there is the discrepancy between the number of sessions calculated by percentage and real counted sessions in database. In order to minimize misunderstanding, ‘≈’ was added in front of the percentage.
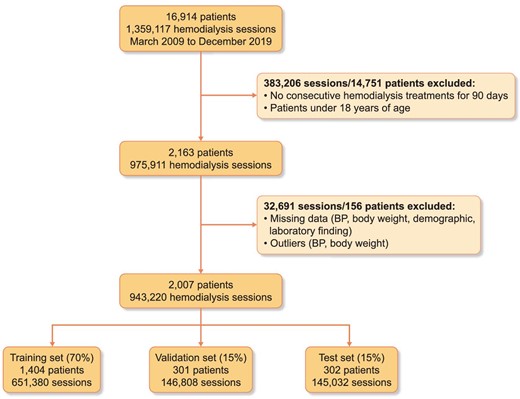
The flowchart of study population retrieval and splitting.
Study variables and preprocessing
A total of 36 predictor variables from patient demographics, comorbidities, medications, laboratory findings and HD records was used during prediction model development. The formula for the calculation of body mass index, interdialytic weight change and ultrafiltration (UF) target rate were presented as Supplementary data, Fig. S1.
Missing data were handled according to the characteristics of each feature. All variables with missing data were double-checked using the anonymized CDW database to minimize data loss. For blood pressure (BP) and body weight, outliers were removed from the dataset. If the systolic BP (SBP) was less than or equal to diastolic BP (DBP), then the BP data were considered outliers. Based on the difference between dry weight, pre-dialysis weight and post-dialysis weight, the outliers of body weight were determined. After double-checking missing data and removing outliers, null values of comorbidities, medications and HD records were filled forward under the assumption of continuous treatment. Patients with <50% of missing data of weights and BPs were filled in by rolling the average of a minimum of two and maximum of six measures. Patients who continued to have missing records after missing data and outliers handling were excluded from the study.
IDH was defined according to the following criteria: (i) nadir SBP <100 mmHg when the initial SBP was ≥160 mmHg, (ii) nadir SBP <90 mmHg when the initial SBP was 90 ≤ SBP < 160 mmHg, or (iii) ≥20 mmHg intradialytic SBP decrease when the initial SBP was <90 mmHg. IDH criteria was treated as a binary outcome, with positive occurrence of IDH.
Model development
We developed a predictive deep learning model based on one-dimensional convolutional neural network (1D-CNN) (Fig. 2). The proposed model was built with 1D convolution layers, skip connections and a fully connected layer. The model had five consecutive 1D-CNN blocks and two skip blocks. Each convolution block consisted of three convolution layers, followed by batch normalization and a dropout layer. After convolution computation, a fully connected layer output classification result was obtained using a sigmoid function. Each layer used the rectified linear unit activation function, and the dropout rate was 0.3. Machine learning algorithms of logistic regression, random forest (RF) [18] and XGBoost models [19] were trained and validated to compare their predictive performances with that of the 1D-CNN model.
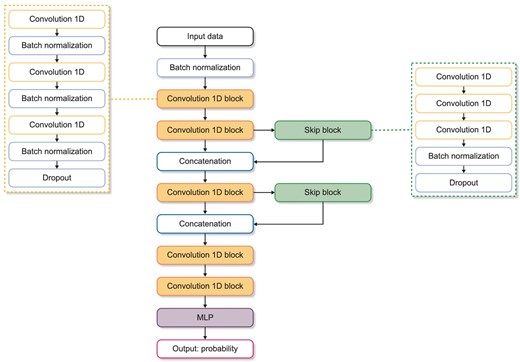
Neural network structure of the proposed 1D convolutional model. The proposed model is constructed with 1D convolution layers, skip connections and a fully connected layer. Each convolution block consists of three convolution layers, followed by batch normalization and a dropout layer. After convolution computation, a fully connected layers output classification result was attained using sigmoid function. MLP, multilayer perceptron; ReLU, rectified linear unit.
Model evaluation
The performance of models was evaluated using accuracy, recall, precision, macro-averaged F1 score (macro F1 score), area under the precision-recall curve (AUPRC), area under the receiver operating curve (AUROC), specificity, negative predictive value (NPV) and Matthews correlation coefficient (MCC) [20]. The threshold was set to maximize the F1 score of the positive values. Each of the metric calculations is presented as Supplementary data, Fig. S2, with true negative (TN), true positive (TP), false negative (FN) and false positive (FP) values.
The 95% confidence interval (CI) for each model performance metric was calculated using bootstrapping on the test set, employing 14 503 randomly selected samples with replacement, for a total of 1000 bootstraps.
Feature importance analysis
To examine the effect of each feature on IDH, we analyzed feature importance and visualization on the machine learning algorithms and the developed deep learning models. Traditionally, the machine learning algorithms used in this study have their own methods of extracting feature importance. We also used the Shapley additive explanation (SHaP) tool on all the classification models to calculate the feature contributions to the changes in prediction performance of a model based on game theory approach [21]. SHaP allows users to calculate and visualize feature contributions for deep learning models from tabular data, enabling comparisons between feature importance across all the models used.
Statistical analysis
Numerical variables are expressed as mean ± standard deviation or median (interquartile range), and the categorical variables are presented as total count and percentage. In two-group comparisons, a Mann–Whitney U test was performed for continuous variables. All categorical variables were compared using the chi-square test of independence. The significance level was set as α = 0.05. All statistical analyses were conducted using Python version 3.6.10 (Python Software Foundation, Wilmington, DE, USA) and SciPy library [22].
RESULTS
Baseline characteristics of the HD sessions analyzed
Full baseline demographic features and HD settings are listed in Table 1. IDH occurred in ≈5.39% (50 884 sessions) of all studied HD sessions, and 76.6% of all studied patients experienced IDH at least once in their continuous dialysis treatments. Among all HD sessions, ≈5.38% (50 765 sessions) involved IDH during the previous session. The mean pre-dialysis SBP and DBP values were 142.0 ± 22.9 and 75.5 ± 14.5 mmHg, respectively.
Baseline characteristics of the HD sessions analyzed.
| n = 943 220 | Results |
|---|---|
| Age (years) | 60.15 ± 13.13 |
| Male, n (%) | 489 824 (51.93) |
| BMI (kg/m2) | 23.05 ± 3.77 |
| Dialysis vintage (years) | 4.00 (2.00–8.00) |
| Setting of blood flow rate (mL/min) | 250.00 (250.00–300.00) |
| Pre-dialysis SBP (mmHg) | 141.96 ± 22.85 |
| Pre-dialysis DBP (mmHg) | 75.51 ± 14.47 |
| Pre-dialysis PR (b.p.m.) | 73.59 ± 12.42 |
| Last session mean SBP (mmHg) | 136.12 ± 19.15 |
| Last session mean DBP (mmHg) | 73.86 ± 12.59 |
| Last session mean PR (b.p.m.) | 74.07 ± 12.01 |
| UF target rate (mL/kg/h) | 10.07 (6.90–13.50) |
| Interdialytic weight gain (%) | 3.96 ± 1.92 |
| Dialysate, n (%) | |
| Glucose dialysate | 423 614 (44.91) |
| Glucose-free dialysate | 374 575 (39.71) |
| Low calcium dialysate | 135 912 (14.41) |
| Others | 9119 (0.97) |
| Vascular access, n (%) | |
| Arteriovenous fistula | 758 349 (80.40) |
| Arteriovenous graft | 125 110 (13.26) |
| Catheter | 59 761 (6.34) |
| Dialyzer surface area (m2), n (%) | |
| 1.4 | 152 121 (16.13) |
| 1.7 | 407 537 (43.21) |
| 1.8 | 282 575 (29.96) |
| 2.0 | 72 808 (7.72) |
| 2.1 | 28 121 (2.98) |
| 2.3 | 58 (0.01) |
| Dialysis mode, n (%) | |
| HD | 882 188 (93.53) |
| HDF | 61 032 (6.47) |
| Anticoagulation, n (%) | |
| Heparin | 942 655 (99.94) |
| Nafamostat | 560 (0.06) |
| None | 5 (0.00) |
| Comorbidities, n (%) | |
| Ischemic heart disease | 220 898 (23.42) |
| Valvular heart disease | 18 712 (1.98) |
| Arrhythmia | 80 816 (8.57) |
| Liver disease | 16 422 (1.74) |
| COPD | 63 785 (6.76) |
| Diabetes mellitus | 250 613 (26.57) |
| Medications, n (%) | |
| Calcium channel blocker | 519 168 (55.04) |
| Alpha blocker | 78 356 (8.31) |
| Beta blocker | 357 264 (37.88) |
| Angiotensin II receptor blocker | 484 494 (51.37) |
| Calcium-based phosphate binder | 549 339 (58.24) |
| Number of anti-hypertensive drugs, n (%) | |
| 0 | 265 507 (28.15) |
| 1 | 658 519 (69.82) |
| 2 | 6855 (0.73) |
| 3 | 11 973 (1.27) |
| 4 | 358 (0.04) |
| 5 | 0 (0.00) |
| 6 | 8 (0.00) |
| Lab findings | |
| Hemoglobin (g/dL) | 10.73 ± 1.27 |
| Glucose (mg/dL) | 111.00 (89.00–153.00) |
| Albumin (g/dL) | 3.87 ± 0.42 |
| Sodium (mmol/L) | 138.34 ± 3.28 |
| Calcium (mg/dL) | 9.01 ± 0.85 |
| Phosphorus (mg/dL) | 4.71 ± 1.68 |
| Intact PTH (pg/mL) | 122.78 (53.17–232.40) |
| Ferritin (ng/mL) | 251.60 (137.99–430.40) |
| IDH in previous session, n (%) | 50 765 (5.38) |
| IDH, n (%) | 50 884 (5.39) |
Continuous variables are presented as mean ± standard deviation or median (25th percentile–75th percentile). Categorical variables are presented as count and proportion (%).
BMI, body mass index; HDF, hemodiafiltration; COPD, chronic obstructive lung disease.
Comparison of the clinical features between IDH and non-IDH HD sessions
We performed comparative group tests on demographic features and HD settings between IDH and non-IDH sessions. IDH sessions showed longer dialysis vintage, lower pre-dialysis SBP and pre-dialysis DBP values, and higher pre-dialysis pulse rate (PR), UF target rates and interdialytic weight gain than the non-IDH sessions (Table 2). The mean SBP and DBP values during previous HD sessions were lower among the IDH sessions and the occurrence of IDH in previous sessions was more frequent among IDH sessions compared with non-IDH sessions (35.6% vs 3.7%, P < .001). There was no significant difference in age, anticoagulation or prescription of calcium-based phosphate binders between two groups. A higher prevalence of comorbidities, such as ischemic heart disease, valvular heart disease, arrhythmia, liver disease, chronic obstructive lung disease and diabetes mellitus, were found among the IDH sessions. Patients in the IDH sessions were prescribed fewer anti-hypertensive drugs than those in the non-IDH sessions.
Comparison of baseline characteristics between IDH and non-IDH sessions.
| IDH (n = 50 884) | Non-IDH (n = 892 336) | P-value | |
|---|---|---|---|
| Age (years) | 60.28 ± 12.47 | 60.14 ± 13.17 | .20 |
| Male, n (%) | 18 384 (36.13) | 471 440 (52.83) | .00 |
| BMI (kg/m2) | 23.25 ± 3.86 | 23.05 ± 3.77 | .00 |
| Dialysis vintage (years) | 6.00 (3.00–10.00) | 4.00 (2.00–8.00) | .00 |
| Setting of blood flow rate (mL/min) | 250.00 (250.00–300.00) | 250.00 (250.00–300.00) | .00 |
| Pre-dialysis SBP (mmHg) | 137.27 ± 29.72 | 142.22 ± 22.36 | .00 |
| Pre-dialysis DBP (mmHg) | 71.80 ± 15.98 | 75.72 ± 14.35 | .00 |
| Pre-dialysis PR (b.p.m.) | 77.55 ± 13.02 | 73.36 ± 12.35 | .00 |
| Last session mean SBP (mmHg) | 119.14 ± 20.58 | 137.09 ± 18.60 | .00 |
| Last session mean DBP (mmHg) | 65.92 ± 12.28 | 74.31 ± 12.45 | .00 |
| Last session mean PR (b.p.m.) | 79.26 ± 12.38 | 73.78 ± 11.92 | .00 |
| UF target rate (mL/kg/h) | 12.68 (9.66–15.86) | 9.91 (6.77–13.33) | .00 |
| Interdialytic weight gain (%) | 4.65 ± 1.88 | 3.92 ± 1.91 | .00 |
| Dialysate, n (%) | |||
| Glucose dialysate | 25 387 (49.89) | 398 227 (44.63) | .00 |
| Glucose-free dialysate | 14 853 (29.19) | 359 722 (40.31) | .00 |
| Low calcium dialysate | 9881 (19.42) | 126 031 (14.12) | .00 |
| Others | 763 (1.50) | 8356 (0.94) | .00 |
| Vascular access, n (%) | |||
| Arteriovenous fistula | 39 687 (78.00) | 718 662 (80.54) | .00 |
| Arteriovenous graft | 8075 (15.87) | 117 035(13.12) | .00 |
| Catheter | 3122 (6.14) | 56 634 (6.35) | .06 |
| Dialyzer surface area (m2) , n (%) | |||
| 1.4 | 8697 (17.09) | 143 424(16.07) | .00 |
| 1.7 | 18 951 (37.24) | 388 586 (43.55) | .00 |
| 1.8 | 17 568 (34.53) | 265 007 (29.70) | .00 |
| 2.0 | 3496 (6.87) | 69 312 (7.77) | .00 |
| 2.1 | 2167 (4.26) | 25 954 (2.91) | .00 |
| 2.3 | 5 (0.01) | 53 (0.01) | .43 |
| Dialysis mode, n (%) | |||
| HD | 45 159 (88.75) | 837 029 (93.80) | .00 |
| HDF | 5725 (11.25) | 55 307 (6.20) | .00 |
| Anticoagulation, n (%) | |||
| Heparin | 50 859 (99.95) | 891 796 (99.94) | .35 |
| Nafamostat | 25 (0.05) | 535 (0.06) | .38 |
| None | 5 (0.00) | .65 | |
| Comorbidities, n (%) | |||
| Ischemic heart disease | 13 177 (25.90) | 207 721 (23.28) | .00 |
| Valvular heart disease | 1422 (2.79) | 17 290 (1.94) | .00 |
| Arrhythmia | 5030 (9.89) | 75 786 (8.49) | .00 |
| Liver disease | 1376 (2.70) | 15 046 (1.69) | .00 |
| COPD | 3655 (7.18) | 60 130 (6.74) | .00 |
| Diabetes mellitus | 17 965 (35.31) | 232 648 (26.07) | .00 |
| Prescriptions, n (%) | |||
| Calcium channel blocker | 15 726 (30.91) | 503 442 (56.42) | .00 |
| Alpha blocker | 1645 (3.23) | 76 711 (8.60) | .00 |
| Beta blocker | 14 119 (27.75) | 343 145 (38.45) | .00 |
| Angiotensin blocker | 17 163 (33.73) | 467 331 (52.37) | .00 |
| Calcium-based phosphate binder | 29 768 (58.50) | 519 571 (58.23) | .22 |
| Number of anti-hypertensive drugs, n (%) | |||
| 0 | 24 426 (48.00) | 241 081 (27.02) | .00 |
| 1 | 26 184 (51.46) | 632 335 (70.86) | .00 |
| 2 | 88 (0.17) | 6767 (0.76) | .00 |
| 3 | 182 (0.36) | 11 791 (1.32) | .00 |
| 4 | 4 (0.01) | 354 (0.04) | .00 |
| 5 | 0 (0.00) | 0 (0.00) | |
| 6 | 0 (0.00) | 8 (0.00) | .91 |
| Lab findings | |||
| Hemoglobin (g/dL) | 10.98 ± 1.34 | 10.71 ± 1.26 | .00 |
| Glucose (mg/dL) | 119.00 (91.00–170.00) | 111.00 (89.00–152.00) | .00 |
| Albumin (g/dL) | 3.85 ± 0.43 | 3.87 ± 0.42 | .00 |
| Sodium (mmol/L) | 137.64 ± 3.30 | 138.38 ± 3.27 | .00 |
| Calcium (mg/dL) | 9.13 ± 0.89 | 9.00 ± 0.84 | .00 |
| Phosphorus (mg/dL) | 5.04 ± 1.83 | 4.69 ± 1.67 | .00 |
| Intact PTH (pg/mL) | 133.10 (56.10–276.00) | 122.11 (53.00–230.80) | .00 |
| Ferritin (ng/mL) | 261.09 (136.00–449.83) | 251.10 (138.00–429.30) | .00 |
| IDH in previous session, n (%) | 18 119 (35.61) | 32 646 (3.66) | .00 |
Continuous variables are presented as mean ± standard deviation or median (25th percentile–75th percentile). Categorical variables are presented as count and proportion (%).
HDF, hemodiafiltration; COPD, chronic obstructive lung disease.
Performance comparison between prediction models
All classifiers’ prediction performance measures are presented in Table 3, and the predicted results for each threshold value maximizing F1 score are shown in confusion matrices (Supplementary data, Fig. S3). Using the test dataset, the AUROC for predicting IDH was highest in the three-timeframe deep learning model, followed by one-timeframe deep learning model, XGBoost and logistic regression. The AUPRCs for prediction IDH were highest in three-timeframe deep learning model, followed by XGBoost, RF, one-timeframe deep learning model and logistic regression. Since our data were imbalanced, we used MCC and macro F1 score to consider both positive and negative predictions in evaluating predictive performance. MCC was highest in the three-timeframe deep learning model, followed by XGBoost, logistic regression and one-timeframe deep learning model. Similarly, the macro F1 score was highest in the three-timeframe deep learning model.
Performance metrics for IDH prediction models.
| Logistic regression | RF | XGBoost | Deep learning (1 timeframe) | Deep learning (3 timeframes) | |
|---|---|---|---|---|---|
| Accuracy | 0.93 (0.92–0.93) | 0.93 (0.93–0.94) | 0.93 (0.93–0.93) | 0.93 (0.93–0.94) | 0.93 (0.93–0.93) |
| Recall | 0.45 (0.41–0.48) | 0.43 (0.39–0.46) | 0.48 (0.44–0.51) | 0.42 (0.38–0.45) | 0.55 (0.52–0.58) |
| Precision | 0.39 (0.36–0.43) | 0.40 (0.37–0.44) | 0.41 (0.38–0.45) | 0.40 (0.37–0.44) | 0.41 (0.38–0.44) |
| Macro F1 score | 0.69 (0.68–0.71) | 0.69 (0.67–0.71) | 0.70 (0.69–0.72) | 0.69 (0.67–0.70) | 0.72 (0.70–0.73) |
| AUPRC | 0.35 (0.32–0.392) | 0.36 (0.33–0.40) | 0.41 (0.38–0.45) | 0.35 (0.32–0.39) | 0.44 (0.40–0.48) |
| AUROC | 0.85 (0.84–0.87) | 0.86 (0.85–0.87) | 0.87 (0.86–0.89) | 0.87 (0.85–0.88) | 0.90 (0.89–0.91) |
| Specificity | 0.96 (0.95–0.96) | 0.96 (0.96–0.96) | 0.96 (0.96–0.96) | 0.96 (0.96–0.96) | 0.95 (0.95–0.96) |
| NPV | 0.97 (0.96–0.97) | 0.97 (0.96–0.97) | 0.97 (0.96–0.97) | 0.96 (0.96–0.97) | 0.97 (0.97–0.97) |
| MCC | 0.38 (0.35–0.41) | 0.38 (0.35–0.41) | 0.41 (0.38–0.44) | 0.37 (0.34–0.40) | 0.44 (0.41–0.47) |
macro F1 score, macro-averaged F1 score.
Feature importance score and ranking in predicting IDH
Feature importance analysis using logistic regression, RF, XGBoost and the two constructed deep learning models was performed to estimate the contribution of each feature in predicting the occurrence of IDH. Figure 3 shows feature ranking plots in decreasing order of Shapley values. The common top-ranked features in machine learning models were: mean SBP, DBP or PR of the previous session; UF target rate; pre-dialysis SBP or DBP; use of calcium channel blockers; IDH experience in the previous session; and sex (male). The deep learning model using current HD session (one timeframe) data showed similar results. The deep learning model using data from the past three sessions (three timeframes) demonstrated that vital signs during the session before the last session also contributed significantly to IDH prediction. The full feature importance scores and plots are shown in Supplementary data, Fig. S4 and Table S1.
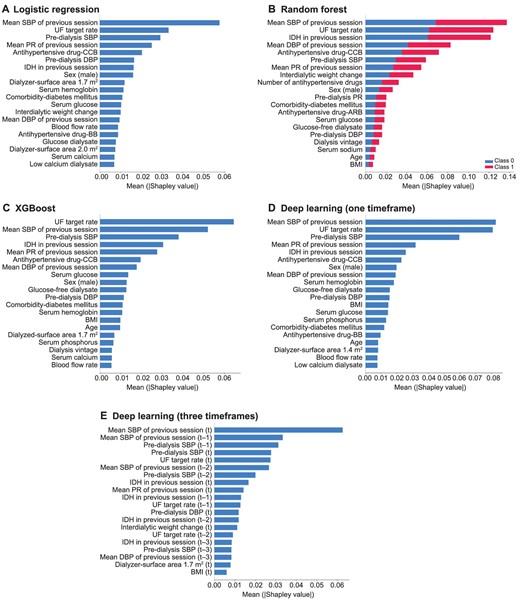
Feature importance using Shapley additive explanation for the models to predict intradialytic hypotension. (A) Logistic regression, (B) RF, (C) XGBoost, (D) deep learning (one timeframe) and (E) deep learning (three timeframes). Features were sorted in descending order of Shapley values. Note, (t) is the current session and (t-n) is n past sessions. CCB, calcium channel blocker; BB, beta blocker; BMI, body mass index.
DISCUSSION
In this study, we found the important features predicting occurrence of IDH and demonstrated that AI models based on those pre-dialysis features could estimate the risk of IDH occurrence accurately. The feature importance analysis demonstrated that the mean BP during the previous HD session, UF target rate, pre-dialysis BP and IDH occurrence during the previous session contributes most significantly to the prediction of IDH. Although these parameters have been empirically expected and are relatively well known as risk factors of IDH by clinicians in the real world, there is no exact prediction tool with risk stratification. Therefore, the present AI model is suitable to use to calculate the actual risk in real-world HD treatments.
We used enormous medical data resources spanning >10 years directly extracted from the EMR systems of seven independent hospitals to create a dataset to train and validate the AI model. Using our CDW system, it was possible to access high-quality clinical patient information and link to multiple operational data sources [23, 24]. Although the number of current medical records was large in volume for handling—clinical data of 2007 patients who underwent a total of 943 220 sessions—we could refine the HD-related resource based on our well-established CDW system. Also, the seven hospitals included herein employ a uniform EMR system with the same format for entry of HD-related information [25], ensuring credibility and consistency in the data quality. Therefore, our refined data were optimized for AI model development with a relatively small number of data errors or missing levels by validating the consistency of information.
Our next concern was defining significant IDH. There is no consensus on the definition of IDH, so various definitions have been used across studies. For example, IDH was defined in one study based on an SBP decrease during HD with the need for intervention, including saline loading and others [1, 9], while another study defined it as a decrease in either SBP of ≥20 mmHg or mean arterial pressure of ≥10 mmHg as well as symptoms of cramping, headache, lightheadedness, vomiting or chest pain during HD [26]. However, these definitions are insufficient in terms of long-term prognosis prediction. Flythe et al. demonstrated that the nadir-based definitions of IDH best capture the association between IDH and mortality. They studied an association of mortality risk with various definitions of IDH and found that an absolute nadir intradialytic SBP <90 mmHg (Nadir90) and Nadir100 were most potently associated with mortality [1]. Therefore, we used the nadir-based criteria for IDH definition. The frequency of IDH in our cohort based on this definition was 5.39%, which is a lower value than that in previous reports [27]. We assumed this discrepancy exists because clinicians tend to prevent IDH in advance, relying on their empirical risk assessment in real-world practice.
Based on the preprocessed big data, we developed an IDH prediction AI model. To compare prediction performance, we also trained standard machine learning models of logistic regression, RF and XGBoost. Prior studies on AI prediction models for IDH mostly focused on positive prediction [16]. Our deep learning model also demonstrated good AUROC and AUPRC values of 0.87 and 0.35, respectively. However, since the frequency of IDH occurrence is about only 5%, suggesting a very imbalanced dataset, use of both positive and negative predictions is more appropriate to evaluate predictive performance. As precision and recall are in a trade-off relationship, we chose the F1 score in order to maximize both precision and recall. In this regard, we used MCC and macro F1 score, which are employed to effectively evaluate AI model performance in imbalanced data, and these values were 0.37 (95% CI 0.34–0.40) and 0.69 (95% CI 0.67–0.70), respectively, in our final deep learning model. This MCC performance in our study was higher than that in previous reports [28]. Higher values of MCC and macro F1 score mean that the model effectively predicts not only IDH occurrence, but also the absence of IDH. To help clinicians focus on high-risk patients, both positive and negative predictions are important in screening tests.
Even though the performance of this deep learning model was superior to previously reported results, the model showed similar prediction performance to those of other standard machine learning models in this study when using only one-timeframe data. In this regard, we expanded medical resources into previous sessions to implement the best predictive performance. Among diverse deep learning algorithms, we applied 1D-CNN to construct our prediction model. This type of neural network is efficient at extracting features from neighboring information [29], which is appropriate to explain the complex relationship between the predictors to estimate IDH occurrence. In addition, longer interdialytic period sessions during thrice-weekly dialysis are associated with greater interdialytic weight gain and higher IDH risk [30]. Therefore, it is reasonable to refer the most recent three sessions, which involve all types of interdialytic intervals during 1 week, for better prediction performance. With this idea, we combined clinical data from three past sessions and created a deep learning model to achieve the best predictive performance, with MCC value of 0.44 from 0.37, and macro F1 score of 0.72 from 0.69.
Previous AI models found that the mean SBP and DBP values during previous sessions were most highly correlated with SBP [15], and a previous IDH history imparts a high feature ranking score [16]. Our feature importance analysis also showed that the mean SBP during the previous session and recent IDH history are highly correlated with IDH risk. In the developed IDH prediction models, our feature importance analysis showed that UF target rate, which closely relates to interdialytic weight gain, and pre-dialysis SBP are common important features, as expected [31]. Moreover, our results suggest that use of calcium channel blocker is an important risk factor for IDH. Theoretically, anti-hypertensive drugs, which are known to improve left ventricular hypertrophy and impaired left ventricular relaxation, might be expected to reduce IDH, while drugs with vasodilatory effects might increase the frequency of IDH. However, there is a lack of evidence supporting the use of any particular anti-hypertensive mediation to influence IDH risk [32–34]. Future research is needed to uncover any existing association between certain anti-hypertensive drug classes and IDH risk.
In order to effectively prevent IDH, the integration of our deep learning model with an AI-biofeedback system is crucial. To this end, we propose a “preemptive IDH intervention bundle” as part of this biofeedback system, which includes pre-lowering the patient's target UF, more frequent blood pressure monitoring, reducing the dialysate temperature and extending the dialysis session time for the day, among other measures. If this intervention bundle can be seamlessly integrated with our deep learning model, we believe that we can achieve proficient prevention of IDH in clinical settings. Therefore, we are planning a prospective study to demonstrate the efficacy of our AI-biofeedback systems, which will compare the incidence rate of IDH between two groups. One group will receive preemptive IDH intervention bundle guided by our AI model, while the other group receive preventive interventions without our AI model.
Our study had several limitations. First, unidentified features in this study, such as cardiac function, dialysate sodium concentration and dialysate temperature, may provide additional information to help discern the risk of IDH and further improve the model performance [31]. To overcome this limitation, we trained AI models with data on comorbidities, including ischemic heart disease, valvular heart disease and arrhythmia, using International Classification of Diseases, 10th revision codes. Second, dialysis records were filled in manually, resulting in many typos or outliers and missing data. We preprocessed the data for the longest duration of time to date during this study, double-checking the database and correcting typos. However, this problem could be solved by linking dialysis records automatically to EMR systems as performed in recent practice. The third limitation is the lack of intra-dialytic data, which makes it difficult to accurately predict when IDH will occur during a dialysis session. Furthermore, the major important features of our AI model are the risk factors that are already known in experienced dialysis units. However, we are confident that our AI model will provide significant assistance to less experienced HD staff to prevent IDH.
In conclusion, we generated a deep learning–based AI model with information of three past HD sessions, and it showed accurate predictive performance for both the occurrence and absence of IDH. We expect that this deep learning model would be a reliable and easy screening tool for IDH. Hence, it could allow clinicians to identify vulnerable patients and adjust HD settings before HD treatment.
ACKNOWLEDGEMENTS
We especially thank PYEONGHWA IS Co. for their help in performing this research.
FUNDING
This study was supported by a grant from the Korean Nephrology Research Foundation (K-NRF-FMC research fund 2021) and by research fund of Seoul St Mary's hospital, The Catholic University of Korea.
AUTHORS’ CONTRIBUTIONS
H.L., E.S.K. and B.H.C. designed the study. H.L., J.W.M., H.S.P., H.E.Y., Y.S.K., H.W.K., C.W.Y., S.C. and B.H.C carried out data acquisition. H.L., S.J.M., S.W.K., E.S.K. and B.H.C. analyzed and interpreted the data. H.L. drafted the manuscript. E.S.K. and B.H.C. supervised the study. All authors approved the final manuscript and agreed to submit this work to this journal.
DATA AVAILABILITY STATEMENT
The data underlying this article will be shared on reasonable request to the corresponding author.
CONFLICT OF INTEREST STATEMENT
All the authors have declared no competing interest.
REFERENCES
Author notes
These authors contributed equally to this work as corresponding authors.


Comments