


ABSTRACT
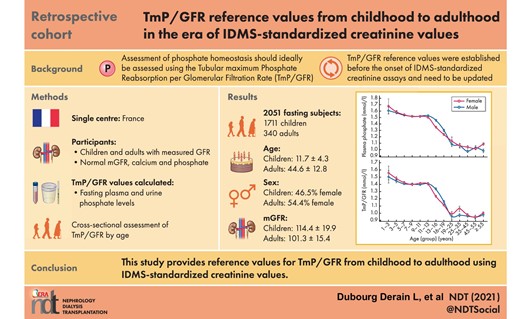
The assessment of phosphate homeostasis in clinical practice relies not only on circulating phosphate levels but also on phosphate tubular reabsorption, ideally assessed using the tubular maximum phosphate reabsorption per glomerular filtration rate (TmP/GFR). TmP/GFR reference values were established before the onset of isotope-dilution mass spectrometry-standardized (IDMS) creatinine assays and thus need to be updated. Our objective is to provide reference values for TmP/GFR from childhood to adulthood, using the gold-standard of GFR assessment and IDMS-standardized creatinine values.
We retrospectively analysed all the inulin and iohexol clearances [measured glomerular filtration rate (mGFR)] performed in children and in adults screened for a living-donation in our unit since the beginning of IDMS-creatinine assays. TmP/GFR was calculated on a fasting sample, using the conventional formula without correction for tubular reabsorption of phosphate (TRP) in subjects below 19 years of age.
A total of 2051 subjects (1711 children, 340 adults), aged from 1.9 to 73.4 years with normal GFR, normal phosphate and normal calcium levels, were included for TmP/GFR analysis. As expected, there was a progressive decrease along puberty in both genders of plasma phosphate and TmP/GFR, the decrease occurring earlier in girls. After the age of 19 years, there was a stabilization of plasma phosphate and TmP/GFR levels until the age of 55 years, phosphate levels and TmP/GFR being slightly lower in men than in women.
We present the largest cohort describing TmP/GFR reference values in the era of IDMS-standardized creatinine assays. We believe that these data will help physicians to better diagnose and manage patients with abnormal phosphate metabolism in daily clinical routine.
INTRODUCTION
Phosphate is a cornerstone of several physiologic pathways such as skeletal development, bone mineralization, membrane composition, nucleotide structure, maintenance of plasma pH and cellular signalling. Phosphate is mainly stored in bone, but the kidneys have a key role in phosphate homeostasis, via its proximal reabsorption occurring at the apical membrane mainly through the sodium/phosphate cotransporters (Npt2a and Npt2c, encoded by the SLC34A1 and SLC34A3 genes, respectively). Two hormones play important roles in renal phosphate handling, e.g. parathyroid hormone (PTH) and fibroblast growth factor 23 (FGF23). Both hormones have hypophosphatemic effects by inhibiting Npt2, with opposite effects on the regulation of 1,25 dihydroxyvitamin D (1-25-D), the third main regulator of phosphate metabolism that stimulates phosphate intestinal absorption [1].
Phosphate homeostasis is tightly regulated and the knowledge of its underlying mechanisms has been substantially improved by the description of ‘novel’ genetic diseases over the last decades. Genetic diseases may indeed affect the FGF23 pathway, resulting in either increased FGF23 levels leading to hypophosphatemia [X-linked hypophosphatemia (XLH) and other hypophosphataemic rickets due to mutations in the FGF23 gene or its regulators] or defective secretion/action of intact FGF23 inducing hyperphosphatemia (familial tumoral calcinosis with hyperphosphatemia) [1]. Alternatively, mutations in SLC34A1 and SLC34A3 may induce hypercalciuria due to increased 1-25-D levels as a result of a compensatory mechanism to avoid hypophosphatemia because of the renal leak [2]. In these conditions, it is essential to have an accurate assessment of phosphate homeostasis to guide both genetic testing and therapeutic monitoring. For example, in case of burosumab therapy in a patient with XLH [3], it may be interesting to adapt burosumab doses not only on phosphate and alkaline phosphatase levels, but also on TmP/GFR evolution [4].
Phosphate homeostasis assessment in clinical practice relies on circulating phosphate levels but also on phosphate tubular reabsorption, ideally assessed using the tubular maximum phosphate reabsorption per glomerular filtration rate (TmP/GFR). Indeed, the ‘simple’ phosphate reabsorption rate [tubular reabsorption of phosphate (TRP)] largely depends on phosphate intake and age (because of the age-dependent normal phosphate levels) and is not accurate enough: it may be decreased to compensate high phosphate intake in a subject with normal phosphate levels, and in such a case a decreased TRP would be ‘normally abnormal’. To reflect more precisely tubular reabsorption, it is therefore recommended to use TmP/GFR, which represents the maximum renal capacity to reabsorb phosphate per unit volume of glomerular filtration rate and corresponds to the theoretical lower limit of serum phosphate below which all filtered phosphate is reabsorbed (renal threshold phosphate concentration). Bijvoet demonstrated that the tubular threshold value is equivalent to TmP/GFR [1]. Although it has been superseded for this purpose by the measurement of PTH, it is still clinically useful. TmP/GFR was traditionally measured by loading the patient with phosphate, either orally or intravenously, and collecting blood samples and timed urine specimens. The ‘Bijvoet nomogram’ was initially developed to help to distinguish hypercalcemia due to hyperparathyroidism from other causes of hypercalcemia [5], and a more simple formula was validated thereafter [6]. Kenny and Glen adapted this formula in adults when TRP is above 85% [7]. However, Brodehl et al. demonstrated that the correction was not required in children [8].
A few papers proposed reference values for TmP/GFR across age groups [9–13], but they were established before the onset of isotope-dilution mass spectrometry-standardized (IDMS)-creatinine assays and thus need to be updated with these modifications in assays and laboratory standards. Thus, our objective is to provide reference values for TmP/GFR from childhood to adulthood, using the gold-standard of GFR assessment (i.e. iohexol clearance) to adequately select controls and IDMS-standardized creatinine values.
MATERIALS AND METHODS
We retrospectively analysed all the inulin and iohexol clearances [measured glomerular filtration rate (mGFR)] performed in children in our unit since the beginning of IDMS-creatinine assays, as well as the clearances performed in adults screened for a living donation to be able to select patients without chronic kidney disease. Inulin-based and iohexol-based GFR measurement were performed as previously described in overnight fasting subjects [14, 15].
The study considered 3874 children referred to our Unit between July 2003 and September 2020 for GFR measurement for suspected or established renal dysfunction, renal risk or after kidney transplantation, as well as 494 adults screened before kidney donation. We progressively excluded the following subjects (so as to consider only subjects with normal phosphate/calcium): (i) subjects with an abnormal renal function (i.e. <90 mL/min/1.73 m2 for subjects aged ≤40 years and <80 mL/min/1.73 m2 for subjects aged over 40 years) [16], (ii) subjects with abnormal plasma total calcium concentration (i.e. <2.1 and ≥2.8 mmol/L) and (iii) subjects with abnormal plasma phosphate levels for age, using the Caliper database in children and normal local reference values in adults [17]. Therefore, from the initial 4368 renal explorations, we included 2051 subjects (1711 children and 340 adults), as illustrated in the flowchart presented in Figure 1.
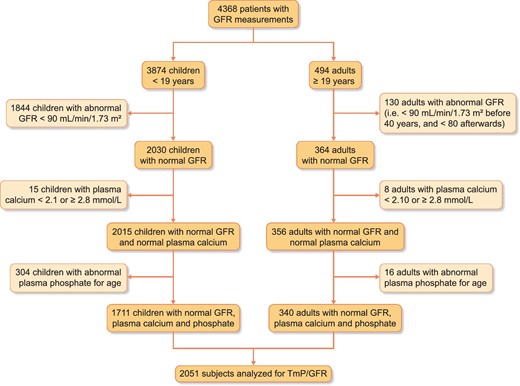
Flow-chart of the study.
Subjects’ medical records were extracted for demographic and clinical information (age, gender, body weight, height, GFR indication, etc.). All procedures were carried out in accordance with the ethical standards of the institution, the 2013 Helsinki Declaration and its later amendments, or with comparable ethical standards, for single-centre retrospective studies. This retrospective study was approved by the local institutional review board (Comité d’ Ethique des Hospices Civils de Lyon, 21_407, session 28 May 2021). The data that support the findings of this study are available from the corresponding author upon reasonable request.
All plasma creatinine measurements were performed with methods traceable to the National Institute of Standards and Technology (isotope-dilution mass spectrometry-calibrated). From October 2003 to June 2010, plasma and urine creatinine was obtained by a kinetic colorimetric compensated Jaffé technique (Roche Modular, Meylan, France, the results of which were standardized by linear regression adjustment versus the concentrations obtained by liquid chromatography mass spectrometry. The calibration equation was: standardized plasma creatinine = 0.9395 × Jaffé compensated serum creatinine in µmol/L + 4.6964. The coefficient of correlation was 0.97. From June 2010, all plasma and urine creatinine values were obtained by an enzymatic technique (Architect c®, Abbott Diagnostics) traceable to the National Institute of Standards and Technology (NIST SRM 967 and NIST SRM 914). According to the Kidney Disease: Improving Global Outcomes, the two techniques are relatively similar [16]. Plasma creatinine was expressed in µmol/L.
Pi concentration in serum and urine were determined by routine laboratory measurements (UV-spectrophotometry analysis based on determination of phosphomolybdate complex) traceable to the National Institute of Standards and Technology (NIST SRM 2186-I). TmP/GFR was calculated as Pp − [Pu × Cp/Cu], where Pp is plasma phosphate, Pu urinary phosphate, Cp plasma creatinine and Cu urinary creatinine [7]. We did not correct TmP/GFR in children. However, when TRP was above 85%, Tmp/GFR was corrected as follows: TmP/GFR = a × Pp, when a = 0.3 × TRP/[1 − (0.8 × TRP)], and TRP = 1 − [(Pu × Cp)/(Pp × Cu)].
Statistical analyses were performed with SPSS. Descriptive data are presented as mean ± standard deviation (SD) (min–max) or number (percentages). Multi-comparisons were assessed using one-way analysis of variance for continuous and normally distributed variables with post-hoc testing (Fisher's test). Significance was established as P < 0.05.
RESULTS
We included a total of 2051 fasting subjects (1711 children and 340 adults) for TmP/GFR analysis (Figure 1). Their main characteristics are summarized in Table 1. In adults, after the age of 21 years, all evaluated subjects were healthy candidates for living-related kidney donation. As living donation is not performed with paediatric donors, the children included in the analysis were children with a potential ‘renal risk’. As such, they were referred for renal function determination because of follow-up of renal disease, such as congenital abnormality of the kidney and urinary tract (24%), liver transplantation (29%), cardiac or pulmonary transplantation (4%), renal transplantation (10%), medullary transplantation (3%), renal evaluation before organ transplantation (16%) or miscellaneous indications (14%).
Characteristics of subjects
| Children (N = 1711) | Adults (N = 340) | |
|---|---|---|
| Age (years) | 11.7 ± 4.3 | 44.6 ± 12.8 |
| Gender (female, %) | 796 (46.5) | 185 (54.4) |
| Weight (kg) | 40.2 ± 17.6 | 70.0 ± 14.0 |
| Height (cm) | 143.6 ± 2.4 | 167.4 ± 9.8 |
| BMI (kg/m2) | 18.4 ± 3.6 | 24.9 ± 4.2 |
| mGFR (mL/min/1.73 m2) | 114.4 ± 19.9 | 101.3 ± 15.4 |
| Plasma creatinine (µmol/L) | 47.2 ± 14.7 | 66.3 ± 12.7 |
| Plasma calcium (mmol/L) | 2.39 ± 0.10 | 2.29 ± 0.10 |
| Plasma phosphate (mmol/L) | 1.45 ± 0.19 | 1.04 ± 0.16 |
| SDS for age for plasma phosphate | −0.55 ± 0.82 | −0.87 ± 1.17 |
| Phosphate reabsorption rate (%) | 91.7 ± 4.2 | 89.3 ± 4.4 |
| TmP/GFR (mmol/L) | 1.33 ± 0.20 | 0.98 ± 0.14 |
Results are presented as mean ± SD or number (percentage)
Figure 2 illustrates the evolution of phosphate levels and TmP/GFR from childhood to adulthood in both genders, and Table 2 precisely details these numbers. Briefly, as expected, there is a progressive decrease along puberty in both genders of plasma phosphate and TmP/GFR, the decrease occurring earlier in girls. After the age of 19 years, there is a stabilization of plasma phosphate and TmP/GFR levels until the age of 55 years, phosphate levels and TmP/GFR being slightly lower (however without statistical significance) in men than in women. We did not observe significant differences between the different age groups in women.
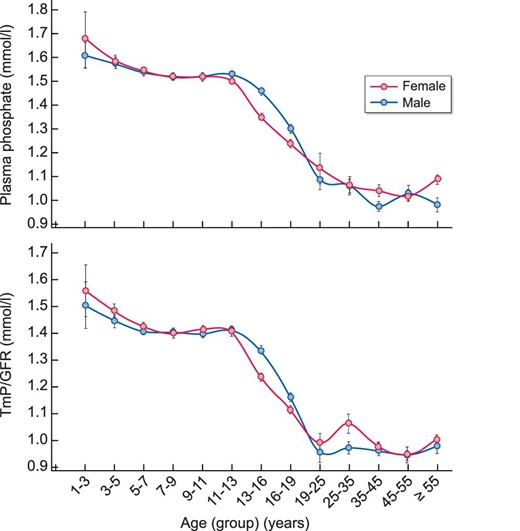
Evolution of plasma phosphate and TmP/GFR levels depending on age and gender. Results are presented as mean ± SEM for each gender and age group.
Phosphate levels and TmP/GFR across age groups and gender
| Age group (years) | Reference values for plasma phosphate (mmol/L) | N | Measured plasma phosphate (mmol/L) | Calculated TmP/GFR (mmol/L) | ||||
|---|---|---|---|---|---|---|---|---|
| 1–<3 | 1.38–2.19 | 11 | 1.63 (1.31–1.96) | 1.53 (1.13–1.92) | ||||
| 3–<5 | 1.38–2.19 | 74 | 1.58 (1.34–1.83) | 1.47 (1.19–1.74) | ||||
| 5–<7 | 1.33–1.92 | 231 | 1.54 (1.28–1.80) (b) | 1.42 (1.13–1.7) (a, b) | ||||
| 7–<9 | 1.33–1.92 | 226 | 1.52 (1.27–1.77) (a, b) | 1.40 (1.11–1.69) (a, b) | ||||
| 9–<11 | 1.33–1.92 | 202 | 1.52 (1.28–1.76) (a, b) | 1.41 (1.14–1.67) (a, b) | ||||
| 11–<13 | 1.33–1.92 | 220 | 1.52 (1.28–1.76) (a, b) | 1.41 (1.14–1.68) (a, b) | ||||
| Females | Males | Females | Males | Females | Males | Females | Males | |
| 13–<16 | 1.02–1.79 | 1.14–1.99 | 210 | 199 | 1.35 (1.00–1.70) (a, b, c, d, e, f) | 1.46 (1.12–1.80) (a, b, c, d, e, f, g, h, i, j, k, l, m) | 1.24 (0.87–1.60) (a, b, c, d, e, f) | 1.34 (0.98–1.69) (a, b, c, d, e, f, g, h, i, j, k, l, m) |
| 16–<19 | 0.95–1.62 | 0.95–1.62 | 146 | 192 | 1.24 (0.89–1.58) (a, b, c, d, e, f, g) | 1.30 (0.86–1.74) (a, b, c, d, e, f, g, h, i, j, k, l, m, n) | 1.12 (0.77–1.46) (a, b, c, d, e, f, g) | 1.16 (0.71–1.61) (a, b, c, d, e, f, g, h, i, j, k, l, m, n) |
| 19–<25 | 0.74–1.52 | 0.74–1.52 | 11 | 20 | 1.13 (0.73–1.54) (a, b, c, d, e, f, g, h) | 1.09 (0.73–1.44) (a, b, c, d, e, f, g, h, n, o) | 0.99 (0.77–1.21) (a, b, c, d, e, f, g, h) | 0.96 (0.61–1.31) (a, b, c, d, e, f, g, h, j, n, o) |
| 25–<35 | 0.74–1.52 | 0.74–1.52 | 23 | 26 | 1.06 (0.73–1.40) (a, b, c, d, e, f, g, h) | 1.06 (0.77–1.35) (a, b, c, d, e, f, g, h, n, o) | 1.06 (0.74–1.39) (a, b, c, d, e, f, g) | 0.97 (0.71–1.23) (a, b, c, d, e, f, g, h, j, n, o) |
| 35–<45 | 0.74–1.52 | 0.74–1.52 | 49 | 47 | 1.04 (0.75–1.33) (a, b, c, d, e, f, g, h) | 0.98 (0.7–1.25) (a, b, c, d, e, f, g, h, i, j, k, m, n, o, p, q) | 0.98 (0.73–1.22) (a, b, c, d, e, f, g, k, j) | 0.96 (0.66–1.27) (a, b, c, d, e, f, g, h, j, n, o) |
| 45–<55 | 0.74–1.52 | 0.74–1.52 | 50 | 33 | 1.02 (0.69–1.35) (a, b, c, d, e, f, g, h, i) | 1.03 (0.71–1.35) (a, b, c, d, e, f, g, h, n, o, p) | 0.94 (0.70–1.19) (a, b, c, d, e, f, g, h, j) | 0.95 (0.65–1.24) (a, b, c, d, e, f, g, h, j, n, o) |
| ≥55 | 0.74–1.52 | 0.74–1.52 | 52 | 29 | 1.09 (0.83–1.34) (a, b, c, d, e, f, g, h, l) | 0.98 (0.71–1.25) (a, b, c, d, e, f, g, h, i, m, n, o) | 1.00 (0.72–1.29) (a, b, c, d, e, f, g, h) | 0.98 (0.70–1.25) (a, b, c, d, e, f, g, h, n, o) |
Before 13 years of age, reference data and results are presented for both genders together. Results are presented as mean (±1.96 SD) and reference values are presented as (min–max). Before 19 years, reference values provided by the Caliper database, and after 19 years local reference values provided by Abott. P < 0.05 (a: ≠ age group 1–<3; b: ≠ age group 3–<5; c: ≠ age group 5–<7; d: ≠ age group 7–<9; e: ≠ age group 9–<11; f: ≠ age group 11–<13; g: ≠ age group females 13–<16; h: ≠ group females 16–<19; i: ≠ group females 19–<25; j: ≠ group females 25–<35; k: ≠ group females 35–<45; l: ≠ group females 45–<55; m: ≠ group females ≥ 55; n: ≠ group males 13–<16; o: ≠ group males 16–<19; p: ≠ group males 19–<25; q: ≠ group males 25–<35).
DISCUSSION
We here present the evolution of TmP/GFR depending on age and gender in a cohort of 2051 subjects aged from 1.9 to 73.4 years with normal GFR, normal phosphate and normal calcium levels, in which GFR was measured with the gold standard and creatinine with an international IDMS-standardized assay. The objective of this study was to provide reference values for TmP/GFR in subjects with normal renal function: this is the reason why we used the gold standard iohexol and inulin clearances to exclude subjects. In daily life, this is obviously not doable, and the fact that only estimated GFR are available does not preclude the routine use of these data. To the best of our knowledge, this is the largest study presenting reference values for TmP/GFR with IDMS-standardized creatinine, which is of crucial importance since creatinine is part of the TmP/GFR calculation.
As stated above, the recent improvement in knowledge of phosphate disorders on one hand and the onset of new biotherapies targeting phosphate metabolism on the other reinforces the need for an accurate evaluation of phosphate metabolism and notably of renal tubular reabsorption. With these new reference values covering both genders from early childhood to adulthood, we believe that we provide here a useful daily tool for physicians.
As already stated by Payne even though TmP/GFR is independent of the two main factors affecting plasma phosphate concentrations (namely the rate of phosphate flow into the extra cellular space coming from gut, cells and bone, as well as GFR), ideally, samples should be taken in a fasting steady state because of the circadian changes in plasma and urine phosphate and because urinary and plasma phosphate may change after meals [9]. As such, we also obtained here data from fasting subjects, and it should be performed likewise in clinical practice.
Another important point to discuss in daily practice is the absence of correction for TRP in children, as already proposed by Brodehl, Kruse and Shaw [8, 12, 18]. As detailed in the legend of Table 2 and in the Materials and methods, we did not correct TmP/GFR on TRP in children below 19 years of age. In adults, because of the non-linear increase in phosphate reabsorption to its maximum (apparent ‘phosphate splay’), the formula TmP/GFR should be corrected when TRP is greater than 80%. Both Stark and Brodehl showed that children do not display the ‘phosphate splay’ found in fasting adults [8, 19]: as such, the use of the nomogram of Bijvoet or the correction in children result in overestimation of TmP/GFR in children and teenagers.
Based on previous publications on TmP/GFR, we confirm the global evolution of phosphate and TmP/GFR with age and gender. However, a few manuscripts have reported a significant decline of phosphate and TmP/GFR with age in men [11, 13, 20]; here, we do not observe such a trend but we do not have older subjects because of the inclusion criteria, namely candidates for living kidney donation. In Cirillo et al.'s paper, 2107 men and 2560 women from 18 to 97 years of age were included, unfortunately without IDMS-standardized creatinine assays [13]. These authors have also observed a transient increase of phosphate levels during climacterics in women [13], probably secondary to the close correlation between phosphate metabolism and sex hormones. Indeed, a correlation between estrogen therapy and phosphate tubular reabsorption has been described, women receiving hormone replacement therapy or gonadotropin-releasing hormone agonists displaying significant decreased and increased TmP/GFR at 6 months, respectively [21]. An association between estradiol levels and TmP/GFR was also reported [21]. Here, we did not observe significant differences between the different age groups in women, even though a ‘peak’ of phosphate and TmP/GFR seems to appear in women between 25 and 35 years of age, however of limited amplitude. We may hypothesize the role of hormonal contraception in this age group, but unfortunately, we do not have these data. One may also argue that despite its global size, the number of subjects per subgroup is quite low, especially in adults. Last, as compared with a recent paper evaluating TmP/GFR in a cohort of 165 living kidney donors, it is noteworthy that we obtained similar TmP/GFR results whilst our subjects were younger and with a lower mGFR (51 ± 10 years and 118 ± 26 mL/min /1.73 m2, respectively, in Van Londen et al.'s series) [22]. It is nevertheless difficult to formally compare all previously papers on the topic since the age ranges were not uniform on one hand and since they were published before the IDMS-standardized creatinine assays on the other. In this study, we increase the number of evaluated subjects, especially in the paediatric age groups. However, in adults, whilst Cirillo and colleagues found similar results to ours [13], in contrast Payne obtained higher values for TmP/GFR [9], which may indeed greatly impact the interpretation of TmP/GFR in daily routine.
We present here the largest cohort describing TmP/GFR reference values in the era of IDMS-standardized creatinine assays. This study, despite its obvious strengths, also has limitations that need to be acknowledged. Indeed, it is almost impossible in 2021 to include healthy children for invasive renal explorations; as such, children included in this study underwent inulin or iohexol assessment because of a disease inducing a peculiar ‘renal risk’. However, since we excluded for further analysis all subjects with abnormal renal function, calcium and phosphate levels, we consider that these children are good candidates for establishing TmP/GFR reference values. The use of calcineurin inhibitors, especially after renal transplantation, may under estimate the lower normal level we propose here, but we believe these patients with normal GFR, normal calcium and phosphate levels can nevertheless be considered as control subjects. Indeed, Tmp/GFR should be used in daily practice only in patients with overt hypophosphatemia, and we excluded this profile. Also, we have previously published reference data depending on gender and pubertal stage in a cohort of 100 healthy teenagers aged from 10 to 18 years of age, which provided similar results and thus reinforce the results obtained in the current study [23]. Conversely, we only included adults evaluated for living kidney donation, also excluding subjects with abnormal renal function, calcium and phosphate levels.
CONCLUSION
In conclusion, we provide reference values for TmP/GFR from childhood to adulthood, in both genders, using IDMS-standardized creatinine values, in a cohort of 2051 subjects with normal GFR, normal phosphate and normal calcium levels. We believe that these data will help physicians to better diagnose and manage patients with abnormal phosphate metabolism in daily clinical routine.
FUNDING
None to disclose in association with this manuscript.
AUTHORS’ CONTRIBUTIONS
J.B. and L.D.D. designed the study. L.D.D. performed the statistical analyses and wrote the first version of the manuscript. L.C. performed biochemical analyses, S.F. was in charge of administrative and ethical arrangements, S.L. and M.A. analysed data and reviewed the manuscript, and J.B. analysed data, wrote the first version of the manuscript and prepared the final draft.
CONFLICT OF INTEREST STATEMENT
J.B. received speaker and consulting fees from Bayer, Amgen and Kyowa Kirin in the field of phosphate metabolism. There are no other conflicts of interest to disclose.


Comments