


Abstract
Health-related quality of life (HRQOL) is becoming an increasingly important outcome in kidney transplantation (KT). To describe HRQOL in kidney transplant recipients (KTRs), this systematic review summarizes literature that compared HRQOL among KTRs and other relevant populations [i.e. patients receiving dialysis, patients on the waiting list (WL) for KT, patients with chronic kidney disease (CKD) not receiving renal replacement therapy (RRT), the general population (GP) and healthy controls (HCs)] and themselves before KT.
The literature search was conducted in PubMed, Embase, Web of Science and the Cochrane Library. Eligible studies published between January 2000 and October 2020 were included.
Forty-four studies comprising 6929 KTRs were included in this systematic review. Despite the study heterogeneity, KTRs reported a higher HRQOL after KT compared with pre-transplantation and compared with patients receiving dialysis with or without being on the WL, especially in disease-specific domains (i.e. burden and effects of kidney disease). Additionally, KTRs had similar to marginally higher HRQOL compared with patients with CKD Stages 3–5 not receiving RRT. When compared with HCs or the GP, KTRs reported similar HRQOL in the first 1 or 2 years after KT and lower physical HRQOL and lower to comparable mental HRQOL in studies with longer post-transplant time.
The available evidence suggests that HRQOL improves after KT and can be restored to but not always maintained at pre-CKD HRQOL levels. Future studies investigating intervention targets to improve or maintain post-transplant HRQOL are needed.
INTRODUCTION
Kidney transplantation (KT) is the preferred and cost-effective treatment for patients with end-stage kidney disease (ESKD) compared with long-term dialysis [1, 2]. Over the past decades, post-transplant graft and patient survival have improved considerably due to the availability of upgraded surgical techniques and innovative immunosuppressants [3]. The reported 5-year graft and patient survival rate of kidney transplant recipients (KTRs) exceeded 80% across different countries [3, 4]. However, KTRs often experience a considerable number of potential side effects (e.g. cardiovascular disease, osteoporosis, neurotoxicity, infections and weight gain) due to the chronic immunosuppressive treatment required to maintain normal graft function [5]. Such treatment-related side effects, along with the underlying kidney disease and other comorbidities, are believed to negatively influence post-transplant health-related quality of life (HRQOL) [6]. In recent years, different international workgroups have recognized HRQOL as a valuable patient-centred outcome to assess treatment effects and healthcare quality in KT [7–9]. Therefore, knowledge of HRQOL after KT compared with other related conditions (e.g. dialysis) is also necessary to inform shared decision-making between patients with ESKD and healthcare professionals.
The most recent systematic review fulfilling this purpose compared HRQOL across different renal replacement therapies [RRTs; i.e. KT, haemodialysis (HD) and peritoneal dialysis (PD)] and showed better HRQOL in KTRs [10]. However, it only included articles published before 2005 and compared generic HRQOL measured by the 36-item Short-Form Health Survey (SF-36). With the considerable improvements in nephrology care and the exponential increase in studies focusing on HRQOL (and other related patient-reported outcomes), an updated overview of the current literature was urgently needed. Moreover, to gain a comprehensive picture of HRQOL in KTRs it is necessary to shed light on disease-specific HRQOL and HRQOL measured with other (non-SF-36) questionnaires and to include relevant comparison groups such as the general population (GP) and healthy controls (HCs) to better understand the extent to which HRQOL can be restored to a ‘pre-chronic kidney disease (CKD)’ level.
In this systematic review we describe and summarize the published literature to date that compares HRQOL after KT with that of all other relevant populations [i.e. patients receiving dialysis, patients on the waiting list (WL) for KT, patients with CKD not receiving RRT, the GP and HCs] and themselves before KT.
MATERIALS AND METHODS
This systematic review was conducted and reported following the Preferred Reporting Items for Systematic Reviews and Meta-Analyses (PRISMA) guidelines [11]. The protocol for this systematic review is registered on the International Prospective Register of Systematic Reviews (PROSPERO; registration number: CRD42021223864).
Eligibility criteria
The eligibility criteria for inclusion in this review were KTRs >18 years of age at the time of transplantation with a single-organ KT; HRQOL as one of the outcomes; HRQOL in KTRs compared with that in the same cohort before KT, patients receiving dialysis, patients on the WL for KT, patients with CKD not receiving RRT, the GP and HCs via observational studies or randomized controlled trials; and original articles published between 1 January 2000 and 19 October 2020 in the English language.
Information sources and searching strategy
The literature research was conducted on 19 October 2020 using the Medical Subject Headings (MESH) keywords ‘kidney transplantation’ and ‘HRQOL’ (Supplementary data, Table S1) on PubMed (MEDLINE) to identify relevant studies, followed by a manual search in Embase, Web of Science and the Cochrane Library. Bibliographies of the included articles were also screened for studies missed by the searching strategy (Figure 1).
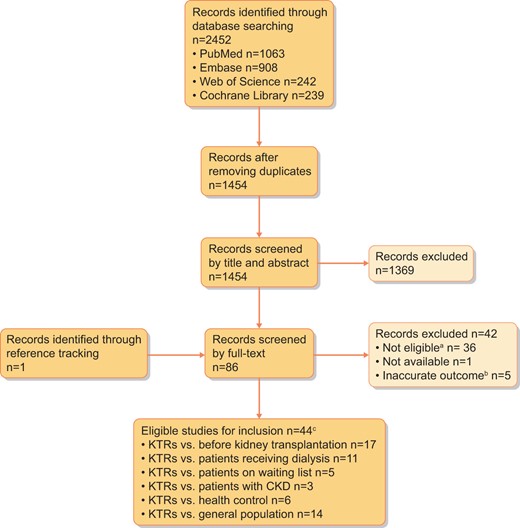
Study inclusion and exclusion flowchart. aInclusion criteria for full-text screening: subjects received single-organ transplantation in adults, disease-specific and/or generic HRQOL was measured post-transplantation and post-transplant HRQOL was compared with that of other populations, including the GP, HCs, patients with CKD not receiving RRT, patients on the WL and patients receiving dialysis. bInaccurate outcome: HRQOL scores higher than the maximum possible value, total HRQOL scores from a questionnaire that does not support such total score calculation or a higher HRQOL score as an indication for a worse HRQOL while the scoring algorithm hints the opposite (i.e. better HRQOL). cTen studies conducted more than one comparison.
Selection of articles
The screening of titles and abstracts for relevant articles was conducted by one researcher (Y.W.). Next, full texts of potentially relevant studies were screened by the main reviewer (Y.W.) in collaboration with a nephrologist (J.D.S.) and a medical psychologist (Y.M.). During the selection process, each article was marked as ‘inclusion’, ‘exclusion’ or ‘not sure’ based on pre-specified inclusion criteria. Any article marked ‘not sure’ was discussed among the reviewers to achieve consensus based on the pre-specified criteria. Articles not meeting the aforementioned eligibility criteria were excluded. Articles with poor accuracy of the outcome measurement [i.e. HRQOL scores higher than the maximum possible value, total HRQOL scores from a questionnaire that does not support such total score calculation or a higher HRQOL score as an indication for a worse HRQOL while the scoring algorithm hints the opposite (i.e. better HRQOL)] and unavailable full-text versions were excluded (Figure 1).
Extracted data items
Data extraction of pre-specified items was conducted by Y.W. and checked for accuracy by Y.M. Extracted data included demographic and clinical characteristics of the study population (age, sex, time after transplantation for KTRs and percentage of living donor KT in KTRs), characteristics of the study [country where a study was conducted, study design, sample size, patient type (i.e. incident and prevalent), follow-up period, loss to follow-up (LOF) rate, response rate (RR) and statistical methods] and characteristics of the outcome (the questionnaire used to measure HRQOL, HRQOL scores and the statistical significance of the results).
Study quality assessment and data synthesis
Following the PRISMA guidelines, the quality of the included studies was assessed using the National Institutes of Health Quality Assessment Tools for Observational Cohort and Cross-sectional Studies and Before–After Studies With No Control Group [12]. Studies were not excluded based on the quality assessment. A meta-analysis was not conducted due to the heterogeneity of the study population (i.e. prevalent and incident), questionnaires used to measure HRQOL, scoring algorithms to calculate HRQOL with the same questionnaire and inconsistent reporting of domain scores and summary scores. Therefore data were summarized narratively without pooled estimates for the outcome of interest.
RESULTS
Searching result
We identified 1454 unique records with the pre-specified searching strategy, of which 86 full-text articles were screened. Finally, 44 original studies were selected for this review (Figure 1) [13–56]. The sample sizes of KTRs in the included studies ranged from 15 to 1658 and the studies were conducted in 23 different countries, with Europe (45%) being the most common continent on which included studies were conducted. The characteristics of each study are presented in Table 1.
Characteristics of the included studies (N = 44)
| References | Year | Country | Study type | KTR, n | Comparison N group | LOF, % | RR, % | Questionnaire | ||
|---|---|---|---|---|---|---|---|---|---|---|
| Disease- specific | Generic | |||||||||
| Griva et al. [57] | 2012 | UK | R | 60 | Before KT | – | – | 98 | – | SF-36 |
| Das et al. [14] | 2014 | India | C (S) | 20 | Before KT | – | 0 | 100 | – | WHOQOL |
| Junchotikul et al. [15] | 2015 | Thailand | R (S) | 232 | Before KT | – | 0 | – | – | WHOQOL |
| Shrestha et al. [16] | 2010 | UK | C (S) | 58 | Before KT | – | – | 77 | KTQ | SF-36 |
| HC | 38 | – | 32 | |||||||
| Lopes et al. [17] | 2013 | Portugal | P | 35 | Before KT | – | – | – | – | SF-36 |
| Mendonca et al. [18] | 2014 | Brazil | P (S) | 63 | Before KT | – | 0 | – | – | WHOQOL |
| Virzi et al. [19] | 2007 | Italy | P | 48 | Before KT | – | – | 100 | – | SF-36 |
| Balaska et al. [20] | 2006 | Grace | R (S) | 85 | Before KT | – | 0 | 100 | – | SF-36 |
| Russcher et al. [21] | 2015 | Netherlands | P (S) | 23 | Before KT | – | 18 | – | – | SF-36 |
| Painter et al. [22] | 2012 | USA | p | 20 | Before KT | – | 31 | – | KDQOL | SF-36 |
| Mousavi-Roknabadi et al. [23] | 2019 | Iran | P (S) | 120 | Before KT | – | 0 | – | – | SF-36 |
| Gil et al. [24] | 2020 | Brazil | P (S) | 40 | Before KT | – | 7.5 | – | KRQOL | – |
| Purnajo et al. [25] | 2019 | USA | R | 831 | Before KT | – | – | – | – | SF-36 |
| Mitsui et al. [26] | 2020 | Japan | R (S) | 32 | Before KT | – | 13 | – | – | SF-36 |
| von der Lippe et al. [27] | 2014 | Norway | p | 110 | Before KT | – | 0 | – | KDQOL | – |
| Norwegian GP | 5903 | – | ||||||||
| Lonning et al. [28] | 2018 | Norway | P (S) | 120 | Before KT | – | 1 | 87–90 | KDQOL | – |
| Norwegian GP | – | – | – | – | ||||||
| Lumsdaine et al. [29] | 2005 | UK | P (S) | 35 | Before KT | – | – | 72 | – | WHOQOL |
| UK GP | – | |||||||||
| Ranabhat et al. [30] | 2020 | Nepal | C | 92 | HD (WL?) | 69 | – | 89 | – | WHOQOL |
| Tomasz and Piotr [31] | Poland | C | 83 | HD (WL?) | 61 | – | 36 | – | WHOQOL | |
| Fujisawa et al. [32] | 2000 | Japan | C (S) | 117 | HD & WL | 49 | – | 96 | – | SF-36 |
| HD not on WL | 65 | – | – | – | – | |||||
| Sayin et al. [33] | 2007 | Turkey | C | 20 | HD (WL?) | 75 | – | 100 | – | SF-36 |
| PD (WL?) | 41 | – | – | – | ||||||
| Tamura et al. [34] | 2018 | Japan | C (S) | 68 | HD (WL?) | 165 | – | – | – | SF36 |
| Rambod et al. [35] | 2011 | Iran | C | 200 | HD (WL?) | 200 | – | 100 | – | QLI-DT |
| Sapkota et al. [36] | 2013 | Nepal | C | 57 | HD (WL?) | 62 | – | – | – | WHOQOL |
| Czyzewski et al. [37] | 2014 | Poland | P | 120 | HD (WL?) | 50 | – | – | KDQOL | SF-36 |
| PD (WL?) | 30 | – | – | – | – | |||||
| Zheng et al. [38] | 2014 | China | C (S) | 124 | HD (WL?) | 100 | – | 73 | – | SF-36 |
| Rosenberger et al. [41] | 2010 | Slovak | P | 87 | WL | 93 | 1 | 69–89 | – | SF-36 |
| Kovacs et al. [42] | 2011 | Hungary | C | 888 | WL | 187 | – | 84 | KDQOL | – |
| Franke et al. [43] | 2000 | Germany | R (S) | 149 | WL | 149 | – | 80–90 | – | MLDL |
| HC | 149 | – | – | – | ||||||
| Neipp et al. [44] | 2006 | USA | R (S) | 139 | WL | 57 | – | – | – | |
| US GP | – | – | 81 | KTQ | SF-36 | |||||
| Karine et al. [39] | 2020 | France | C | 1658 | CKD 3b | 1487 | – | 84–100 | – | SF-36 |
| CKD 4 | 1206 | – | – | – | – | |||||
| HD & PD (WL?) | 1251 | – | – | – | – | |||||
| French GP | 20574 | – | – | – | – | |||||
| Iqbal et al. [40] | 2020 | Bangladesh | C (S) | 15 | CKD patients | 28 | – | – | KDQOL | – |
| HD (WL?) | 20 | – | – | – | – | |||||
| HC | 40 | – | – | – | – | |||||
| Stomer et al. [48] | 2013 | Norway | C (S) | 38 | CKD patients | 30 | – | 59 | – | SF-36; VAS |
| Norwegian GP | – | – | – | |||||||
| Ay et al. [45] | 2015 | Turkey | P (S) | 47 | HC | 47 | 0 | 100 | – | SF-36 |
| Taskintuna et al. [46] | 2009 | Turkey | C | 69 | HC | 45 | – | – | – | SF-36 |
| Yagil et al. [47] | 2018 | Israel | C (S) | 45 | HC | 45 | – | 98 | – | SF-12 |
| Zhao et al. [49] | 2018 | China | C (S) | 253 | Chinese GP | – | – | – | – | SF-36 |
| Cornella et al. [50] | 2008 | Italy | C (S) | 52 | Italian GP | 52 | – | 91 | – | SF-36 |
| Aasebo et al. [51] | 2009 | Norway | C | 131 | Norwegian GP | – | – | 47 | – | SF-36 |
| Karam et al. [52] | 2003 | France | C | 229 | French GP | 487 | – | 85 | – | NIDDK-QOL |
| Liu et al. [53] | 2015 | China | C | 204 | Chinese GP | – | – | 100 | – | SF-36 |
| Esposito et al. [54] | 2017 | USA | C | 132 | US GP | – | – | 80 | – | SF-36 |
| Wei et al. [55] | 2013 | Taiwan | C (S) | 88 | Taiwanese GP | – | – | 63 | – | SF-36 |
| Costa-Requena et al. [56] | 2017 | Spain | P (S) | 124 | Spanish GP | – | – | 68–85 | KDQOL | – |
‘WL?’ indicates unknown WL status. ‘–’ indicates NA or NR. C, cross-sectional study; KTQ, Kidney Transplant Questionnaire; MLDL, Munich Life Quality Dimension List; NIDDK-QOL, National Institute of Diabetes and Digestive and Kidney Diseases Liver Transplant Database Quality of Life Questionnaire; P, prospective study; QLI-DT, Quality and Life Index Questionnaire Dialysis and Transplantation; R, retrospective study; S, single centre.
KTRs studied
The mean age of KTRs at the time of HRQOL measurement ranged from 29 to 72 years and only two studies were conducted in an elderly cohort >60 years of age (n = 43). The majority of studies (93%) reported a higher percentage of male KTRs [median 62% (range 43–86); n = 43]. The average time of HRQOL measurements after KT ranged from 1 to 234 months after the operation (median 12 months; n = 35). Twenty-three studies reported the donor type for KT and the percentage of living donor KTs (LDKTs) ranged from 3.3% to 100% (median 100%). Data on comorbidities, dialysis vintage and primary kidney disease were infrequently reported and could therefore not be systematically collected within this review. All characteristics of KTRs are presented in Tables 2–4.
HRQOL before and after KT (N = 17)
| References | Patient characteristics | Effect measure | HRQOL using SF-36 and KDQOL | HRQOL using WHOQOL | |||||||||||||||||||||
|---|---|---|---|---|---|---|---|---|---|---|---|---|---|---|---|---|---|---|---|---|---|---|---|---|---|
| Physical | Mental | Disease-specific | |||||||||||||||||||||||
| Mean age (years) | Male, % | LDKT, % | RRT before KT, % | Time after KT (minutes) | PCS | PF | RP | BP | GH | MCS | VT | SF | RE | MH | S | EKD | BKD | PHY | PSY | SOC | ENV | Total | |||
| Mousavi- Roknabadi et al. [23] | 39 | 65 | 37 | – | 3 | Mean rank (after/ before) | – | 55/50e | 40/27e | 48/47e | 65/13e | – | 56/24e | 49/54e | 47/26e | 54/30e | – | – | – | – | – | – | – | – | |
| Russcher et al. [21] | 51 | 64 | 100 | 36 | 3 | Mean change | – | 6 | 24b | 0 | 15b | – | 18b | 16b | 10 | 2 | – | – | – | – | – | – | – | – | |
| Gil et al. [24] | 36 | 65 | 100 | – | 3 | Mean (after/before) | 52/43b | 93/75b | 81/35b | 92/85 | 78/60b | 56/46b | 74/58b | 92/64b | 93/58b | 86/70b | - | 78/41b | - | – | – | – | – | – | |
| 6 | 51/43b | 94/75b | 70/35b | 80/82 | 70/60b | 53/46b | 76/58b | 80/64b | 79/58b | 85/70b | – | – | – | – | – | ||||||||||
| Virzi et al. [19] | 41a | 58 | 100 | 92 | 6 | Mean (after/before) | 77/72 | 58/38e | 21/32c | 78/70c | 63/56c | 62/49c | - | 77/60c | - | 74/41b | - | – | – | – | – | – | |||
| Griva et al. [57] | 43 | 54 | 3 | 100 | 6 | Cohen's d | 1.3 | 1.2 | 0.5 | 0.5 | 1.6 | 0.8 | 0.7 | 1.0 | 0.6 | 0.7 | – | – | – | – | – | ||||
| Painter et al. [22] | 44 | 85 | 100 | – | 6 | Mean change | 7b | 7b | 11b | 3b | 5b | 2 | 7b | 15b | 3 | 0 | 9b | 19b | 24b | – | – | – | – | – | |
| Lopes et al. [17] | 37a | 63 | 100 | – | 12 | Median (after/ before) | 100/70b | 100/25b | 100/72b | 72/40b | – | 80/55b | 100/62b | 100/100b | 84/68b | – | – | – | – | – | – | – | – | ||
| Mitsui et al. [26] | 44a | 86 | 100 | 38 | 3 | % > MCID (PEKT/ non-PEKT) | 40/40 | 40/45 | 80/60 | 20/35 | 70/60 | 55/60 | 55/70 | 70/65 | 35/30 | 60/60 | – | – | – | – | – | – | – | – | |
| 12 | 50/33 | 33/50 | 33/25 | 25/25 | 83/92 | 58/75 | 67/83 | 67/58 | 33/33 | 50/42 | – | – | – | – | – | – | – | – | |||||||
| Balaska et al. [20] | 44a | 52 | 54 | 100 | 12 | Mean (after/before) | – | 77/56 | 62/10c | 90/46 | 84/34d | – | 83/26c | 78/31 | 83/40c | 68/23 | – | – | – | – | – | – | – | – | |
| Purnajo et al. [25] | 48 | 67 | 34 | - | 12 | % > MCID | – | 37 | 58 | 39 | 39 | – | 42 | 41 | 44 | 23 | – | – | – | – | – | – | – | – | |
| Lonning et al. [28] | 72 | 71 | 21 | 90 | 2 | Mean difference (SD) | – | <0.5 | <0.5 | <0.5 | >0.5 | – | >0.5 | <0.5 | <0.5 | <0.5 | <0.5 | >0.5 | <0.5 | – | – | – | – | – | |
| 6 | – | <0.5 | <0.5 | <0.5 | >0.5 | – | >0.5 | <0.5 | <0.5 | <0.5 | >0.5 | >0.5 | <0.5 | – | – | – | – | – | |||||||
| 12 | – | <0.5 | >0.5 | <0.5 | >0.5 | – | >0.5 | <0.5 | <0.5 | <0.5 | >0.5 | >0.5 | <0.5 | – | – | – | – | – | |||||||
| von der Lippe et al. [27] | 57 | 66 | – | 100 | 40 | Mean differenceb | – | <0.5 | <0.5 | <0.5 | <0.5 | – | <0.5 | <0.5 | <0.5 | >0.5b | <0.5 | >0.5d | >0.5d | – | – | – | – | – | |
| Shrestha et al. [16] | 39a | 53 | 100 | – | 46 | Mean (after/before) | 65/35c | 71/48c | 65/17c | 72/59 | 54/22c | 69/39c | 63/30c | 77/43c | 76/44c | 79/59c | – | – | – | – | – | – | – | – | |
| Das et al. [14] | 60%: 30–45g | 80 | 100 | – | 6 | Mean (after/before) | – | – | – | – | – | – | – | – | – | – | – | – | – | 76/47c | 84/47c | 77/62c | 74/55c | – | |
| Lumsdaine et al. [29] | 37a | 51 | 100 | – | 1.5 | Mean (after/before) | – | – | – | – | – | – | – | – | – | – | – | – | – | 15/11f | 16/15 | 16/16 | 17/16 | – | |
| 12 | – | – | – | – | – | – | – | – | – | – | – | – | – | 16/11f | 16/15 | 16/16 | 16/16 | – | |||||||
| Junchotikul et al. [15] | 88%: 33–60g | 62 | – | – | – | Mean difference | – | – | – | – | – | – | – | – | – | – | – | – | – | - | - | - | - | 29c | |
| Mendonca et al. [18] | 39 | 62 | – | 97 | – | Mean (after/before) | – | – | – | – | – | – | – | – | – | – | – | – | – | 17/10c | 18/13c | 17/13c | 14/12c | 18/9c | |
Continuous variables are presented as the mean if not otherwise indicated. HRQOL results are presented in bold if they were reportedly significant according to statistical testing (P < 0.05) or a threshold for mean difference (difference > 0.5 SD or Cohen’s d > 0) or the percentages of patients who reported an improvement larger than MCID >50%.
–, not reported; ENV, environmental; MCID, minimal clinically important difference; MCS, mental component summary; PCS, physical component summary; PHY, physical; PSY, psychological; S, symptom; SOC, social.
Values presented as median.
P < 0.05.
P < 0.01.
P < 0.001.
P < 0.0001.
Statistical test conducted for comparison at three time points (before KT, 1.5 and 12 months after KT) and P < 0.05.
Percentage within the indicated range.
HRQOL of KTRs compared with patients on dialysis (n = 11), patients on the WL (n = 5) and patients with CKD not receiving RRT (n = 3)
| References | Patient characteristics | Effect measure | HRQOL using SF-36 and KDQOL | HRQOL using WHOQOL or QLI-DT | |||||||||||||||||||||||
|---|---|---|---|---|---|---|---|---|---|---|---|---|---|---|---|---|---|---|---|---|---|---|---|---|---|---|---|
| KTRs | Patients on dialysis/with CKD | Physical | Mental | Disease-specific | |||||||||||||||||||||||
| Mean age (years) | Male, % | LDKT, % | Time after KT (minutes) | Mean age (years) | Male, % | RRT | Time on dialysis (months) | PCS | PF | RP | BP | GH | MCS | VT | SF | RE | MH | S | EKD | BKD | PHY | PSY | SOC | ENV/FAM | Total | ||
| KTRs versus patients on dialysis | |||||||||||||||||||||||||||
| Czyzewski et al. [37] | – | 55 | – | 3 | – | 58 | HD | 78 | Mean (KT/D) | 45/35b | 72/50b | 42/30 | 78/46 | 45/28 | 45/44 | 58/49 | 70/59 | 65/47 | 64/61 | 85/66b | 76/54b | 48/30b | |||||
| – | 50 | PD | 40 | 45/38b | 72/52b | 42/36 | 78/66 | 45/42 | 45/50 | 58/68 | 70/74 | 65/74 | 64/50 | 85/74b | 77/65b | 48/54b | |||||||||||
| 12 | – | 58 | HD | 78 | 46/35b | 76/50b | 50/30 | 67/46 | 44/28b | 44/44 | 56/49b | 70/59 | 65/48 | 63/61 | 83/66b | 78/54b | 56/30b | ||||||||||
| – | 50 | PD | 40 | 46/38b | 76/52b | 50/36 | 67/66 | 44/42 | 44/50 | 56/68 | 70/74 | 65/74 | 63/50 | 83/74 | 79/65 | 53/54b | |||||||||||
| Sayin et al. [33] | 33 | 65 | 70 | 41 | 47 | 72 | HD | 46 | Mean (KT/D) | 69/56 | 43/41 | 64/63 | 50/40 | 68/56g | 58/63 | 46/30 | 66/58 | ||||||||||
| 46 | 61 | PD | 35 | 69/56 | 43/39 | 64/66 | 50/41 | 68/52g | 58/56 | 46/46 | 66/61 | ||||||||||||||||
| Zheng et al. [38] | 34 | 78 | 100 | 39a | – | – | HD | >3 | Mean (KT/D) | 80/68d | 74/35d | 72/62d | 67/40d | 64/46d | 75/55d | 77/42d | 72/59d | ||||||||||
| Tamura et al. [34] | 52 | 60 | 100 | 47a | 53 | 48 | HD | – | Mean (KT/D) | 47/23c | 46/20c | 49/43c | 45/40c | 51/41c | 49/38c | 48/35c | 52/49c | ||||||||||
| Fujisawa et al. [32] | 44 | 43 | 74 | 126 | 46 | 69 | HD | 92 | Mean (KT/D) | 86/82 | 78/64b | 80/67b | 56/52 | 63/58 | 82/74b | 78/70 | 70/69 | ||||||||||
| Karine et al. [39] | 55 | 61 | – | – | 69 | 65 | D | >12 | Mean (KT/D) | 45/35d | 46/40d | ||||||||||||||||
| Iqbal et al. [40] | 39 | – | – | >6 | 43 | – | HD | >3 | Mean (KT/D) | 91/37f | 30/0f | 69/30f | 48/21f | – | 66/40f | 70/24f | 33/0f | 56/41f | |||||||||
| Ranabhat et al. [30] | 39 | 75 | – | >6 | 44 | 75 | HD | >3 | Mean (KT/D) | 13/11d | 14/11d | 14/13b | 12/11c | 13/11d | |||||||||||||
| Sapkota et al. [36] | 41 | 70 | – | 72%: 3–24h | 46 | 68 | HD | 76%: 3–24h | Mean (KT/D) | 70/49d | 69/52d | 69/58d | 60/56d | 267/215d | |||||||||||||
| Tomasz and Piotr [31] | 43 | 52 | – | 35 | 58 | 61 | HD | 41 | Mean (KT/D) | 14/12e | 14/13 | 14/13e | 13/13 | 14/12e | |||||||||||||
| Rambod et al. [35] | 51 | 56 | – | >3 | 50 | 48 | HD | >3 | Mean (KT/D) | 21/19d | 18/21 | 19/18 | 24/25b | 21/20b | |||||||||||||
| KTRs versus patients on dialysis and on the WL | |||||||||||||||||||||||||||
| Rosenberger et al. [41] | 47 | 56 | – | 3 | 49 | 58 | D | 42 | Mean (KT/WL) | 52/48 | 60/57 | ||||||||||||||||
| 12 | 54/50 | 63/62 | |||||||||||||||||||||||||
| Kovacs et al. [42] | 49 | 58 | – | 54 | 49 | 60 | D | 36 | Beta- coeeficient | 0.01 | – | – | 0.16d | 0.03 | – | – | −0.001 | 0.04 | 0.22d | 0.18c | |||||||
| Fujisawa, et al. [32] | 44 | 43 | 74 | 126 | 46 | 76 | HD | 120 | Mean (KT/WL) | 86/82 | 78/74 | 80/74 | 56/50b | 63/61 | 82/75 | 78/80 | 70/68 | ||||||||||
| Franke et al. [43] | 48 | 62 | – | 56 | 48 | 62 | D | 65 | Mean (KT/WL) | 7/5b | 6/5b | 7/6b | 7/6 | 7/6b | |||||||||||||
| Neipp et al. [44] | 55 | 63 | – | 234 | 43a | 72 | – | – | Mean (KT/WL) | 6/5f | 5/4f | 5/4f | 6/6 | 5/5 | |||||||||||||
| KTRs versus patients with CKD not receiving RRT | |||||||||||||||||||||||||||
| Iqbal et al. [40] | 39 | – | – | >6 | 49 | – | CKD 3–5 | Mean (KT/WL) | 91/69f | – | 49/44f | 48/31f | 66/51f | – | – | – | |||||||||||
| Karine et al. [39] | 55 | 61 | – | – | 66 | 68 | CKD 3b | Mean (KT/WL) | 45/43f | 46/48f | |||||||||||||||||
| 68 | 63 | CKD 4–5 | 45/40f | 46/47f | |||||||||||||||||||||||
| Stomer et al. [48] | 56 | 61 | – | 169 | 57 | 61 | CKD 3b–4 | Mean (KT/CKD) | 43/43 | 50/52 | |||||||||||||||||
Continuous variables are presented as the mean if not otherwise indicated. HRQOL results are presented in bold if they were reportedly significant according to statistical testing (P < 0.05). –, not reported; D, dialysis; S, symptom. aValues presented as median. bP < 0.05. cP < 0.01. dP < 0.001. eP < 0.0001. fP-value not reported. gStatistical test conducted for comparison across more than two groups (KTRs, HD and PD) and P < 0.05. hPercentage within the indicated range.
HRQOL of KTRs compared with HCs (n = 6) and the GP (n = 14)
| References | Patient characteristics | Effect measure | HRQOL using SF-36 | HRQOL using WHOQOL | |||||||||||||||||||||
|---|---|---|---|---|---|---|---|---|---|---|---|---|---|---|---|---|---|---|---|---|---|---|---|---|---|
| KTRs | HC and the GP | Physical | Mental | ||||||||||||||||||||||
| Mean age (years) | Male, % | LDKT, % | Time after KT (minutes) | Mean age (years) | Male, % | PCS | PF | RP | BP | GH | MCS | VT | SF | RE | MH | PHY | PSY | SOC | ENV | Total | |||||
| KTRs versus HCs | |||||||||||||||||||||||||
| Ay et al. [45] | 32 | 60 | 100 | 3 | 38 | 51 | Mean (KT/HC) | 46/48 | 72/80b | 52/74c | 68/67 | 57/62 | 44/45 | 63/64 | 66/70b | 50/66 | 64/64 | ||||||||
| 9 | 46/48 | 78/80 | 51/74c | 70/67 | 58/62 | 44/45 | 61/64 | 67/70 | 56/66 | 63/64 | |||||||||||||||
| Shrestha, et al. [16] | 39a | 53 | 100 | 46a | 55a | 34 | Mean (KT/HC) | 65/81d | 71/84b | 65/92d | 72/84b | 54/73d | 69/78 | 63/69 | 77/81 | 76/90 | 79/77 | ||||||||
| Taskintuna et al. [46] | 33 | 74 | 100 | 39 | Matched | 80 | Mean (KT/HC) | 73/92b | 54/84d | 69/82c | 53/67c | 63/56 | 70/69 | 51/67 | 64/60 | ||||||||||
| Yagil et al. [47] | 53 | 62 | – | 64 | Matched | Matched | Mean (KT/HC) | 52/88b | 45/82b | 60/80b | 54/68b | 44/62b | 69/83b | 55/90b | 61/74b | ||||||||||
| Iqbal et al. [40] | 39 | – | – | >6 | 34 | – | Mean (KT/HC) | 91/100 | 30/100 | 69/94 | 48/85 | 66/91 | 70/99 | 33/100 | 56/94 | ||||||||||
| Franke et al. [43] | 48 | 62 | – | 56 | Matched | Matched | Mean (KT/HC) | 7/7 | 7/6 | 6/6 | 7/7 | 7/7 | |||||||||||||
| KTRs versus GP from the same country or region | |||||||||||||||||||||||||
| Cost-Requena a et al. [56] | 53 | 68 | 19 | 1 | – | – | Mean difference (SD) | >0.5 | >0.5 | >0.5 | >0.5 | <0.5 | <0.5 | >0.5 | >0.5 | <0.5 | <0.5 | ||||||||
| 6/12/18 | <0.5 | <0.5 | <0.5 | <0.5 | <0.5 | <0.5 | <0.5 | <0.5 | <0.5 | <0.5 | |||||||||||||||
| 24 | >0.5 | <0.5 | <0.5 | >0.5 | >0.5 | <0.5 | <0.5 | <0.5 | <0.5 | <0.5 | |||||||||||||||
| Lonning et al. [28] | 72 | 71 | 21 | 12 | Matched | Male | Mean difference (SD) | <0.5 | <0.5 | <0.5 | <0.5 | <0.5 | >0.5 | <0.5 | <0.5 | ||||||||||
| Female | <0.5 | <0.5 | <0.5 | <0.5 | <0.5 | <0.5 | <0.5 | <0.5 | |||||||||||||||||
| Zhao et al. [49] | 77%: 18–44g | 72 | – | 62%: 6–12g | – | – | Mean (KT/GP) | 82/91e | 46/80e | 68/86e | 59/70e | 64/70e | 87/87e | 51/76e | 62/73e | ||||||||||
| Liu et al. [53] | 43 | 62 | 15 | 39 | – | – | Mean (KT/GP) | 80/91e | 63/80e | 71/86e | 52/70e | 66/70e | 71/87e | 72/76e | 73/73 | ||||||||||
| Lippe, et al. [27] | 57 | 66 | – | 40 | Matched | Matched | Mean (KT/GP) | 44/50d | 73/82d | 52/75d | 71/73 | 57/74d | 48/53b | 54/61d | 81/88b | 71/85d | 78/82 | ||||||||
| Cornella et al. [50] | 67 | 64 | – | 41 | Matched | Male | Mean (KT/GP) | 82/84 | – | 18/74b | 37/62b | – | 50/68b | 47/78b | 76/74 | 65/69 | |||||||||
| Female | 63/64 | – | 22/59b | 40/49b | 47/52 | 42/71b | 74/68 | 59/57 | |||||||||||||||||
| Aasebo et al. [51] | 29 | 44 | 66 | 59a | – | – | Mean (KT/GP) | 49/53d | 87/94d | 74/90d | 76/80 | 60/81d | 49/52d | 56/61d | 80/89d | 76/90d | 77/80c | ||||||||
| Esposito et al. [54] | 52 | 59 | – | 6 | – | – | Mean (KT/GP) | 41/50b | 49/50 | ||||||||||||||||
| 7–60 | 46/50b | 49/50 | |||||||||||||||||||||||
| >60 | 44/50b | 52/50 | |||||||||||||||||||||||
| Stomer et al. [48] | 56 | 61 | – | 169 | – | – | Mean (KT/GP) | 43/50d | 50/50d | ||||||||||||||||
| Neipp et al. [44] | 55 | 63 | – | 234 | – | – | Mean (KT/GP) | 66/84f | 81/81 | 60/75f | 52/72f | 51/61f | 79/83 | 87/81 | 69/75 | ||||||||||
| Wei et al. [55] | 49 | 46 | 4 | 173 | – | – | Mean (KT/GP) | 80/92c | 68/84c | 83/85 | 59/69c | 61/68c | 77/87c | 70/79b | 68/73b | ||||||||||
| Karine et al. [39] | 55 | 61 | – | – | 45 | 47 | Mean (KT/GP) | 45/50d | 46/47d | ||||||||||||||||
| Lumsdaine et al. [29] | 37 | 51 | 100 | 1.5 | – | – | Mean (KT/GP) | 15/16 | 16/15c | 17/15 | 17/15 | ||||||||||||||
| 12 | 16/16 | 16/15c | 17/15 | 16/15 | |||||||||||||||||||||
| Karam et al. [52] | 53 | 53 | – | >120 | – | – | Mean (KT/GP) | ||||||||||||||||||
For the HRQOL results of using the NIDDK-QOL, see notes below the table. Karam et al. reported significantly lower personal function (median 1 versus 4d) and GH (median 6 versus 7c), more physical symptoms (median 10 versus 8d) and more burden caused by physical (median 23 versus 15d) and mental symptoms (median 6 versus 5b). Continuous variables are presented as the mean if not otherwise indicated. HRQOL results are presented in bold if they were reportedly significant according to statistical testing (P < 0.05). –, not reported. aValues presented as the median. bP < 0.05. cP < 0.01. dP < 0.001. eP < 0.0001. fP-value not reported. gPercentage within the indicated range.
Study quality assessment
Great clinical and methodological heterogeneity was observed across the included studies. Among the studies there were no randomized controlled trials, 50% had a cross-sectional design, 32% had a prospective design and 18% had a retrospective design and 55% of the studies were single-centre studies. Different validated questionnaires were used to measure HRQOL (Supplementary data, Table S2). The most frequently used HRQOL questionnaire was the SF-36 (61%), followed by the Kidney Disease Quality of Life (KDQOL) questionnaire (18%) and the World Health Organization Quality of Life assessment (WHOQOL; 16%). The quality of the included studies was assessed for before–after studies and observational cohort and cross-sectional studies (Figure 2). For studies with more than one comparison, the quality appraisal was conducted separately for different comparisons. Therefore the quality appraisal was conducted for 56 records in total. Among the other observational cohort and cross-sectional studies (n = 39), 36% adjusted for demographic or/and clinical variables. Supplementary data, Table S3 shows the assessments for all included studies.
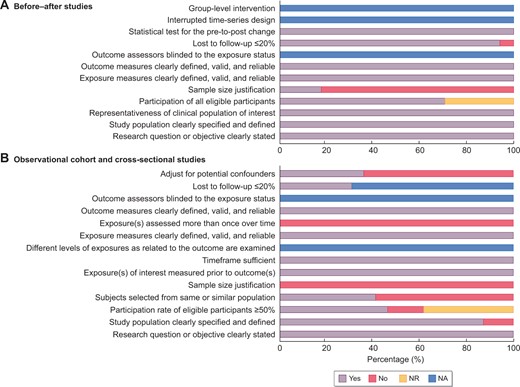
Quality assessment for included studies via the National Institutes of Health Quality Assessment Tool for Observational Cohort and Cross-sectional Studies and Before–After Studies With No Control Group. For studies that conducted more than one comparison, the quality assessment was conducted per comparison. The figure shows the assessment for (A) before–after studies (n = 17) and (B) observational cohort and cross-sectional studies (n = 39). NA, not applicable; NR, not reported.
HRQOL before and after KT
Seventeen studies compared pre-transplant and post-transplant HRQOL (Table 2) [13–29]. Multiple measurements of HRQOL were collected for the same patients before and after KT: pre-transplant HRQOL was measured at the transplantation, 2 weeks before transplantation or at study inclusion; post-transplant measurements were, on average, conducted at 1.5–46 months after KT. Eight studies reported the RRT before KT: the percentages of patients on dialysis ranged from 36 to 100%, with HD being the most common dialysis modality [13, 18–21, 26–28].
Within the first year after KT, studies using the SF-36 and the KDQOL reported consistently better post-transplant HRQOL in the physical HRQOL domain ‘general health’ (GH) and mental HRQOL domain ‘vitality’ (VT), as well as in the disease-specific HRQOL domain ‘effect of kidney disease’ (EKD) in both young [13, 17, 19–26] and elderly KTRs [28]. Two studies using the WHOQOL also showed improvement in physical HRQOL during the first year after KT [14, 29]. In KTRs with a post-transplant time of 46 months, Shresth et al. [16] found an increase in all mental, physical and disease-specific HRQOL domains compared with the preoperative HRQOL. This improvement in disease-specific HRQOL was also found by von der Lippe et al. [27] in KTRs with a similar post-transplant time.
HRQOL of KTRs and patients receiving maintenance dialysis
Eleven studies compared HRQOL between KTRs and patients receiving dialysis (Table 3) [30–40]. The average time of HRQOL measurements after KT ranged from 3 to 126 months. In a prospective study, Czyzewski et al. [37] showed better physical HRQOL in the domain ‘physical functioning’ (PF) and better disease-specific HRQOL in the domain ‘burden of kidney disease’ (BKD) in KTRs at 3 and 12 months post-transplantation compared with patients receiving dialysis and found similar mental HRQOL in the two groups. The other studies in prevalent KTRs detected a significantly better HRQOL in various physical and/or mental domains [30–36, 38–40]. Notably, only one study specified the WL status of its dialysis population and this study showed better physical [i.e. the domains ‘role physical’ (RP) and ‘bodily pain’ (BP)] and mental [i.e. the domain ‘social functioning’ (SF)] HRQOL in KTRs 10 years after KT compared with patients receiving dialysis for 8 years without awaiting KT [32].
HRQOL of KTRs and patients on the WL for KT
Five studies compared the HRQOL of KTRs with that of patients on the WL (Table 3) [32, 41–44]. The average time of HRQOL measurements after KT ranged from 12 to 234 months. All patients on the WL received either HD or PD treatment. In a prospective study, Rosenberger et al. [41] reported comparable mental and physical HRQOL between KTRs and patients on the WL after matching for age, gender and comorbidity at 3 and 12 months after KT. However, in a retrospective study, Franke et al. [43] reported better global HRQOL in KTRs an average of 5 years after transplantation compared with age- and sex-matched patients on the WL. Kovacs et al. [42] found higher scores in the physical HRQOL domain GH and disease-specific HRQOL domains (i.e. BKD and EKD) in prevalent KTRs with a mean post-transplant time of 5 years after adjusting for demographic and clinical variables. Fujisawa et al. [32] compared KTRs and patients awaiting KT on other RRTs for 10 years and detected better physical HRQOL in the domain GH in KTRs. Finally, in a cross-sectional study, long survivors (mean post-transplant time 20 years) after KT reported better HRQOL scores in the domains ‘physical symptom experience’, ‘fatigue’, ‘fear’ and ‘emotions’ but a lower score in the domain ‘appearance’ [44].
HRQOL of KTRs and patients with CKD not receiving RRT
Three studies compared HRQOL between KTRs and patients with CKD Stages 3–5 before RRT (Table 3) [39, 40, 48]. Stomer et al. [48] reported comparable physical and mental HRQOL for age-, gender- and estimated glomerular filtration rate (eGFR)-matched KTRs and CKD patients when measured by the SF-36. When HRQOL was measured using a visual analogue scale (VAS), a better HROQL was found in CKD patients compared with KTRs. Karine et al. [39] reported marginally better physical and mental HRQOL in KTRs compared with patients with CKD Stages 3–5 after adjusting for age, sex, education and diabetes. Finally, Iqbal et al. [40] described higher mean scores in all physical and mental HRQOL domains in KTRs (mean eGFR 49 mL/min/1.73 m2) compared with patients with CKD Stages 3–5 (mean eGFR 36 mL/min/1.73 m2).
HRQOL of KTRs and HCs
Six studies compared HRQOL between KTRs and HCs (Table 4) [16, 40, 43, 45–47]. The average post-transplant time in these studies ranged from 3 to 66 months. The HCs were often potential donors, staff from the same research institute or recruited by social media. Ay et al. [45] reported comparable summary scores for physical and mental HRQOL in incident KTRs at 3 and 9 months after KT to those of HCs, with a consistently lower score in the physical HRQOL domain RP. Three cross-sectional studies in KTRs, with a mean time of 3 years after KT, showed comparable mental HRQOL to those of HCs and two studies reported lower physical HRQOL in the KTRs [16, 43, 46]. In KTRs an average of 5 years after KT, Yagil et al. [47] detected lower physical and mental HRQOL in KTRs compared with age-, sex-, marriage status– and education level–matched HCs. Finally, Iqbal et al. [40] described lower mean scores in physical (i.e. RP and GH) and mental [i.e. VT, ‘role emotional’ (RE) and ‘mental health’ (MH)] HRQOL domains in KTRs with an unreported post-transplant time compared with HCs.
HRQOL of KTRs and the GP
Fourteen studies compared HROQL in KTRs with the GP from the same country or region (Table 4) [27–29, 39, 44, 48–56]. The average post-transplant time in KTRs ranged from 1 to 234 months. When compared with the GP, three prospective studies reported comparable physical and mental HRQOL in both young and elderly KTRs at 1 year after KT, among which one study, by Costa-Requena et al. [56], reported significantly lower physical HRQOL at 1 month after KT [28, 29]. Eight studies in KTRs with an average of 3–15 years after KT showed generally lower physical HRQOL and lower to comparable mental HRQOL compared with the GP [27, 48, 50–55]. One of these studies was conducted in elderly KTRs and reported similar HRQOL in the physical HRQOL domain PF and the mental HRQOL domains RE and MH to that of the GP, but lower HRQOL in the physical HRQOL domains BP and GH and the mental HRQOL domains VT and SF [50]. In KTRs with an average of 20 years after KT, Neipp et al. [44] reported lower HRQOL among KTRs in three of the four physical HRQOL domains (i.e. PF, BP and GH) and one of the four mental domains (i.e. VT). Two other studies without reported post-transplant times, reported lower mental and physical HRQOL in KTRs, with the exception of the mental HRQOL domain SF in one study [39, 49].
DISCUSSION
HRQOL is a valuable outcome for KTRs and nephrology care. This systematic review summarizes the published literature in recent decades that compares HRQOL in KTRs, measured with different validated HRQOL questionnaires, with that of all relevant populations (i.e. patients receiving dialysis, patients on the WL for KT, patients with CKD not receiving RRT, the GP and HCs) and themselves before KT. Despite the heterogeneity of included studies, the results of this systematic review suggest a better HRQOL after KT compared with the same individuals preoperatively and compared with patients receiving dialysis with or without being on the WL for KT. KTRs also seem to experience similar or marginally higher HRQOL compared with patients with CKD Stages 3–5 not receiving RRT. Finally, when compared with HCs and the GP, KTRs appear to have comparable HRQOL shortly after KT but a lower physical HRQOL and lower to comparable mental HRQOL in the long term, suggesting that HRQOL of KTRs may be restored to but is not always maintained at ‘pre-CDK’ HRQOL levels.
HRQOL in KTRs compared with patients with ESKD
The results of this review suggest consistently better HRQOL in KTRs, including elderly KTRs, when compared with patients with ESKD [i.e. the same cohort pre-transplantation consisting of patients receiving dialysis or patients not receiving RRT with pre-emptive KT (PEKT) and patients receiving dialysis with or without being on the WL] [14–22, 27, 28, 57, 58]. Our findings are in line with the previous systematic review conducted by Liem et al. [10] in 2007, showing higher HRQOL in physical (i.e. PF, RP, BP and GH) and mental (i.e. RE) SF-36 domains in KTRs compared with patients on either HD or PD after adjusting for age and diabetes.
There are several possible explanations for our findings that KTRs experience a higher HRQOL compared with patients with ESKD regardless of dialysis initiation and being on the WL or not. First, after an immediate decrease in self-reported physical activity due to the operation, KTRs report a 30% higher physical activity level than the pre-transplant level and this increase in physical activity persists until 5 years after successful KT [59]. This finding is also supported by a study, with physical activity being objectively measured using an accelerometer, showing a higher proportion of physically active KTRs compared with patients receiving dialysis (65% versus 20%) [60]. Anokye et al. [61] found an association between a higher physical activity level measured objectively and subjectively and better HRQOL. Second, KT can reduce the high symptom burden and treatment burden in ESKD patients and consequently improve HRQOL. Compared with ESKD patients, KTRs report less fatigue [44, 62, 63], decreased frequency of depressive symptoms [19, 62], better sleep quality [21, 64, 65] and less pain and immobility [63]. Third, KT can have a positive impact on SF, an important component of HRQOL. In a Swiss transplant cohort study, ∼80% of patients with ESKD maintained their employment after KT and ~20% of unemployed patients with ESKD restarted working after their KT [66]. Social participation in leisure and religious activities also significantly improved in KTRs compared with patients on HD [67]. The increased SF can be a result of the reduced treatment burden following the change from dialysis to KT. A commonly seen regimen of in-centre HD requires patients to visit the dialysis clinic three times a week and to be tied to a dialysis machine for ~4 h each time [68]. The negative impact of such treatment burden on social activities is foreseeable. Finally, KTRs appear to have more favourable illness perceptions (i.e. stronger positive beliefs about the seriousness and controllability of their condition) compared with before the transplantation, and such beliefs could also positively influence patient outcomes such as HRQOL [57, 69].
HRQOL in KTRs compared with CKD patients, HCs and the GP
Our results showed that KTRs had similar or marginally better HRQOL compared with patients with CKD Stages 3–5 before dialysis initiation [39, 40, 48]. Despite the restored renal function in KTRs, the commonly occurring side effects of immunosuppressants and a longer duration of underlying kidney disease might explain why their HRQOL was not significantly different from that of patients with CKD.
When comparing KTRs with HCs or the GP, eligible studies suggested comparable physical and mental HRQOL in a short period after KT (<2 years) [28, 29, 45, 56]. However, KTRs with a longer post-transplant time reported consistently lower physical HRQOL and lower to comparable mental HRQOL when compared with HCs or the GP. The comparable HRQOL in KTRs in the short term after KT could be a result of improved clinical health status [1], dramatically decreased treatment burden (especially for dialysis patients) [68], happiness and relief in the early post-transplant phase [70] and a potential response shift effect [71]. The response shift, in this specific context, refers to a phenomenon where part of the perceived improvement of HRQOL is due to patients’ adaptation to their post-transplant health condition [71]. In a study comparing coping strategies between KTRs and the GP, successfully transplanted KTRs had relatively more optimistic, self-reliant and supportive coping [72], which are considered effective in handling a chronic condition such as kidney disease. A more obvious example is the study conducted by Lumsdaine et al. [29], which detected better psychological health in KTRs than in the GP [29]. For patients with a longer post-transplant time, the comparatively lower HRQOL might be the result of treatment-related side effects and complications, a longer duration of pre-existing comorbidities or underlying kidney disease and the progressive decline of kidney function due to different causes (e.g. toxicity of immunosuppressants, progression of donor-derived lesions and recurrence of primary kidney disease). According to a large registry study in Australia and New Zealand, up to 10% of the KTRs experienced a 30% decrease in their kidney function between the first and third year after transplantation [73].
Clinical implications
The results of this systematic review reinforce the benefits of KT among patients with ESKD in terms of HRQOL and, at the same time, suggest that there is room for improvement. HRQOL after successful KT is dynamic and is influenced by many factors. Previous studies have shown a wide range of factors is associated with suboptimal post-transplant HRQOL, including sociodemographic characteristics (e.g. older age, female gender, low education and income, unemployment and living alone), clinical characteristics (e.g. disability, high serum creatinine, comorbidities and side effects from treatment and hospitalization), lifestyle characteristics (e.g. insufficient physical activity) and psychosocial characteristics (i.e. depression, negative illness perceptions and a lack of esteem or social support) [74–76]. Therefore, personalized treatment approaches addressing individual (modifiable) factors driving poor outcomes are needed to optimize HRQOL in kidney transplant care. Previous studies have investigated the effects of lifestyle, psychoeducational and self-management interventions to improve post-transplant HRQOL in addition to interventions for biochemical markers. A meta-analysis, including six randomized trials, showed that supervised exercise training can significantly improve HRQOL in KTRs [77]. Cognitive behavioural therapy also positively influenced HRQOL in this population [78]. Ongoing trials and research suggest the possibility to improve HRQOL by means of combined lifestyle interventions (exercise and diet) and web-based self-management [79, 80].
Our results also showed that post-transplant HRQOL could reach the levels reported by the GP or HCs shortly after KT but seemed to be lower in the long term. However, most studies that compared HRQOL between KTRs and the GP or HCs are cross-sectional and the relatively small sample size and short follow-up time of the included longitudinal studies suggest a need for studies with a sufficiently large sample of incident KTRs to map the evolution of HRQOL over time. Renal registries that routinely collect HRQOL data in clinical practice may fill this gap and provide insights into ‘real-world’ HRQOL of KTRs longitudinally. Finally, our systematic review suggested a need for more research on HRQOL in elderly KTRs, especially with the ageing population.
Strengths and limitations
The strengths of this up-to-date systematic review include a thorough literature search, the inclusion of all validated questionnaires to measure generic HRQOL as well as disease-specific HRQOL and the inclusion of all relevant comparison groups to provide a comprehensive picture of HRQOL after KT. This systematic review also has its limitations. First, due to the inability to calculate pooled estimates and to adjust for potential variables, the strength of our conclusion greatly depends on the quality of individual studies. Unfortunately, some studies only performed an unadjusted comparison between the comparison groups and some studies were conducted in prevalent patients, which are prone to selection bias, with the latter potentially being more evident in cross-sectional studies of long survivors. Second, it might be worth noting that most included studies commented on HRQOL differences being a statistically significant difference or change, but few of the studies commented on whether the difference or change could also be considered a clinically relevant difference or change in HRQOL—with the former not necessarily implying the latter [81]. Future studies addressing the clinically relevant HRQOL differences and changes in the field of nephrology are necessary to facilitate interpretation of HRQOL scores in the literature and in clinical practice. Finally, we only included publications written in the English language, thereby limiting the generalizations of our results.
CONCLUSION
Patients report a higher HRQOL after successful KT than before the transplantation and compared with patients receiving dialysis. KTRs also experience similar to a slightly better HRQOL compared with non-dialysis-dependent patients with CKD Stages 3–5. When compared with HCs and the GP, HRQOL appeared to be restored to a ‘pre-CKD’ level shortly after successful KT, but these higher HRQOL levels did not last in the long term. Future studies investigating interventions on modifiable risk factors for impaired HRQOL, such as immunosuppressive strategies, are needed to maximize the long-term benefit of KT.
SUPPLEMENTARY DATA
Supplementary data are available at ndt online.
ACKNOWLEDGEMENTS
We would like to thank librarian Johannes W. Schoones for his help to create the search strategy. We conducted this systematic review in preparation for a multicentre cohort study, the Patient-reported OutcomeS In KTRs: Input of Valuable Endpoints (POSITIVE) study to investigate the evolution of HRQOL in incident Dutch KTRs. Therefore we would like to thank Chiesi Pharmaceuticals and Astellas Pharma for providing financial support for the POSITIVE study. They had no role in the writing of or decision to submit this article.
FUNDING
Y.W. is supported by a scholarship (201706270194) from the Chinese Scholarship Council.
AUTHORS’ CONTRIBUTIONS
Y.W. iwas involved in the concept/design, article selection, data extraction, interpretation and drafting of the article. M.H.H. and W.W.B. were responsible for interpretation and critical review of the article. J.D.S. was responsible for the concept/design, article selection and critical review of the article. A.P.J.V. was involved in interpretation and critical review of the article. F.W.D. was involved in the concept/design, interpretation, critical review of the article and supervision. Y.M. was responsible for the concept/design, article selection, data extraction, interpretation, critical review of the article and supervision.
CONFLICT OF INTEREST STATEMENT
The authors have declared no conflicts of interest. The results presented in this article have not been published previously in whole or part, except in abstract format.
DATA AVAILABILITY STATEMENT
No new data were generated or analysed in support of this research.


Comments