


Abstract
Lung ultrasound (US) reliably estimates lung water and it is increasingly applied in clinical practice in dialysis patients. A semi-quantitative US score summing up the US-B lines (an equivalent of B lines in the standard chest X-ray) at 28 sites in the intercostal spaces (Jambrik et al. Usefulness of ultrasound lung comets as a non-radiologic sign of extravascular lung water. Am J Cardiol 2004; 93: 1265–1270) is the most used score.
We compared the prognostic performance for death, and cardiovascular (CV) events of the 28-sites US score with a score restricted to eight sites in a cohort of 303 haemodialysis (HD) patients.
The 8- and the 28-sites scores were highly inter-related (Spearman’s ρ = 0.93, P < 0.001), and their concordance index was fairly good (k = 0.79, 95% confidence interval 0.74–0.84). During a mean follow-up of 3 years, 112 patients died, and 129 experienced a CV event. At univariate and multivariate analysis, both scores were associated with mortality (P ≤ 0.01) and CV events (P ≤ 0.05). The explained variances (R2) for death and CV events of the 28-sites score in multivariate models including major risk factors for these outcomes in the end-stage kidney disease (ESKD) population were 3.9 and 2.2%, and those of the 8-sites score were 3.1 and 2.4%, respectively. The median time needed to perform the examination was 3.05 min [interquartile range (IQR) 2.22–5.00 min] for the 28-sites score and 1.35 min (IQR 1.16–2.00 min) for the 8-sites score.
The 8-sites score is tightly related to the classical Jambrik 28-sites score and this score holds an almost identical predictive power to the reference score. Even though the 28-sites score can be completed just in ∼3 min, the 8-sites score requires only ∼1.30 min, and it is, therefore, better suited for application in everyday clinical practice in HD units.
KEY LEARNING POINTS
What is already known about this subject?
lung ultrasound (US) reliably estimates lung water and it is increasingly applied in clinical practice in dialysis patients;
a US score summing up the US-B lines at 28 sites in the intercostal spaces is the most used score; and
shorter tests have not been investigated in dialysis patients.
What this study adds?
we tested a score restricted to 8 and 28 sites in a cohort of 303 haemodialysis (HD) patients;
the 8- and 28-sites scores were highly inter-related (ρ = 0.93, P < 0.001) and their concordance index was fairly good (k = 0.79); and
their prognostic ability for death and cardiovascular events of the two scores was equivalent.
What impact this may have on practice or policy?
the 8-sites score requires only ∼1.30 min; and
it is, therefore, better suited for application in everyday clinical practice in HD units.
INTRODUCTION
The propensity to lung congestion in end-stage kidney disease (ESKD) has been known for many years [1, 2]. However, the full appreciation of the high prevalence and the associated risk for death by water accumulation in the lungs occurred only after the development of a simple, reliable and inexpensive technique based on lung ultrasound (US) [3], which built upon previous observations by Lichtenstein et al. [4]. This technique has been validated in haemodialysis (HD) patients [5], and it is increasingly applied in clinical practice in ESKD (reviewed in [6]).
Even though lung US is also useful for the quantification of lung fibrosis [7], in patients without obvious chronic bronchopulmonary diseases, this technique provides reliable estimates of interstitial lung water. The key metric to estimate lung water is the counting of the so-called US B-lines (US-B lines), which are the US equivalent of chest X-ray Kerley B-lines. The original lung US score, developed by Jambrik et al. [3] is calculated by summing up the US-B lines detected at 28-sites intercostal spaces, 16 on the right hemithorax and 12 on the left hemithorax [3]. Even though this measurement requires just a few minutes to obtain, other methods measuring US-B lines at four [8], six [9] and eight [10] sites in the thorax have been developed.
The diagnostic performance of lung US protocols for pulmonary congestion assessment (i.e. the 4-, 6-, 8- and 28-point methods) in patients admitted with acute dyspnoea has recently been compared by Buessler et al. [11]. In this study, the eight-sites score by Volpicelli et al. [10], also adopted for a study in ESKD patients by Arun et al. [12], had an excellent performance. Diagnostic biomarkers are disease-specific, and, therefore, lung US scores based on a restricted number of sites need to be specifically validated in the target population where they can potentially be applied in clinical practice, i.e. the HD population in our case.
With this background in mind, we took the opportunity offered by the database of the largest lung US cohort study performed so far in the HD patients [13] to compare the prognostic value of the Jambrik 28-sites approach [1] with a restricted approach limited at eight pre-specified sites that are part of the standard 28-sites approach.
MATERIALS AND METHODS
The ethical committee at our hospital approved the protocol of the source cohort study [13] and each participant provided his/her informed consent.
Patients
Among the 392 patients who participated in the cohort study [13], 303 patients had a detailed map of the number of US-B lines in the 28 lung intercostal points along the parasternal, mid-clavicular, anterior axillary and mid-axillary lines (Jambrik method; Figure 1). Therefore, these patients could be included in this study comparing the prognostic value of the 28-sites lung US score and a restricted approach limited to measurements at eight pre-specified sites extracted from the 28-sites score. These patients had been on regular HD with standard bicarbonate dialysis for a median time of 49 months [interquartile range (IQR) 24–100 months]. They were been treated with non-cellulosic membrane filters of various types. The main demographic, somatometric, clinical and biochemical characteristics of the study population are detailed in Table 1.
![Lung scanning with the Jambrik approach [6] is done at 28 sites: from the second to the fifth intercostal space along the parasternal, mid-clavicular, anterior axillary and mid-axillary lines on the right side, and along the same lines but only from the second to fourth intercostal space on the left side. The restricted approach is limited to eight sites only, i.e. along the parasternal and the anterior axillary line, limited to the second and the fourth intercostal space on both sides of the thorax.](https://oup.silverchair-cdn.com/oup/backfile/Content_public/Journal/ndt/36/12/10.1093_ndt_gfaa285/2/m_gfaa285fig1.jpeg?Expires=1747904954&Signature=KpvJjQgANXztisz-1X9BVcUrVcIpko1rsLhoWE-Tao43GzkeouoXZ5H~nhSN1urmr9-lPB5j-xrUpClh-nuHrj2jDiDxUS2eyHRgue8uKKILRhym9JoLVcx6OO3TB7HwSlcCSLROdionPgU8mbwMLV6aKU9QROsA3cZx07HVLniP8jvvLmtMeA9dELvyebGpdXvQrWt1MAYx7yJ5QnEpV1RfjCGj8lGlS9iZRHyfUwz~qqvAMiZObUkdRA4SUwTXobFKRzQEjEhYsuSjlfKbkFOtQfXYQF8PeV~ICIii2z798HAb07cg9RKu4BBg6S2XB4kHGCZPgS9caQvBxgwNLg__&Key-Pair-Id=APKAIE5G5CRDK6RD3PGA)
Lung scanning with the Jambrik approach [6] is done at 28 sites: from the second to the fifth intercostal space along the parasternal, mid-clavicular, anterior axillary and mid-axillary lines on the right side, and along the same lines but only from the second to fourth intercostal space on the left side. The restricted approach is limited to eight sites only, i.e. along the parasternal and the anterior axillary line, limited to the second and the fourth intercostal space on both sides of the thorax.
Main demographic, somatometric and clinical characteristics in the whole study population and in patients as divided according to 28-sites score categories
Study population (n = 303) | |
|---|---|
| Age, years | 66 ± 15 |
| BMI, kg/m2 | 25 ± 5 |
| Male sex, n (%) | 186 (61) |
| Smokers, n (%) | 51 (17) |
| Diabetics, n (%) | 89 (29) |
| Dialysis vintage, months | 49 (24–100) |
| With CV comorbidities | 157 (52) |
| On anti-hypertensive treatment, n (%) | 157 (52) |
| Systolic blood pressure, mmHg | 136 ± 23 |
| Diastolic blood pressure, mmHg | 73 ± 12 |
| Cholesterol, mg/dL | 153 ± 38 |
| Haemoglobin, g/dL | 11.3 ± 1.4 |
| Albumin, g/dL | 4.0 ± 0.4 |
| CRP, mg/L | 5.0 (3.0–14.0) |
| Calcium, mg/dL | 9.0 ± 0.9 |
| Phosphate, mg/dL | 4.9 ± 1.7 |
Data are expressed as mean ± SD, median and IQR or as per cent frequency, as appropriate.
Laboratory measurements
Blood sampling was performed after an overnight fast always during a mid-week HD day (Wednesday or Thursday, brief interval). Serum cholesterol, albumin, calcium, phosphate, C-reactive protein (CRP) and haemoglobin measurements were made using standard methods in the routine clinical laboratory.
Lung US and US-B lines score
As described in a study by Mallamaci et al., the measurement of the US-B lines has high inter-observer reliability (concordance index 0.96) as well as very satisfactory reliability between different probes (concordance index 0.99) in the HD population [5]. All lung US assessments were made by these nephrologists immediately before dialysis. Observers were unaware of the result of clinical and echocardiography data. Briefly, scanning of the anterior and lateral chest was performed on both sides of the chest, from the second to the fourth (on the right side to the fifth) intercostal spaces, at parasternal to mid-axillary lines, as previously described [5] (Figure 1). After checking the integrity of the pleural line, US-B lines were recorded in each intercostal space and were defined as a hyperechoic, coherent US bundle at narrow basis going from the transducer to the limit of the screen. More details are available in a 2-min movie on YouTube (http://www.youtube.com/watch? v=amsULLws8GI). A map of the chest reporting the number of US-B lines in the chest points depicted in Figure 1 was registered. US-B lines were summed to obtain a score reflecting the extent of LW accumulation, 0 being no detectable lung US-B lines and ≤5 the upper limit of the normal range of US-B lines in healthy individuals [14]. The simplified score restricted to eight sites (Figure 1) was calculated on the basis of the chest map (see above) by summing up the measurements made along the parasternal and anterior axillary lines at the second and fourth intercostal space, in both the right and left hemithorax.
To compare the time needed for the examination, five independent assessors with various experiences—from low to high—on lung US assessment were asked to measure pre-dialysis US-B lines with both the 28-sites (Jambrik approach) and the simplified 8-sites approach. The time counting started with the first lung US image and ended with the last one. The time needed to perform the two tests was accurately measured and recorded.
Follow-up study
After the initial assessment, patients were followed up for a median time of 3.0 years (IQR 1.9–4.5 years), and the causes of death and cardiovascular (CV) events were collected. CV events were classified as follows: stroke (ischaemic or haemorrhagic), documented by computed tomography, magnetic resonance imaging and/or clinical and neurological evaluation; transient ischaemic attacks; myocardial infarction confirmed by serial changes of electrocardiogram (ECG) and cardiac biomarkers; ECG-documented angina episodes; heart failure, diagnosed based on clinical and instrumental evidence, as reported before; ECG documented arrhythmia; peripheral ischaemia or amputations; unexpected, sudden death highly suspected as of cardiac origin. Three independent physicians assessed each cause of death. In doubtful cases, the diagnosis was attributed to consensus. During the review process, the involved physician used all available medical information, including hospitalization forms and medical records. In case of death occurring at home, family members and/or general practitioners were interviewed to understand better the circumstances which led to death.
Statistical analysis
Data were expressed as mean ± standard deviation (SD) (normally distributed data), median and IQR (non-normally distributed data) or as per cent frequency (categorical data). Spearman’s rho was used to measure the correlation between the US-B lines scores. Cohen’s kappa coefficient measured the agreement [15] applied to corresponding categories of lung congestion (first tertile: normal to low, second tertile: moderate, third tertile: severe) of the two scores. The prognostic value of US-B lines for predicting the study outcomes (all-cause death and fatal and non-fatal CV events) was investigated by univariate and multivariate Cox regression analysis. Lung US-B lines of the two scores were included in the models as continuous variables. Multivariate models included traditional risk factors (age, gender, current smoking, diabetes, cholesterol and arterial pressure), CV comorbidities, body mass index (BMI), anti-hypertensive treatment, risk factors related to chronic kidney disease (CKD-5D) (dialysis vintage, haemoglobin, albumin, calcium and phosphate) and CRP. The additional prognostic value of US-B lines for study outcomes was investigated by the explained variation in mortality (R2) [16] and the discrimination power (Harrell’s C Index) [17]. Statistical analysis was performed by a standard statistical package (SPSS for Windows, version 22, Chicago, IL, USA; STATA for Windows, version 13, College Station, TX, USA).
RESULTS
Table 1 shows the main demographic, somatometric, clinical and biochemical characteristics of the 303 patients included in this study. A total of 89 could not be included in the study for the lack of a detailed map of US-B lines of the 28-sites Jambrik’s score. These 89 patients were comparable to the 303 patients that were included in this study for all variables except the proportion of patients with past CV complications, average haemoglobin and serum calcium original cohort study (see Supplementary data, Table S1).
All patients but 20 had US-B lines on both, the right and the left hemithorax. Among the 20 with unilateral US-B lines, 10 had <5 US-B lines, 3 had > 5 < 10 US-B lines, 6 had >10 < 15 US-B lines and the last had 32 US-B lines. Overall, the 28- and 8-sites score were highly inter-related (Spearman’s ρ = 0.93, P < 0.001, Figure 2) and their concordance index [k = 0.79, 95% confidence interval (CI) 0.74–0.84] was fairly good. During a mean follow-up of 3 years, 112 patients died and 129 had a fatal/non-fatal CV event. At univariate analysis, both scores were associated to all-cause death and CV events (Table 2), and these relationships were confirmed in multiple regression analyses adjusting for the full set of variables described in Table 1 (Table 2).
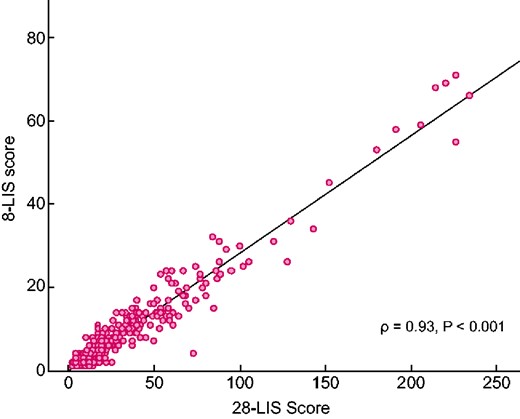
Correlation between 28- and 8-sites scores in the study population. LIS, lung intercostal spaces.
Univariate and multivariate HR for mortality and CV events for the 28- and the 8-sites scores
| Variables | HR (95% CI), P-value |
|---|---|
| Outcome: all-cause death | |
| Univariate analysis | |
| 28-sites score (continuous, 5 US-B lines increase) | 1.03 (1.01–1.05), 0.002 |
| 8-sites score (continuous, 5 US-B lines increase) | 1.10 (1.04–1.17), 0.002 |
| Multivariate analysis | |
| 28-sites score (continuous, 5 US-B lines increase) | 1.03 (1.01–1.05), 0.006 |
| 8-sites score (continuous, 5 US-B lines increase) | 1.09 (1.02–1.18), 0.01 |
| Outcome: CV events | |
| Univariate analysis | |
| 28-sites score (5 US-B lines increase) | 1.03 (1.01–1.04), 0.003 |
| 8-sites(5 US-B lines increase) | 1.10 (1.03–1.16), 0.002 |
| Multivariate analysis | |
| 28-sites score (continuous, 5 US-B lines increase) | 1.02 (1.00–1.04), 0.05 |
| 8-sites (continuous, 5 US-B lines increase) | 1.07 (1.00–1.14), 0.05 |
In the multivariate analysis, the hazard ratios (HRs) were adjusted for the full set of variables described in Table 1 (age, gender, current smoking, diabetes, cholesterol, arterial pressure, CV comorbidities, BMI, anti-hypertensive treatment, dialysis vintage, haemoglobin, albumin, calcium, phosphate and CRP).
The prognostic power of the 28-sites score versus the 8-sites score
The two risk scores contributed modestly but significantly (P < 0.01) to explain all-cause mortality and CV events. The R2 of the 28-sites score for death and CV events were 3.9 and 3.3%, respectively. The corresponding R2 of the 8-sites score was of similar magnitude, being 4.7% (death) and 4.1% (CV events). Accordingly, when the two scores were separately added to a clinical model based on readily available clinical variables (age, gender, smoking, diabetes, CV comorbidities, cholesterol, arterial pressure, BMI, anti-hypertensive treatment, class as well as dialysis vintage, haemoglobin, albumin, phosphate and CRP), the R2 of the model including the 28-sites score (death: 27.5%; CV events: 21.6%) were again very similar to those of the 8-sites score (27.1% and 21.8%, respectively), indicating substantially similar predictive power of the two scores (Table 3). In a sensitivity analysis excluding patients with unilateral US-B lines, the R2 of the multivariate models including the 28- and 8-sites scores, respectively, remained substantially unmodified (Table 3).
Prognostic performance of 28- and 8-sites scores added to a basic clinical model in the whole cohort and in a sensitivity analysis excluding the 20 patients with unilateral US-B lines (see text)
| Whole cohort (n = 303) | Sensitivity analysis excluding the 20 patients with unilateral US-B lines (n = 283) | |||
|---|---|---|---|---|
| Explained variance (R2) (%) | Harrell’s C index (%) | Explained variance (R2) (%) | Harrell’s C index (%) | |
| Outcome: death | ||||
| Base model | 24.0 | 69.6 | 26.2 | 70.0 |
| Base model + 28 LIS score | +3.5 | +0.9 | +2.2 | +0.6 |
| Base model + 8 LIS score | +3.1 | +0.8 | +2.5 | +0.8 |
| Outcome: CV events | ||||
| Base model | 19.4 | 68.6 | 20.0 | 69.2 |
| Base model + 28 LIS score | +2.2 | +1.4 | +2.2 | +0.8 |
| Base model + 8 LIS score | +2.4 | +1.4 | +2.2 | +0.9 |
The basic model included age, gender, current smoking, diabetes, cholesterol, arterial pressure, CV comorbidities, BMI, anti-hypertensive treatment, dialysis vintage, haemoglobin, albumin, calcium, phosphate and CRP. LIS, lung intercostal spaces.
The time needed to perform the 28- and 8-sites score
The median (IQR) time needed to perform the examination was 3.0 min (2.2–5.0 min) for the 28-sites score and 1.3 min (1.2–2.0 min) for the 8-sites score.
DISCUSSION
This study shows that in ESKD patients, a simplified lung US score for the detection of US-B lines at eight pre-specified intercostal sites maintains the same prognostic value as the standard 28-sites lung US score. Both scores are quick to obtain, but the simplified score halves the time of the lung scanning needed to estimate lung water in this population.
Lung US is increasingly applied for the diagnosis and the monitoring of various lung conditions in emergency and critical care settings—including pneumothorax, the interstitial syndrome and lung consolidation [7] and to estimate lung water in several studies in ESKD patients (reviewed in [6]). One advantage of lung US is that it has a fast learning curve [3]. A web-based educational programme dedicated to lung US for the estimation of lung water has already been successfully applied in the frame of an ongoing clinical trial in ESKD (ClinicalTrials.gov NCT02310061).
In addition to the fast learning curve, another advantage of this technique is its rapidity. The mean time for measuring lung water at 28 sites by experienced investigators was just 2.8 ± 0.4 min in the seminal study by Jambrik et al. [3]. However, it has been emphasized that studies comparing the standard 28-intercostal spaces method with shorter methods are needed to encourage a wider application of lung US in the care of dialysis patients [18]. The average time taken to complete the examination at 28 sites by five independent observers in our study (3.0 min) was close to that in the study by Jambrik notwithstanding the fact that only two of the five observers had a consolidated experience with the technique. As expected, in our study, the time required for performing the 8-sites intercostal spaces scanning was much shorter, being only 1.3 min, which indicates that lung US can be made even faster by reducing the number of lung intercostal sites.
Probably the best among the short approaches to lung US is the 8-sites method by Volpicelli et al. [10], which is recommended in an international guidance document on the application of the technique [7]. This approach divides the chest wall into eight areas, four in the right and four in the left hemithorax, and the intercostal space with the maximum extension of the visible pleural line is selected for measuring the number of US-B lines in each area [10]. Instead of this approach, we pragmatically tested an eight pre-specified sites approach, because these sites are included in the 28-sites approach by Jambrik and could, therefore, be easily extracted from the database of the previous cohort study by us [13]. We could therefore compare in the same population lung scanning at 8 and 28 sites. As expected, the two scores were highly inter-correlated.
Furthermore, they showed a fairly good agreement for the identification of patients with normal to mild, moderate and severe lung congestion. Of more critical relevance, the score based on eight sites had quite similar prognostic value to the standard 28-sites score. Thus, our data indicate that a score restricted to eight pre-specified sites that are also part of the 28-sites score by Jambrik is prognostically equivalent to the standard 28-sites score. In patients with known or suspected heart failure or coronary heart disease, the chest map of US-B lines shows ‘wet spots’ preferentially aligned with the third intercostal space along the anterior and mid axillary lines [19], and this four-sites approach predicts death and hospitalization [20] in patients with acute heart failure. The prognostic performance of the 4-sites approach remains to be specifically tested in HD patients.
The gain in execution time with the 8-sites score as compared with the 28-sites score is modest (1.3 min versus 3 min) and the decision about which approach to adopt depends on the clinical and investigational circumstances. Perhaps in clinical practice, the 8-sites approach is adequate in most circumstances. Nephrologists may resort to the 28-sites approach only in cases where they have doubts about the numerical interpretation of lung scanning, for example, in patients with moderate lung congestion where it is critical to exclude severe congestion. In clinical research, the 28-sites approach is the one applied in the vast majority of studies, and the ongoing LUST is based on this approach. Therefore, maintaining the 28-sites score in clinical research may eventually prove useful for meta-analyses and comparative studies.
This study has limitations. The first is that we did not test the widely applied 8-sites score by Volpicelli et al. [10] but a score based on eight pre-specified sites included in the 28-sites score by Jambrik et al. [3]. The second limitation is that we could extract the 8-sites score in 77% of the original cohort of the source study, and excluded patients showed minor differences in the risk profile as compared with those that were included. However, in analyses adjusting for the whole set of risk factors, including the risk factors that differed among included and excluded patients, the prognostic power of the two scores remained substantially similar. We believe that in most clinical circumstances the 8-sites scores by Volpicelli et al., applied to ESKD patients by Arun et al. [12], and the score we tested in this study are suitable for diagnostic and prognostic purposes. An even shorter score based on just four sites has shown an excellent performance in patients with decompensated heart failure [20].
In conclusion, in ESKD patients maintained on chronic HD treatment, lung congestion estimated by lung US at eight sites shows a fairly good agreement with standard lung US at 28 sites, and the two approaches have similar prognostic value in this population. The 8-sites approach is faster and can be applied in most circumstances to detect lung congestion in this population.
SUPPLEMENTARY DATA
Supplementary data are available at ndt online.
ACKNOWLEDGEMENTS
We are grateful to the investigators who participated in the cohort study [13] on which the present analysis is based.
FUNDING
This study had no funding.
DATA AVAILABILITY STATEMENT
We accept sharing our data with interested investigators. Data request should be addressed to [email protected].
CONFLICT OF INTEREST STATEMENT
The authors declare no conflict of interest.


Comments