


Abstract
There is limited information available on the impact that provision of an assisted peritoneal dialysis (PD) service has on the initiation of PD. The aim of this study was to assess this impact in a centre following initiation of assisted PD in 2011.
This retrospective, single-centre study analysed 1576 patients incident to renal replacement therapies (RRTs) between January 2002 and 2017. Adjusted Cox regression with a time-varying explanatory variable and a Fine and Gray model were used to examine the effect of assisted PD use on the rates and cumulative incidence of PD initiation, accounting for the non-linear impact of RRT starting time and the competing risks (transplant and death).
Patients starting PD with assistance were older than those starting unassisted: median (interquartile range): 70.0 (61.5–78.3) versus 58.7 (43.8–69.2) years old, respectively. In the adjusted analysis assisted PD service availability was associated with an increased rate of PD initiation [cause-specific hazard ratio (cs-HR) 1.78, 95% confidence interval 1.21–2.61]. During the study period, the rate of starting PD fell before flattening out. Transplantation and death rates increased over time but this did not affect the fall in PD initiation [for each year in the study cs-HR of starting PD 0.95 (0.93–0.98), sub-distribution HR 0.95 (0.94–0.97)].
In a single-centre study, introducing an assisted PD service significantly increased the rate of PD initiation, benefitting older patients most. This offsets a fall in PD usage over time, which was not explained by changes in transplantation or death.
INTRODUCTION
Older people are the fastest growing group of patients with end-stage renal disease (ESRD) [1, 2]. For patients requiring renal replacement therapy (RRT), transplantation is associated with better outcomes [3, 4] and quality of life [5–7], and lower costs [8], but it is not possible for all patients, particularly the elderly or frail [9].
Peritoneal dialysis (PD) has been associated with a better quality of life [10–12], better outcomes in the first 2–3 years [13–17] and lower costs than haemodialysis (HD) [18, 19]. As a home therapy, it offers several advantages for elderly patients with comorbidities. Most important are the avoidance of transport to and from the dialysis unit, difficult vascular access and haemodynamic instability during HD sessions [20, 21]. The conditions that act as a barrier to self-care PD in the elderly can be overcome by assisted PD [22, 23]. Assistance can thus improve accessibility of home dialysis and survival in elderly or frail patients [22, 24, 25], whose quality of life may benefit most from home care dialysis [11].
Despite these advantages, use of PD has been declining in the past decades [1, 2, 26, 27], e.g. in the UK the PD prevalence in 2015 was of 55 per million population, a reduction of 6.2% compared with 2005 [2, 27]. It is unclear what impact widespread adoption of assisted PD could have on this, with divided opinions in the nephrology community [28]. Assisted PD usage varies between European countries, according to the health care reimbursement system [24, 25]. Within the UK, there is no reliable data captured at a national level that would allow a reliable assessment [1, 2, 27]. One UK study examined practices associated with home dialysis use but the impact of assisted PD was not included in this [29].
The aim of this study is to assess the impact of the implementation of an assisted PD service on PD initiation.
MATERIALS AND METHODS
Study population
This retrospective, single-centre study used the data from the Renal Unit of Royal Stoke University Hospital database. All patients >18 years who began RRT at Royal Stoke University Hospital between 1 January 2002 and 1 January 2017 were included. Patients were followed from the start of any RRT until PD initiation, death, transplant, transfer to another centre, recovery of renal function or administrative end period on 14 March 2017 (i.e. a pre-emptive transplant or starting RRT with PD would have an event time of 0 days and follow-up stopped, starting RRT with HD then transferring to PD, having a transplant or dying after 60 days would have an event time of 60 days and follow-up stopped at that point). No patients were lost to follow-up. Patients transferred in from another hospital were excluded.
Assisted PD service
Hospital-employed and trained healthcare assistants visit the patient once a day at home to set up the automated PD equipment for the session, with the patient only needing to connect their catheter and disconnect it afterwards. It was established locally, available from the start of 2011. Support is provided to all patients thought to benefit, as decided in discussion between a home dialysis nurse and the patient, for as long as necessary. The healthcare assistants clean exit sites, help weigh patients and liaise with the home dialysis nurse for troubleshooting as required. Assistance provided by a family member was not considered as assisted PD. After introduction, the service was monitored to ensure it was sustained over time. The increased cost is now reflected in the national tariff for dialysis, introduced a year after initiation of the service.
Patient characteristics
These included age at RRT start, gender, ethnicity, primary renal disease and assisted PD availability. The primary renal disease was composed of the following classes: diabetes, glomerulonephritis, vascular renal disease, polycystic, pyelonephritis, uncertain aetiology and others. The latter included all nephropathies that did not belong to one of the previous classes, such as myeloma kidney and acute kidney injury.
Statistical analysis
The outcome of interest was PD initiation at any time after RRT start defined as an initiation of PD >1 day and in a comparative analysis as PD treatment lasting at least 90 days. Continuous variables are described by their median [interquartile range (IQR)], and categorical variables by frequency and percentage.
Because availability of assisted PD varied depending on when a patient started RRT (e.g. available to all if starting after 2011, but after 2 years for those commencing in 2009), the primary analysis used a Cox proportional hazards model, with availability of an assisted PD service as a time-varying explanatory variable [30, 31], to estimate cause-specific hazard ratios (cs-HRs) where the outcome was time to initiation of any form of PD. Secondary analyses included comparing two Cox models with RRT start year as exposure and the outcome self-care PD initiation only, or either of self-care or assisted PD initiation. This illustrates the effect of assisted PD availability on PD initiation (with self-care versus self-care and assisted) over time (Figure 1). A Fine and Gray model, with a primary outcome of any PD initiation and competing events of transplantation and death, was also used to assess the impact competing events could have on the cumulative incidence of PD initiation. All analyses were repeated with PD usage defined as >90 days of PD treatment.
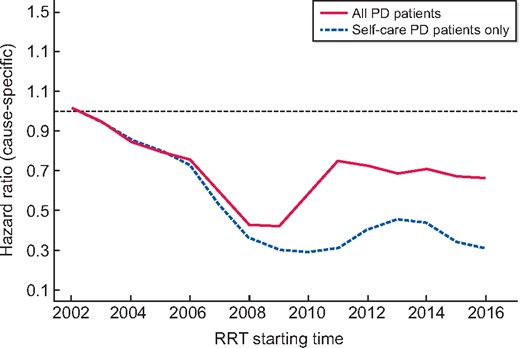
Effect of assisted PD service on the hazard rate of PD initiation over time. Change in the proportional use of PD over time: lines (solid line: all PD patients; dashed line: self-care PD only) represent the rates of receiving PD at any point during follow-up, by the year that renal replacement was initiated, when compared with 2002 (expressed as an HR). The analysis was adjusted for age, gender, ethnicity and primary renal disease using a Cox model. There is a relative reduction in PD use between 2002 and 2008 that is partially reversed in after the introduction of assisted PD in 2011, at which point PD use stabilized.
Explanatory variables in regression analyses included RRT start year (length of time between 1 January 2002 and date of starting RRT), age at RRT start, gender, ethnicity and primary renal disease. The linearity for continuous explanatory variables (age and RRT start year) on cs-HRs and sub-distribution HRs (sd-HRs) regression analysis was assessed with regression splines, and where necessary, fractional polynomial (FP) and transformation to a categorical variable were explored [32]. Interactions were tested in all multivariable models. Proportionality assumptions were assessed with Schoenfeld residual and log-minus-log plots.
Data were missing for four explanatory variables, with more than 10% missing values for two variables. A complete case analysis would have excluded 28% (448 patients) of the subjects from the dataset. Multiple imputation by chained equation (MICE) was performed, imputing 50 sets of missing values for the Cox regression models. All statistical analyses were performed with R 3.4.3 (R Foundation for Statistical Computing, Vienna, Austria; the ‘cmprsk’ library was used to fit the Fine and Gray regression models).
RESULTS
Patient characteristics
Of the 1698 patients starting RRT after 2002, 91 were transferred in from another hospital and 31 were aged <18 years; 1576 patients were included in the analyses (Figure 2). Of these patients, 1126 (71%) started RRT with HD, 370 (24%) with PD and 80 (5%) with a pre-emptive transplant. Some 128 patients (8%) have been on assisted PD at some point and 723 started RRT while assisted PD was available.
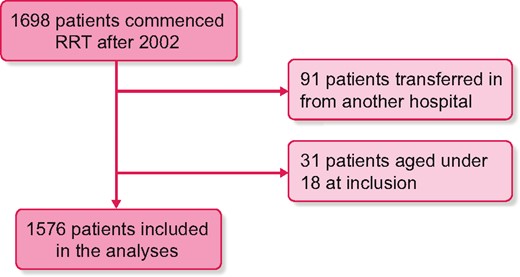
Flowchart of patient inclusion in analysis.
The median time to PD initiation was 0 months (IQR 0–61 days). There were 1259 events during the study period: 482 (31%) PD initiation, 202 (13%) transplants and 575 (36%) deaths. If PD initiation was defined as at least 90 days of treatment, 465 (30%) patients started PD, 205 (13%) had a transplant and 589 (37%) died. Of the total PD initiations, 268 occurred before 2011, all starting with self-care PD and 26 (10%) moving to assisted PD when it became available; 214 occurred after 2011: 112 (52%) started self-care PD with 32 moving to assisted PD later and 102 (48%) patients started assisted PD with 35 moving to self-care PD later.
Patient characteristics are described in Table 1, with further detail on those receiving assisted PD in Table 2. Table 3 describes the number of patients starting PD and assisted PD by year of RRT start. The RRT population was aging during the study period, with the PD population aging at a faster rate: the RRT population had a median age of 66.2 years (IQR 50.6–74.7) if starting RRT before 2011 versus 67.7 years (IQR 55.8–77.35) if starting RRT after 2011, a difference of 1.6 years. The PD population had a median age of 59.4 years (IQR 45.8–70.2) if starting before 2011 versus 65.3 years (IQR 51.6–74.1) if starting after 2011, a difference of 5.9 years. Patients starting PD with assistance were significantly older than those starting unassisted: the median age of patients starting PD without assistance was 58.7 years (IQR 43.8–69.2) versus 70.0 years (IQR 61.5–78.3) with assistance.
Patient characteristics
| Variable | All patients | All PD patients | Assisted PD | Self-care PD |
|---|---|---|---|---|
| (n = 1576) | (n = 482) | (n = 128) | (n = 354) | |
| Age, years, median (IQR) | 66.7 (52.9–75.9) | 62.6 (48.1–1.6) | 70 (61.5–78.3) | 58.7 (43.8–69.2) |
| Gender (male) n (%) | 961 (61) | 295 (61) | 84 (66) | 211 (60) |
| RRT starting year, median (IQR) | 2010 (2007–14) | 2010 (2005–14) | 2013 (2011–15) | 2007 (2004–13) |
| Ethnicity, n (%) | ||||
| White | 1127 (72) | 393 (82) | 102 (80) | 291 (82) |
| Non-white | 86 (5) | 30 (6) | 7 (5) | 23 (7) |
| Missing | 363 (23) | 59 (12) | 19 (15) | 40 (11) |
| Primary renal disease, n (%) | ||||
| Diabetes | 352 (22) | 119 (25) | 35 (27) | 84 (24) |
| Glomerulonephritis | 222 (14) | 73 (15) | 11 (8) | 62 (17) |
| Renal vascular disease | 255 (16) | 73 (15) | 27 (21) | 46 (13) |
| Polycystic | 99 (6) | 38 (8) | 4 (3) | 34 (10) |
| Pyelonephritis | 97 (6) | 32 (6) | 1 (1) | 31 (9) |
| Uncertain aetiology | 158 (10) | 61 (13) | 18 (14) | 43 (12) |
| Other | 227 (15) | 49 (10) | 16 (13) | 33 (9) |
| Missing | 166 (11) | 37 (8) | 16 (13) | 21 (6) |
| Modality at end of follow-up, n (%) | ||||
| PD | 64 (4) | 64 (14) | 29 (22) | 35 (10) |
| Assisted PD | 26 (2) | 26 (6) | 26 (20) | 0 (0) |
| Self-care PD | 38 (2) | 38 (8) | 3 (2) | 35 (10) |
| HD | 308 (20) | 45 (9) | 13 (10) | 32 (9) |
| Transplant | 282 (18) | 112 (23) | 6 (5) | 106 (30) |
| Recovered renal function | 45 (3) | 9 (2) | 3 (2) | 6 (2) |
| Transferred out | 51 (3) | 15 (3) | 2 (2) | 13 (4) |
| Deceased | 826 (52) | 237 (49) | 75 (59) | 162 (45) |
Continuous variables are reported as the median (first and third quartile); categorical variables are reported as frequencies and percentage.
Description of how assisted PD was received
| Variable | Assisted PD |
|---|---|
| (n = 128) | |
| PD starting year, median (IQR) | 2013 (2011–2015) |
| Proportion receiving self-care PD before assistance, n (%) | 58/128 (45) |
| PD initiation before 2011,an (%) | 26/26 (100) |
| PD initiation after 2011, n (%) | 32/102 (31) |
| Monthsb of self-care PD before assistance, median (IQR) | 22.2 (10.5–35.7) |
| PD initiation before 2011a | 41.9 (26.6–58.3) |
| PD initiation after 2011 | 1.28 (0.33–7.34) |
| Months of assistance, median (IQR) | 3.98 (0.84–19.25) |
| Next recorded modality, n (%) | |
| PD | 75 (58) |
| Remaining on assisted PD | 40 (31) |
| Self-care PD | 35 (27) |
| HD | 25 (20) |
| Transplant | 2 (2) |
| Deceased | 26 (20) |
Continuous variables are reported as the median (first and third quartile); categorical variables are reported as frequencies and percentage.
PD initiation before 2011 was only self-care PD as the assistance service was not available.
Duration in months of patients who had self-care PD before assistance.
Number of patients at risk, starting PD and having assisted PD by year of RRT start
| RRT starting year | Number of patients | ||
|---|---|---|---|
| Starting RRT | Starting PD,an (%) | Starting assisted PD,bn (%) | |
| 2002 | 88 | 44 (50) | 0 (0) |
| 2003 | 74 | 31 (42) | 2 (3) |
| 2004 | 102 | 40 (39) | 0 (0) |
| 2005 | 74 | 25 (34) | 1 (1) |
| 2006 | 86 | 32 (37) | 1 (1) |
| 2007 | 96 | 27 (28) | 5 (5) |
| 2008 | 98 | 19 (19) | 2 (2) |
| 2009 | 128 | 22 (17) | 5 (4) |
| 2010 | 107 | 28 (26) | 10 (9) |
| 2011 | 105 | 40 (38) | 30 (29) |
| 2012 | 84 | 26 (31) | 7 (8) |
| 2013 | 127 | 34 (27) | 10 (8) |
| 2014 | 130 | 44 (34) | 17 (13) |
| 2015 | 139 | 34 (25) | 19 (14) |
| 2016 | 138 | 36 (26) | 19 (14) |
Values are expressed as the number (percentage) of all patients.
Number of patients starting PD (including assisted PD), over the study period, by RRT starting year.
Number of patients starting assisted PD, over the study period, by RRT starting year.
Assisted PD availability as a time-varying explanatory variable
Adjusting for the other explanatory variables, assisted PD service being available was strongly associated with an increased rate of PD initiation [cs-HR 1.78, 95% confidence interval (95% CI) 1.21–2.61]. The RRT start year, age, male gender and primary renal disease ‘other’ were associated with the outcome. The interaction between gender and age was significant, with the difference between males and females becoming smaller for each year older (Table 4). The analysis with RRT start year expressed as a linear term provided similar results (cs-HR 1.98, 95% CI 1.39–2.81).
Association between the availability of assisted PD and the hazard rate of PD initiation, adjusting for patient characteristics
| Explanatory variable | cs-HR (95% CI) |
|---|---|
| Assisted PD availability | 1.78 (1.21–2.61)* |
| RRT starting time (FP)a | x + x2 ** |
| Age (per 10-year increase) | |
| Male | 0.76 (0.70–0.82)** |
| Female | 0.64 (0.54-0.77)** |
| Gender | |
| Female | Reference |
| Male | 0.39 (0.20–0.74)* |
| Ethnicity | |
| White | Reference |
| Non-white | 0.97 (0.65–1.43) |
| Primary renal disease | |
| Diabetes | Reference |
| Glomerulonephritis | 0.89 (0.66–1.20) |
| Renal vascular disease | 0.96 (0.71–1.29) |
| Polycystic | 1.07 (0.73–1.56) |
| Pyelonephritis | 0.89 (0.59–1.33) |
| Uncertain aetiology | 1.14 (0.83–1.57) |
| Other | 0.59 (0.42–0.83)* |
Adjusted analysis with a time-varying explanatory variable Cox regression model.
RRT starting time expressed as FP: initial decrease of the cs-HR of PD initiation. From 2014, the curve flattened, corresponding to a stabilization in PD initiation rates at a cs-HR of 0.33.
*P < 0.01, **P < 0.001.
PD initiation rates over time with and without assisted PD
In the analysis including assisted PD as an outcome, more recent RRT start year was strongly associated with the reduction in initiation of PD, whether included in the model as a categorical explanatory variable (Supplementary data, Figure S2) or an FP (Supplementary data, Figure S1 and Table S1).
When excluding patients starting assisted PD from the outcome of interest, only 356 patients (22%) started PD during the study period. As shown in Supplementary data, Figure S2, the cs-HR evolution over time followed a similar pattern as when assisted PD was included in the event of interest, but the curves diverge sharply when the assisted PD service was introduced and then stay approximately parallel. In both models, the decreasing hazard rates of starting PD flattened from 2010, with an average cs-HR of 0.60 when including assisted PD compared with an average cs-HR of 0.40 when excluding assisted PD. This pattern is also observed when considering 95% confidence regions for the cs-HRs as shown in Supplementary data, Figure S2.
Impact of changes in competing events on PD initiation
In unadjusted Cox regression models, RRT start year (linear term) was associated with a decreased rate of PD initiation and death and an increased rate of transplantation, with a cs-HR for each 1-year increase of 0.97 (95% CI 0.95–0.99), 0.98 (95% CI 0.96–0.99) and 1.08 (95% CI 1.04–1.13), respectively.
In unadjusted competing risks models, the RRT start year was associated with a decreased cumulative incidence of PD initiation and death and a higher cumulative incidence of transplant [sd-HR for 1-year increase of 0.97 (95% CI 0.95–0.99), 0.95 (95% CI 0.93–0.97) and 1.05 (95% CI 1.02–1.08), respectively]. The results of the adjusted analysis for Cox and competing risks regression are shown in Table 5. If transplantation only was considered as a competing event to PD initiation, the sd-HR for RRT start year to PD initiation rose to 0.96 (95% CI 0.94–0.97), as well as to transplant, 1.04 (95% CI 1–1.08).
Adjusted cs-HRs (Cox model) and sd-HR (Fine and Gray model) for each event
| Explanatory variable | PD | Transplant | Death | |||
|---|---|---|---|---|---|---|
| cs-HR (95% CI) | sd-HR (95% CI) | cs-HR (95% CI) | sd-HR (95% CI) | cs-HR (95% CI) | sd-HR (95% CI) | |
| RRT starting time (linear, for a 1-year increase) | 0.95 (0.93–0.98)*** | 0.95 (0.94–0.97)*** | 1.07 (1.02–1.12)** | 1.03 (0.99–1.07) | 1.03 (1–1.07) | 0.98 (0.95–1) |
| Age (for a 10-year increase) | 0.85 (0.80–0.90)*** | 0.88 (0.83–0.92)*** | 0.48 (0.43–0.54)*** | 0.53 (0.49–0.58)*** | 1.60 (1.44–1.77)*** | 1.89 (1.72–2.08)*** |
| Gender | ||||||
| Female | Reference | Reference | Reference | Reference | Reference | Reference |
| Male | 0.99 (0.81–1.21) | 1 (0.84–1.19) | 1.46 (1–2.10) | 0.62 (0.43–0.89)* | 1.02 (0.81–1.27) | 1.16 (0.93–1.45) |
| Ethnicity | ||||||
| White | Reference | Reference | Reference | Reference | Reference | Reference |
| Non-white | 1 (0.69–1.48) | 1 (0.72–1.39) | 1.08 (0.62–1.86) | 1.16 (0.69–1.95) | 0.85 (0.49–1.46) | 0.74 (0.44–1.26) |
| Primary renal disease | ||||||
| Diabetes | Reference | Reference | Reference | Reference | Reference | Reference |
| Glomerulonephritis | 0.84 (0.61–1.15) | 0.87 (0.67–1.13) | 1.15 (0.67–1.99) | 1.47 (0.85–2.55) | 0.52 (0.35–0.77)*** | 0.59 (0.41–0.85)** |
| Renal vascular disease | 0.94 (0.68–1.29) | 0.96 (0.73–1.27) | 0.79 (0.37–1.66) | 0.85 (0.40–1.79) | 0.72 (0.53–0.99)* | 0.71 (0.53–0.96)* |
| Polycystic | 1 (0.68–1.47) | 1 (0.72–1.39) | 2.94 (1.68–5.13)*** | 3.65 (2.15–6.20)*** | 0.26 (0.11–0.58)** | 0.22 (0.10–0.50)*** |
| Pyelonephritis | 1.08 (0.72–1.60) | 1.04 (0.75–1.44) | 1.16 (0.53–2.54) | 1 (0.42–2.39) | 0.71 (0.44–1.14) | 0.70 (0.44–1.12) |
| Uncertain aetiology | 1.16 (0.84–1.62) | 1.16 (0.87–1.53) | 1.30 (0.67–2.53) | 1.32 (0.68–2.55) | 0.92 (0.62–1.37) | 0.61 (0.41–0.88)* |
| Other | 0.60 (0.42–0.86)** | 0.63 (0.46–0.87)** | 1.17 (0.66–2.08) | 1.32 (0.75–2.29) | 1.07 (0.77–1.48) | 1.30 (0.92–1.82) |
P < 0.05, **P < 0.01, ***P < 0.001.
For all models, comparative analyses defining PD initiation as PD treatment lasting over 90 days provided equivalent results, so are not described further.
DISCUSSION
We have provided the first description of the impact of the provision of an assisted PD service on PD usage in a UK centre, with an ∼80% increase in the uptake, reducing the fall in PD rates over time. These changes appear to be independent of changes in competing events over time, and of changes in age, gender, ethnicity and primary renal disease. Older patients seemed to benefit most from the assistance service.
The change was greatest in the year the assisted service was introduced, which has now settled down to a slightly lower steady state of assisted PD use (Table 3).
In the UK, there is significant variation between centres in the use of PD, largely driven by differences in the proportions initiating dialysis with PD, which ranges from 6.3% to 49.7% [27]. Some of this centre variation may be due to different approaches to the provision of assisted PD. In the UK, assisted PD generally refers to when a healthcare professional provides assistance, and family members providing assistance is usually recorded as self-care PD. Usually, the trained healthcare assistant will set up the automated PD equipment, but not connect or disconnect the PD catheter to the machine. Assisted PD can be used in different ways, for example as a temporary measure during the training period before becoming independent, either in the context of acute start PD or where the patients and their carers lack confidence, or as a permanent measure for elderly patients who have barriers to self-care PD [29]. In France, Canada and the Netherlands, assistance is provided by a community nurse or a trained family member, who will connect and disconnect the catheter to the machine, and it can be used for continuous ambulatory PD as well as automated PD [22–25]. It is not clear what other models are used internationally. The type of assistance, either by a trained health-care or a family member, is not always provided in national registers, making national and international comparisons difficult.
It would be anticipated that provision of an assisted PD service, by removing some of the barriers to home dialysis, should increase the number of patients eligible for PD. In one Canadian study, availability of home-care assistance was associated with an odds ratio of 1.4 for PD usage, but the numbers in this study were smaller (134 incident patients), with significant imprecision in the effect estimate making the results highly uncertain. Our study, considering 723 patients incident to RRT while assisted PD was available, provides greater precision in the effect estimate. The relative effect of assisted PD availability will also vary according to the absolute rate of PD usage, and during the Canadian study ∼37% of patients started PD without assistance, compared with ∼20% in our study [22]. In a more recent study from the same centre, in a region where all patients had access to assistance, the impact of family support on PD utilization was assessed. Family support was associated with a significant increase in PD eligibility, from 63% to 80% in patients with barriers to self-care PD, and an increase in choice of PD (40–57%), resulting in an increase in PD utilization from 23% to 39% (P = 0.009) [23].
The prevalence of PD has been declining in the UK in recent decades, albeit with wide variation between centres [1, 2, 27, 29]. Our centre is following a similar pattern, although the decline seems to have arrested, with the adjusted Cox regression results indicating that the proportion of patients initiating PD remained approximately the same since 2010, independent of the introduction of the assisted service. The assisted PD service did have a significant impact on PD usage, causing a sharp increase at the time of introduction with this higher rate being maintained once the service was established. This is illustrated graphically in Supplementary data, Figure S2. Assisted PD services need to be monitored closely to maximize their impact, so that their use remains stable over time. Of note, the programme did not help with connection to cyclers, which may have limited its impact.
Transplantation, as shown by the adjusted Cox model, increased over the study period, whilst death rates may have decreased slightly. Accounting for the overall effect of these two competing events with a Fine and Gray model did not change the impact of start year on PD initiation [sd-HR 0.95 (0.94–0.97) compared with cs-HR 0.95 (0.93–0.98); Table 5]. Rising transplant rates have been thought to explain some of the fall in PD usage in the UK, but this analysis suggests that competing events are not the primary driver in our centre.
Older age was also associated with a decreased probability for PD initiation, likely a reflection of increased comorbidity, frailty and dependency. Similar findings have been described in the Netherlands: patients aged >70 years old were six times more likely to choose HD over PD than patients aged between 18 and 40 years [33]. In the UK, age was associated with a 2% decrease in odds of choosing PD therapy [34]. The effect of age was not consistent between the genders, with older age decreasing the chance of starting PD more in females. Similar results have been observed nationally [1, 2, 27], although the explanation for this phenomenon is not clear. In our study, older patients seemed to benefit most from the availability of assistance—patients who probably would not have started PD otherwise. Experience in the unit suggests that assisted PD was also of benefit to patients who would previously have started straight on self-care PD, where assisted PD allowed a more rapid discharge and/or provided an extended training period (27% of patients moved from assisted to self-care PD). This approach evolved over time, possibly explaining a slight increase in the proportion using assisted PD between 2012 and 2016.
The implications of our study are that widespread adoption of the provision of an assisted PD service would significantly increase PD initiation, particularly providing PD as an option for older, frailer patients, but it does not demonstrate the impact on prevalence, nor whether this is cost-effective. Assistance has been associated with a lower risk for technique failure or transplantation [24], but a higher risk for death as the patients were older and frailer. So it is possible that developing assisted PD services will increase PD prevalence, but mortality rates are likely to be high given the older, frailer population. Increasing self-care PD use in the UK from the actual incident rates to 40–50% would be significantly cost-effective [18], but whether the added cost of assisted PD would reduce the cost advantages over HD is not clear. A study in the Netherlands demonstrated that assisted PD in elderly patients is a cost-effective option [35]. Such a study will be needed in the UK to confirm these results.
Our findings appear to be robust in that numerous secondary analyses were performed: assessing the influence of the definition of PD initiation (>1 or 90 days of treatment), assessing the effect of assisted PD by inclusion as a time-varying explanatory variable or by changing the definition of the outcome, assessing the impact of competing events and adjusting for the effect of RRT start year as a linear effect, an FP or as a categorical variable. We also studied a sufficient time period to establish underlying trends, allowing a clearer assessment of the impact of introducing assisted PD.
Our study has limitations. We cannot prove causality in an observational study, and in particular, the estimated effect size relies on the assumption that patients who only perform assisted PD would not otherwise start PD, although our experience is that most patients who might have been able to perform PD independently do progress to full independence, which would minimize this bias. Our study is further limited by its single centre, retrospective design and clearly needs repeating in a prospective, multicentre cohort, such as a national registry. Further evaluation with a randomized controlled trial, while desirable from the perspective of gaining high-quality evidence, would be challenging. A cluster design would be required, with ethical concerns regarding withdrawing existing services from centres randomized to the control arm. Healthcare systems that currently do not provide assisted PD offer the opportunity to study its introduction using a step-wedge design, including a health economic analysis.
We do not have data on comorbidity for patients who did not have PD, although comorbidity is correlated with primary renal disease so is partially adjusted for. As with most studies, there was limited missing data, but multiple imputation is a robust strategy to minimize the bias and loss of power this can introduce. Due to difficulties in competing risks models of pooled imputed datasets, complete case analysis was used resulting in slightly wider CIs. Our usage of assisted PD might differ from other centres, reflecting a flexible approach to the use of assisted PD not confined to new starters only but responding to the changing needs of the patient, which could limit the generalizability of our results. However, the variability in usage of assisted PD in different units is poorly understood, and we are planning a study to characterize this. There were insufficient events to consider technique failure.
In conclusion, this study shows that, in our centre, introducing an assisted PD service that was monitored and sustained led to a significant increase in PD initiation, reducing the impact of the decline in PD usage over time. The finding that transplantation did not explain this fall in PD usage over time requires replication in a national cohort. The assisted PD service had the greatest impact on older, presumably frailer, patients, providing the benefits of home dialysis to a population that would otherwise miss out.
SUPPLEMENTARY DATA
Supplementary data are available at ndt online.
FUNDING
This study was funded by a grant of Université de Caen Normandie ‘Année recherche’.
CONFLICT OF INTEREST STATEMENT
The results of this article have not been published before, except in abstract format. M.L. reports speakers’ honoraria and travel sponsorships from Baxter Healthcare and Fresenius Medical Care, as well as a consultancy fee from NxStage Medical and a research grant from Baxter Healthcare. S.J.D. reports speakers’ honoraria from Fresenius Medical Care and Zytoprotec, and a research grant from Baxter Healthcare. No other co-authors report any potential conflicts of interest. The items documented here were in no way related to any part of the research or results contained or presented in this manuscript, although they may be perceived to be.
(See related article by Van Biesen and Lameire. Increasing peritoneal dialysis initiation worldwide: ‘there are none so blind as those who will not see’. Nephrol Dial Transplant 2020; 35: 1458--1461)
REFERENCES
Annual Report on Kidney Transplantation Report for 2016/2017. Published June 2017 with the NHS. https://nhsbtdbe.blob.core.windows.net/umbraco-assets-corp/4607/kidney-annual-report-2016-17.pdf (19 December 2019, date last accessed)


Comments