


Abstract
Pre-dialysis systolic blood pressure (pre-HD SBP) and peridialytic SBP change have been associated with morbidity and mortality among hemodialysis (HD) patients in previous studies, but the nature of their interaction is not well understood.
We analyzed pre-HD SBP and peridialytic SBP change (calculated as post-HD SBP minus pre-HD SBP) between January 2001 and December 2012 in HD patients treated in US Fresenius Medical Care facilities. The baseline period was defined as Months 4–6 after HD initiation, and all-cause mortality was noted during follow-up. Only patients who survived baseline and had no missing covariates were included. Censoring events were renal transplantation, modality change or study end. We fitted a Cox proportional hazard model with a bivariate spline functions for the primary predictors (pre-HD SBP and peridialytic SBP change) with adjustment for age, gender, race, diabetes, access-type, relative interdialytic weight gain, body mass index, albumin, equilibrated normalized protein catabolic rate and ultrafiltration rate.
A total of 172 199 patients were included. Mean age was 62.1 years, 61.6% were white and 55% were male. During a median follow-up of 25.0 months, 73 529 patients (42.7%) died. We found that a peridialytic SBP rise combined with high pre-HD SBP was associated with higher mortality. In contrast, when concurrent with low pre-HD SBP, a peridialytic SBP rise was associated with better survival.
The association of pre-HD and peridialytic SBP change with mortality is complex. Our findings call for a joint, not isolated, interpretation of pre-HD SBP and peridialytic SBP change.
INTRODUCTION
Cardiovascular (CV) mortality remains the most common cause of death among hemodialysis (HD) patients [1, 2]. In the general population, high blood pressure (BP) is associated with higher CV risk [3, 4]. Hypertension is common among HD patients with a prevalence between 60% and 90% [5], and has been associated with increased CV morbidity and mortality [6]. Yet, the association between BP and outcomes in the dialysis population is somewhat controversial [1, 7–9]. Foley et al. [10] reported that both high and low pre- and post-HD BP were associated with increased mortality among patients with end-stage kidney disease undergoing dialysis.
Absence of an accepted, ‘normal’ BP range for dialysis patients is a major barrier for developing definitions for BP-related clinical outcomes. A major concern is the timing of the measurement of clinically actionable BP. While some experts advocate for interdialytic BP measurements (home BP; ambulatory BP monitoring), others favor in-center BP measurements (pre-HD; post-HD; peridialytic BP change) for clinical decision-making. The problem is further compounded by the lack of definitive evidence as to which of these BP measurements are more strongly associated with outcomes [1, 8]. To date, pre- and post-HD BP levels form the basis of the National Kidney Foundation’s Kidney Outcomes Quality Initiative (KDOQI) guidelines [11]. While conflicting data exist, more studies based on large cohorts of patients show elevated mortality in patients with low—rather than high—pre-HD BP, particularly low systolic BP (SBP) [12–15]. To further complicate matters, some large epidemiologic studies using peridialytic SBP change (defined as post-HD minus pre-HD SBP) have shown a U-shaped association with adverse outcomes [13, 16–18].
Although during HD a decline in BP is seen in the majority of cases, a peridialytic SBP increase can occur in up to 15% of prevalent HD patients and has been associated with adverse outcomes [18–20]. Park et al. [16] reported that both large peridialytic SBP falls and rises were associated with higher mortality.
The pathophysiology of both increases and decreases of BP, as well as intradialytic BP variability, is not fully understood and is mostly multifactorial. Factors associated with the development of intradialytic hypotension include, next to fluid removal during dialysis, an impaired vasoreactivity, a reduced sympathetic response, older age, atherosclerosis and poor cardiac reserve [21, 22]. Intradialytic hypertension has been associated with chronic fluid overload, increased peripheral vascular resistance (PVR) and intradialytic hypoxemia [23], among others [24, 25].
Despite a notable literature regarding pre-HD SBP and peridialytic SBP changes, the nature of the interaction between pre-HD SBP and peridialytic SBP changes with outcomes has not yet been investigated. We hypothesize that both are physiologically linked and hence should not be studied in isolation. Therefore, we embarked on research to explore their combined association with all-cause mortality in a large and diverse US HD population.
MATERIALS AND METHODS
Population and study design
This multi-center observational study was conducted in a cohort of HD patients dialyzed between January 2001 and December 2012 in Fresenius Medical Care North America (FMCNA) clinics across the US. Baseline was defined as the period from Months 4–6 following HD initiation. Patient characteristics were assessed during baseline, and all-cause mortality was recorded during follow-up. Censoring events were changes in treatment modality, renal transplantation, loss to follow-up and end of study period (31 December 2012). Only patients who survived baseline and had no missing covariates were included. The New England Institutional Review Board (#14-446) waived the need for informed consent.
BP measurements
Patients visited dialysis facilities on average three times per week, and had their BP measured before each treatment in a sitting position per the standard protocol using an automated stand-alone device or one integrated in the HD machine with an appropriately sized pressure cuff around the nonaccess upper arm positioned at heart level. Post-HD BP was taken after the extracorporeal circuit was rinsed, with the patient in a sitting position, following the same protocol. We calculated peridialytic SBP changes as post-HD SBP minus pre-HD SBP.
Clinical and laboratory data
Laboratory measurements were done centrally in two facilities (Spectra Laboratories, New Jersey, NJ and Milpitas, CA, USA) and downloaded to the FMCNA data warehouse and subsequently extracted to the study database.
Comorbidities
Diabetes mellitus (DM) and congestive heart failure (CHF) were defined using ICD-9 codes documented in the patients’ electronic health records.
Statistical analysis
Descriptive statistics comprised mean [standard deviation (SD)] for continuous variables and percentages for categorical variables. The primary outcome was all-cause mortality. We fitted several Cox proportional hazard models: (i) two models with univariate spline terms for pre-HD SBP and peridialytic SBP, respectively, and (ii) one model with bivariate spline terms for pre-HD SBP and peridialytic SBP. The model with bivariate spline terms was adjusted for age, gender, race, DM, type of vascular access, interdialytic weight gain normalized to post-HD body weight, body mass index, albumin, equilibrated normalized protein catabolic rate and ultrafiltration rate (UFR).
Sensitivity analyses
Since the presence or absence of CHF could affect pre-HD SBP and the peridialytic SBP change, we conducted two sensitivity analyses, one in patients without documented CHF and one in CHF patients.
RESULTS
Patient baseline characteristics
Our study population included 172 199 patients. Mean age was 62.1 years, 61.6% were white, 55% were male, 64.2% had DM, 31.9% had CHF and 29.9.% were using central venous catheter as vascular access. Basline characteristics of all patients and those with and without CHF, respectively, are shown in Table 1.
Baseline characteristics of the study cohort and after stratification into two groups based on the presence of CHF
| Variable | All patients | Without CHF | With CHF |
|---|---|---|---|
| Number of patients | 172 199 | 117 238 | 54 961 |
| Age, years | 62.1 ± 14.8 | 60.9 ± 15.2 | 64.8 ± 13.6 |
| Gender, male, % | 55.1 | 55.8 | 53.7 |
| Race, White, % | 61.6 | 61.0 | 62.8 |
| Diabetic, % | 64.2 | 61.4 | 70.2 |
| CHF, % | 31.9 | N/A | N/A |
| Central venous catheter as vascular access, % | 29.9 | 29.2 | 31.2 |
| Pre-dialysis SBP, mmHg | 149.6 ± 19.3 | 150.0 ± 18.8 | 148.7 ± 20.3 |
| Post-dialysis SBP, mmHg | 139.6 ± 17.2 | 139.7 ± 16.9 | 139.3 ± 17.6 |
| Peridialytic SBP change (= post-SBP − pre-SBP), mmHg | −10.0 ± 13.9 | −10.4 ± 13.8 | −9.4 ± 14.2 |
| UFR, mL/kg/h | 9.1 ± 3.3 | 9.0 ± 3.3 | 9.4 ± 3.3 |
| Body mass index, kg/m2 | 28.3 ± 7.6 | 28.2 ± 7.5 | 28.7 ± 7.8 |
| Interdialytic weight change, percentage of post-HD weight | 3.3 ± 1.2 | 3.3 ± 1.2 | 3.4 ± 1.2 |
| Serum albumin, g/dL | 3.7 ± 0.4 | 3.7 ± 0.4 | 3.7 ± 0.4 |
| enPCR, g/kg/day | 0.9 ± 0.2 | 0.9 ± 0.2 | 0.9 ± 0.2 |
Data are expressed as mean ± SD or percentage.
enPCR, equilibrated normalized protein catabolic rate; N/A, not applicable.
BP characteristics
Pre-HD and post-HD SBP were 149.6 ± 19.3 and 139.6 ± 17.2 mmHg, respectively. Peridialytic SBP change was −10.0 ± 13.3 mmHg, A rise of peridialytic SBP was seen in 22.8% of the patients, and 6% showed an increase >10 mmHg.
Association of pre-dialysis SBP and peridialytic SBP change with all-cause mortality
The median follow-up was 25.0 months. During follow-up, 73 529 patients (42.7%) died. In Cox models with univariate spline terms a pre-HD SBP ≤138 mmHg (Figure 1) and a peridialytic SBP change greater than −6.9 mmHg (Figure 2) were associated with increased all-cause mortality.
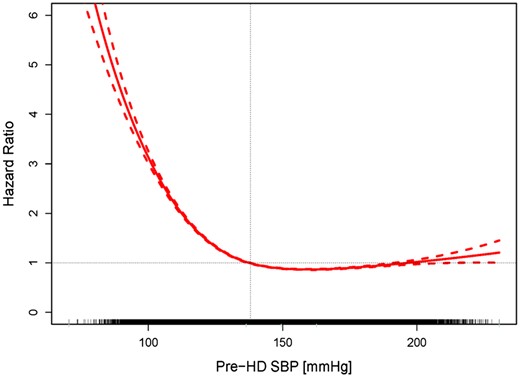
Association between pre-HD SBP and all-cause mortality. Mean hazard ratios (HRs, solid line) and 95% confidence bounds (dotted lines) are shown. A pre-HD SBP <138 mmHg (vertical line) is associated with an HR >1.0 for all-cause mortality. The ticks on the x-axis represent individual patients.

Association between peridialytic SBP change and all-cause mortality. Mean hazard ratios (HRs, solid line) and 95% confidence bounds (dotted lines) are shown. A peridialytic SBP decline of <6.9 mmHg (vertical line) is associated with an HR >1.0 for all-cause mortality. The ticks on the x-axis represent individual patients.
The joint association of pre-HD SBP and peridialytic SBP change with all-cause mortality was more complex (Figure 3). We identified a general trend, namely an increased mortality in patients with either high pre-HD SBP and concurrent peridialytic SBP increase, or in patients with low pre-HD SBP and concurrent peridialytic SBP decline.
![Contour plot showing the bivariate joint association of pre-HD SBP and peridialytic SBP change with all-cause mortality. The results of this analysis are shown as a contour plot that can be read like a topographic map. It presents 3D features in a 2D plot, where the first dimension (in our case, pre-HD SBP) is represented on the x-axis, the second dimension (peridialytic SBP change) on the y-axis and the third dimension [hazard ratios (HRs)] as ‘altitude’. Levels of HRs are indicated in assorted colors from yellow to red; the black lines indicate identical HRs (e.g. 0.9, 1.2, 1.5, etc.), akin to altitude contour lines in maps. The dashed vertical lines at 110, 130, 160 and 180 mmHg refer to the cross-sectional pre-HD SBP levels shown in Figure 4.](https://oup.silverchair-cdn.com/oup/backfile/Content_public/Journal/ndt/35/9/10.1093_ndt_gfz289/4/m_gfz289f3.jpeg?Expires=1750288211&Signature=ghljGCcyoW-pqcWVRNwL9l8186LxLIubeIR~NdlShL3yWK7eCsEabBJgTmftd5T1gynoRE3fPVaqwGEB8ZhvRMvQc1R4VWUqbjGhnQLd96B0QVLfV4iJTHkrG-ibfl3SBaxRKzTbSV2eByML-VYdSH0C-NBXzkkj-FBPnxWKmDN7VotiAcsRDw7n2CHNyt878DrYkKhG5PZEV4VGTN-PfHR3qPEgRkBtD2emMJsbwaGY9cnugxq8F2kH9czhqvFXJAfi9lhetw3eMCjq2OhZHM1Fm-GAD1HkV9PJnGlVyUCVzHSE~CcW0JueVJ~jrgNerzf0cKOcbYq5z5esL6W5pw__&Key-Pair-Id=APKAIE5G5CRDK6RD3PGA)
Contour plot showing the bivariate joint association of pre-HD SBP and peridialytic SBP change with all-cause mortality. The results of this analysis are shown as a contour plot that can be read like a topographic map. It presents 3D features in a 2D plot, where the first dimension (in our case, pre-HD SBP) is represented on the x-axis, the second dimension (peridialytic SBP change) on the y-axis and the third dimension [hazard ratios (HRs)] as ‘altitude’. Levels of HRs are indicated in assorted colors from yellow to red; the black lines indicate identical HRs (e.g. 0.9, 1.2, 1.5, etc.), akin to altitude contour lines in maps. The dashed vertical lines at 110, 130, 160 and 180 mmHg refer to the cross-sectional pre-HD SBP levels shown in Figure 4.
To translate the complex nonlinear associations depicted in Figure 3 into clinically more applicable discrete SBP levels, we analyzed four distinct pre-HD SBP levels (110, 130, 160 and 180 mmHg) (Figure 4). In patients with low pre-HD SBP (110 mmHg), any degree of peridialytic SBP increase was associated with better survival, while a peridialytic SBP decrease was associated with increased mortality. In the presence of a ‘normal’ pre-HD SBP (130 mmHg), a peridialytic SBP decrease of <30 mmHg was not associated with increased mortality, whereas a peridialytic SBP increase was associated with decreased mortality. In patients with a higher pre-HD SBP (160 and 180 mmHg, restrictively), a peridialytic SBP increase was associated with increased mortality, whereas a peridialytic SBP decrease was associated with better survival.
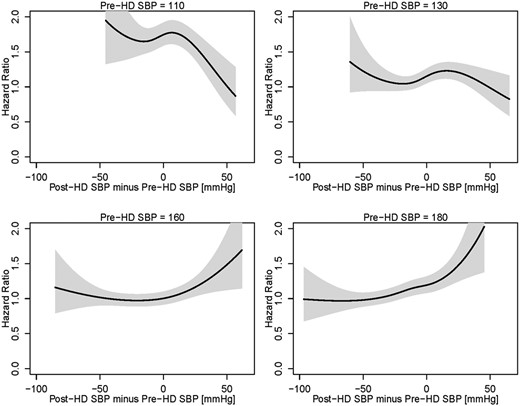
Hazard ratios (HRs) as a function of peridialytic SBP changes at four distinct levels of pre-HD SBP. The black lines indicate the HRs, the gray areas indicate respective 95% confidence intervals.
Adjusted multivariate Cox analysis corroborated these results.
Sensitivity analyses
The sensitivity analyses in patients with and without CHF, respectively, showed directionally equivalent results (Supplementary data, Figures S1–S4).
DISCUSSION
Our study explored the joint association of pre-HD SBP and peridialytic SBP changes with all-cause mortality in >170 000 US HD patients. The results clearly indicate that pre-HD and peridialytic SBP change should be interpreted jointly, because the same pre-HD SBP can be associated with either increased or decreased mortality, depending on the direction and degree of peridialytic SBP change. We showed that in the presence of lower pre-HD SBP, a peridialytic SBP rise is beneficial, while a further peridialytic SBP decline is unfavorable.
Despite decades of research into the association between BP and outcomes in chronic HD, many basic questions have not been resolved. Unlike the clear association with high BP and CV outcomes in the general population, studies in HD patients showed conflicting results, and a generally accepted target BP is still unknown [26–29]. BP recordings obtained before or after HD sessions showed high variability [30], poor reproducibility and agree poorly with interdialytic ambulatory BP. Out-of-center BP measurements provided superior prognostic information compared with in-center BP [31]. Clinical studies indicate that ambulatory BP monitoring (ABPM) is predictive of left ventricular hypertrophy (LVH) and hard patient outcomes [32]. Unfortunately, ABPM has not been utilized on a large scale in HD patients, primarily because of logistic and financial constraints. Home BP measurement provides a valuable alternative [33–35], but has gained only limited traction. A single-center cross-sectional study showed that home BP was superior to pre-HD BP in predicting LVH [35]. Although both ABPM and home BP appear to have advantages over in-center BP, they may not be feasible to use for most dialysis patients.
In-center BP measurements are the standard-of-care, and pre- and post-HD BP measurements and are recommended by KDOQI guidelines [11]. However, conflicting results regarding their association with mortality have been reported. Port et al. [14] analyzed 4839 prevalent HD patients in the US Renal Data System case-mix adequacy study and found that both pre- and post-HD SBP <120–149 mmHg were associated with increased mortality, whereas only post-dialysis SBP hypertension (>180 mmHg) was associated with increased mortality. Other observational studies have identified a ‘U-shaped’ or ‘reverse J-shaped’ relationship between BP and mortality, with the highest mortality risk at lower pre- and post-HD SBP (generally <130 mmHg) and only a slight mortality increase, if any, at higher SBP levels (>180 mmHg) [8, 13, 14, 17]. These differences in outcomes with pre- and post-HD SBP levels may be due to the different mechanisms influencing SBP changes during HD. BP dynamics in HD patients are complex, affected by time on dialysis, comorbidities, baseline cardiac function, fluid status, medication, sodium load and other factors that interplay with one another [36].
Peridialytic SBP increase, also called ‘intradialytic hypertension’ when >10 mmHg, has been recognized as a predictor of outcomes [37]. Park et al. [16] studied 113 255 US HD patients from 2001 to 2006 and found a U-shaped relationship between peridialytic SBP changes and all-cause and CV mortality, respectively. The best survival was seen with moderate declines in SBP (−30 to 0 mmHg), whereas SBP declines by >30 mmHg and any peridialytic SBP increase were associated with higher mortality. Of note, in a subgroup analysis with stratification by pre-HD SBP (<120, 120–140, 140–160, >160 mmHg) the authors found that this U-shaped relationship between peridialytic SBP change and mortality was not seen in patients with pre-HD SBP <120 mmHg; in these patients, a peridialytic SBP rise was not associated with survival. However, the authors identified an increased mortality in those patients in the event of a peridialytic SBP decline.
In a post hoc analysis of 443 patients from the Crit-Line Intradialytic Monitoring Benefit Study, Inrig et al. [18] found that patients whose SBP rose or failed to decline during HD had a 2-fold increase in nonaccess-related hospitalization and death at 6 months compared with patients with a peridialytic SBP fall. These results were validated in a sensitivity analysis where the authors excluded patients with a pre-HD SBP <140 mmHg. Our results essentially corroborate these findings in patients with a high pre-HD SBP. In the presence of a pre-dialysis SBP of 130 mmHg, a peridialytic SBP decrease of <30 mmHg was not associated with increased mortality, whereas a peridialytic SBP increase was associated with better outcomes. On the other hand, when the pre-dialysis SBP was 110 mmHg, a further peridialytic SBP decrease was associated with increased mortality, whereas a peridialytic SBP increase was associated with better outcomes.
BP behavior during HD is influenced by a variety of patient-related factors, such as comorbidities, autonomic dysfunction, stiff vasculature, impaired vasoreactivity, antihypertensive medications; and procedural factors including UFR, dialysate concentrations of sodium and calcium [23, 36]. The reaction of the resistance and capacitance of vessels during a decline in blood volume may be impaired during HD [28, 36, 38]. BP changes also occur because of a decline in preload, impaired cardiac response and reduced constriction of resistance and capacitance vessels. Depending on patient- and treatment-related factors, the relative importance of these factors may vary and are difficult to discern for a given patient without detailed physiological studies.
Our study helps us to better understand the effect of BP behavior during HD, as we identified a subset of patients that could in fact benefit from SBP increases during HD, namely those patients with a low pre-HD SBP. In these patients, a pre-existing low pre-HD SBP may reflect a worse CV condition, autonomic dysfunction or an inappropriately low target weight. Patients with low pre-HD SBP who can increase SBP during HD likely represent a phenotype that is able to mount a sufficient hemodynamic response in the face of ultrafiltration and declining blood volume. This hemodynamic response may identify patients with a better overall CV state that eventually translates into better survival.
On the other end of the spectrum, patients with a high pre-HD SBP may suffer from chronic fluid overload and vascular stiffness [25, 39, 40]. In these patients, a further peridialytic SBP increase could reflect poor fluid removal. Recent studies using bioimpedance measurements have demonstrated that patients with intradialytic SBP rise were fluid overloaded and had a higher extracellular-to-total body water ratio [24, 25, 41]. These patients would benefit from a more intensive fluid removal. Agarwal et al. [42] showed in the Dry-weight Reduction In hypertensive hemodialysis Patients (DRIP) study that the dry-weight probing with more intensive ultrafiltration lowered both pre-dialysis BP and ambulatory BP within 4 weeks. Patients whose dry-weight decreased the most during the study changed from flat intradialytic BP slopes at baseline to steep declines at the end of the trial. In some hypertensive HD patients, BP rises further during ultrafiltration. Cirit et al. [43] investigated seven such patients and found that all had marked cardiac dilatation. The authors hypothesized that in these patients, the SBP rise in the face of ultrafiltration is due to a change in the Starling curve and improved cardiac mechanics. Later findings by Gunal et al. [44] supported that hypothesis. A putative role in the pathogenesis of peridialytic hypertension has been attributed to the dialysate-to-plasma sodium gradient (GNa+). Movilli et al. [23] studied the association between GNa+ and peridialytic SBP changes after a long interdialytic interval in 206 prevalent HD patients. The authors found that intradialytic SBP increase was positively and independently associated with GNa+. Similar results were observed by Keen et al. [45] in 58 HD patients. Another string of evidence posits that a rise in SBP during HD could be the consequence of increased PVR. Comprehensive hemodynamic and biochemical studies by Chou et al. [46] in 30 patients prone to intradialytic hypertension and 30 age- and sex-matched controls found that patients with intradialytic hypertension were characterized by inappropriately increased PVR through mechanisms that did not involve sympathetic stimulation or renin activation but were possibly related with an altered NO/ET-1 balance. Other studies have also implicated an imbalance of vasoconstrictors and vasodilators [37, 47, 48] or intradialytic hypoxemia [23] as factors causally associated with a rise of PVR during HD.
There are good reasons to assume that patients with CHF may show different associations between pre-HD SBP, intradialytic SBP changes and all-cause mortality. Therefore, we conducted two sensitivity analyses in patients with and without CHF, respectively. Of note, these sensitivity analyses showed directionally equivalent results compared to the entire population.
Our study has several strengths, the first and foremost are its large and diverse HD population, the substantial number of baseline HD treatments per patient, standardized care protocols, automated BP recordings and the long follow-up period.
We acknowledge the fact that our study has limitations. First, it is an observational study, preventing us from making causal inferences. Second, our data are by no means comprehensive: we lack records of intradialytic interventions that may have impacted post-HD SBP, such as change in UFR or fluid infusion, and we have no documentation of antihypertensive medication prescription and use. Third, objective indicators of fluid status (e.g. bioimpedance) are not available in the USA; these would allow a more extensive probing into the relationship between peridialytic SBP changes and fluid status. Likewise, we lack comprehensive data on the GNa+. Lastly, residual renal function is not documented in our database.
In conclusion, our study reports a joint association between pre-HD SBP levels and peridialytic SBP changes with all-cause mortality. It shows for the first time that increases in SBP during HD could be beneficial in patients with low pre-HD SBP. These findings could help to identify different patient phenotypes and facilitate the development of more patient-specific HD treatment modalities. To further our understanding of the underlying pathophysiology, specifically designed prospective studies with concurrent biochemical and physiological measurements are warranted.
SUPPLEMENTARY DATA
Supplementary data are available at ndt online.
AUTHORS’ CONTRIBUTIONS
H.Z., P.P., Y.W., J.P.K., F.M.v.d.S. and P.K. contributed to the design and implementation of the research. H.Z. analyzed the data. P.P. and H.Z. wrote the manuscript with input from all authors. P.K. directed the project. All authors provided critical feedback and helped shape the research, analysis and manuscript.
CONFLICT OF INTEREST STATEMENT
L.A.U., D.M., F.W.M. and P.K. hold stock in Fresenius Medical Care. The Renal Research Institute is a wholly owned subsidiary of Fresenius Medical Care. The remaining authors declare no competing interest. The results presented in this article have not been published previously in whole or part, except in abstract form.
(See related article by Ng et al. Haemodialysis, blood pressure and risk: at the limit of non-randomized evidence. Nephrol Dial Transplant 2020; 35: 1465--1468)
REFERENCES
Author notes
Hanjie Zhang and Priscila Preciado contributed equally to this work.


Comments