


Abstract
The prognostic relevance of health-related quality of life (HRQoL) has been scarcely studied in the dialysis population and the prognostic power for mortality of the HRQoL domains is unknown.
We tested the prognostic value for mortality of the HRQoL domains included in the 36-item Short Form Health Survey (SF-36) by Cox’s regression analysis and by state-of-the-art prognostic techniques {explained variation in mortality [R2], calibration, discrimination [Harrell’s C], risk reclassification [Net Reclassification Index (NRI)], Integrated Discrimination Index [IDI]} in a cohort of 951 patients on chronic haemodialysis.
In multivariable Cox models, all but two domains (role limitation due to physical health and due to emotional problems) were independently related with mortality. Physical functioning was the domain adding the highest explanatory power (R2+5.3%) to a basic model including established risk factors for mortality in the dialysis population. The same domain improved risk calibration and showed the highest Harrell’s C (+1.7%) and the highest reclassification power (categorical NRI + 8.7%, continuous NRI +46%, P ≤ 0.006) and the highest IDI (+3.4%, P < 0.001). These results were fully confirmed in analyses testing the additional prognostic power of SF-36 domains when combined to a well-validated risk score in dialysis patients.
Physical functioning holds the highest prognostic power for mortality among the domains of SF-36. The gain in prognostic ability by this domain is relevant for clinical practice. Physical functioning has the potential for refining the prognosis and for informing exercise programmes in the dialysis population.
INTRODUCTION
Patients with end-stage kidney disease (ESKD) are a frail population at very high risk for disability and poor health-related quality of life (HRQoL). These patients have a high burden of comorbidities, including cardiovascular disease, infection, cancer and other diseases, that ultimately cause a very high mortality rate [1, 2].
HRQoL in ESKD is of the same order as that observed in patients with severe chronic conditions like cancer and heart failure [3]. Systematic measurement of HRQoL is important to understand patients’ needs and to improve health care, and the Center for Medicare and Medicaid Services formally recommends that HRQoL be measured annually in the ESKD population [4]. HRQoL predicts mortality both in studies at the community level [5] and in chronic conditions like advanced liver disease [6], but to our knowledge there has been just one study focusing on the relationship between HRQoL and mortality in ESKD [7]. In this study, three domains of the Kidney Disease Quality of Life Short Form (KDQOL-SF), namely the physical, mental and kidney disease–related domains, were all independently related to the risk of death in analyses adjusting for demographic factors and major comorbidities. This observation suggests that metrics of HRQoL may help to identify pathophysiological and psychosocial factors to modify in order to improve health outcomes in ESKD patients. Although holding causal implications, this seminal study did not address the problem of whether assessment of HRQoL may help to refine the prognosis in ESKD patients. Testing the prognostic value of any purported predictor of adverse health outcomes, be it a biomarker or a metric of health status, demands that the same predictor adds prognostic power to predictions made on the basis of standard risk factors or on the basis of population-specific risk calculations [8, 9]. Until now, no study has been performed in the ESKD population to test the prognostic value of the HRQoL domains by state-of-the-art prognostic analyses, including calibration analysis [10], discrimination analysis (Harrell’s C) [11], the explained variation (R2) (an index combining calibration and discrimination) [12] and risk reclassification [12, 13].
In the present study we have therefore assessed whether the HRQoL domains of the 36-item Short Form Health Survey (SF-36) add prognostic information for mortality to the prediction made by a simple model based on established risk factors for death in the dialysis population and to the Analysing Data, Recognizing Excellence and Optimizing Outcomes (ARO) risk score, a recently developed risk calculator that has been externally validated in the Dialysis Outcomes and Practice Patterns Study (DOPPS) cohort [14].
MATERIALS AND METHODS
The study protocol had the approval of the ethical committee of our institution. All ESKD patients enrolled into the Prospective Registry of the Working Group of Epidemiology of Dialysis Region Calabria (PROGREDIRE) cohort, a study involving 35 dialysis units in two regions in southern Italy (Calabria and Sicily), were requested to give their informed consent before enrolment.
Study population
In this analysis we included 951 haemodialysis patients in stable clinical condition who completed the SF-36 questionnaire among the 1189 patients of the PROGREDIRE cohort. The 238 patients who did not fill out the SF-36 questionnaire did not differ from those who completed it for the variables listed in Table 1. Patients had been on regular haemodialysis for a median time of 3.7 years [interquartile range (IQR) 1.6–7.1]. These patients (n = 951) were being treated with standard bicarbonate dialysis with non-cellulosic membrane filters of various types. A total of 571 patients were treated with various anti-hypertensive drugs (253 on monotherapy with angiotensin-converting enzyme inhibitors, calcium channel blockers, α- and β-blockers, vasodilators, diuretics or other drugs; 174 on double therapy; 78 on triple therapy and 66 patients on quadruple or quintuple therapy with various combinations of these drugs). The main demographic, somatometric, clinical and biochemical characteristics of the study population are detailed in Table 1.
Main demographic, somatometric and clinical characteristics in the whole study population
| Characteristics | Study cohort (n = 951) |
|---|---|
| Age (years) | 65 ± 14 |
| BMI (kg/m2) | 25 ± 5 |
| Waist circumference (cm) | 98 ± 14 |
| Male sex, n (%) | 603 (63) |
| Smoker, n (%) | 134 (14) |
| Diabetic, n (%) | 259 (27) |
| Dialysis vintage (months), median (IQR) | 46 (21–88) |
| With cardiovascular comorbidities, n (%) | 489 (51) |
| Coronary heart disease,an (%) | 171 (18) |
| Heart failure, n (%) | 105 (11) |
| Cerebrovascular disease,bn (%) | 108 (11) |
| Peripheral vascular disease, n (%) | 185 (20) |
| On antihypertensive treatment, n (%) | 571 (60) |
| Systolic blood pressure (mmHg) | 135 ± 22 |
| Diastolic blood pressure (mmHg) | 74 ± 12 |
| Creatinine (mg/dL) | 9.3 ± 2.7 |
| Cholesterol (mg/dL) | 155 ± 39 |
| Haemoglobin (g/dL) | 11.2 ± 1.5 |
| Albumin (g/dL) | 3.9 ± 0.5 |
| C-reactive protein (mg/L), median (IQR) | 5.0 (2.9–12.7) |
| Phosphate (mg/dL) | 5.0 ± 1.6 |
| Vascular access, n (%) | |
| AV fistula/graft | 834 (88) |
| Catheter | 117 (12) |
| SF-36 domains, median (IQR) | |
| Physical functioning | 45 (20–75) |
| Role limitation due to physical health | 25 (0–100) |
| Role limitation due to emotional problems | 33 (0–100) |
| Energy/fatigue | 40 (25–55) |
| Emotional well-being | 56 (40–72) |
| Social functioning | 63 (38–88) |
| Pain | 55 (33–80) |
| General health | 30 (15–40) |
Data are expressed as mean ± SD unless stated otherwise. The blood pressure values are the average of the pre-dialysis measurements during the 2 weeks preceding the date of enrolment. aPast myocardial infarction or angina, coronary angioplasty or surgery bStroke or transient ischaemic attack.
The SF-36 questionnaire
The SF-36 is a validated questionnaire to assess HRQoL in dialysis patients both as a stand-alone instrument [15] and as a domain of the Kidney Disease Quality of Life instrument [16]. This questionnaire includes 36 short questions that can be grouped into eight domains: physical functioning (10 questions), role limitation due to physical health (4 questions), role limitation due to emotional problems (3 questions), energy/fatigue (4 questions), emotional well-being (5 questions), social functioning (2 questions), pain (2 questions), general health (5 questions) and 1 question about any change in the health status.
The validated Italian version of the SF-36 [17] was handed out to the enrolled patients at baseline. Patients unable to complete the questionnaire by themselves were helped by a trained nurse.
Statistical analysis
Data were expressed as mean ± standard deviation (normally distributed data), median and IQR (non-normally distributed data) or as a percent frequency (categorical data). Linear regression analysis was applied to investigate the association of physical functioning with 11 key demographic, clinical and biochemical variables among those listed in Table 1, namely age, body mass index (BMI), diabetes, dialysis vintage, cardiovascular comorbidities in aggregate, creatinine, haemoglobin, serum cholesterol, albumin, C-reactive protein (CRP) and phosphate. To limit the possibility of false-positive associations due to multiple testing, we considered as statistically significant only associations with a P-value <0.001. Survival analyses were performed using both univariable and multivariable Cox regression analyses, including traditional (age, gender, current smoking, diabetes, cardiovascular comorbidities, cholesterol, arterial pressure, antihypertensive use, BMI), inflammatory (CRP, albumin) and other established risk factors (dialysis vintage, haemoglobin, phosphate) in ESKD. The prognostic value of the domains of SF-36 was assessed by testing whether the same domains (considered individually and jointly) added meaningful information for risk calibration by the Hosmer–Lemeshow test (the higher the departure from statistical significance, the better the risk calibration) [10], risk discrimination (Harrell’s C) [11], risk reclassification [categorical Net Reclassification Index (NRI)] [13] and the explained variability (R2) in mortality [12] to a basic model formed by the traditional, inflammatory and dialysis-related risk factors described above. The C-statistic by Harrell et al. is essentially a rank correlation measure motivated by Kendall’s τ for censored survival data [18]. Risk was assessed at 2.9 years (IQR 1.7–4.2). Death probabilities of 20 and 40% were chosen as cut-offs for the NRI. To overcome the limitations of data categorization, the reclassification ability was also assessed using the category-free, continuous NRI [12]. The Integrated Discrimination Improvement (IDI) [19] was also computed. The same analysis was applied for testing the prognostic information added by the SF-36 domains to the ARO risk score for mortality [14]. Statistical analysis was performed using standard statistical packages [SPSS for Windows, version 22 (IBM, Armonk, NY, USA) and STATA for Windows, version 13 (StataCorp, College Station, TX, USA)].
RESULTS
The main baseline characteristics of the study population are reported in Table 1: 63% of patients were male, the mean age was 65 years, 27% were diabetics and 51% had cardiovascular comorbidities.
Physical functioning in haemodialysis patients: functional correlates
The distribution of physical functioning values in the study population is shown in Figure 1. A total of 690 patients (73%) had a physical functioning score lower than the average age-specific value in general population studies [20]. As expected, physical functioning was inversely associated with age (β = −0.465), past cardiovascular events (β = −0.263) and diabetes (β = −0.158, all P < 0.001). Among biochemical variables, serum creatinine was the strongest correlate of physical functioning (β = 0.340, P < 0.001). In addition, we found weaker but very strong relationships between physical functioning and serum albumin (β = 0.177), CRP (β = −0.140) and phosphate (β = 0.135, all P < 0.001).
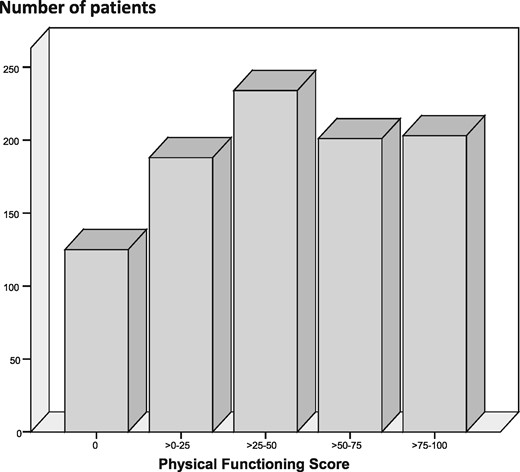
Distribution of physical functioning values in the study population.
Survival analysis by Cox regression analysis
During a median follow-up of 2.9 years (IQR 1.7–4.2), 392 patients died, 42 were lost to follow-up (transferred to another dialysis centre) and 84 underwent kidney transplant. For each of these patients, the follow-up ended on the last day of observation or on the transplant day. In univariable Cox regression analysis, all eight SF-36 domains predicted survival (P ≤ 0.004). In adjusted models, including the full set of risk factors reported in Table 1, all but two of these domains—namely role limitation due to physical health and role limitation due to emotional problems—remained significantly associated with mortality (Table 2).
Hazard ratio (HR) for mortality for a 10-U increase in each of the eight SF-36 domains
| Univariable analysis, | Multivariable analysis, | |
|---|---|---|
| SF-36 domains | HR (95% CI), P-value | HR (95% CI), P-value |
| Physical functioning | 0.83 (0.80–0.86), <0.001 | 0.88 (0.85–0.92), <0.001 |
| Role limitation due to physical health | 0.96 (0.93–0.98), <0.001 | 0.98 (0.96–1.00), 0.12 |
| Role limitation due to emotional problems | 0.97 (0.95–0.99), 0.004 | 0.98 (0.96–1.00), 0.07 |
| Energy/fatigue | 0.85 (0.81–0.89), <0.001 | 0.91 (0.86–0.96), <0.001 |
| Emotional well-being | 0.88 (0.84–0.92), <0.001 | 0.92 (0.88–0.96), <0.001 |
| Social functioning | 0.92 (0.89–0.96), <0.001 | 0.96 (0.93–0.99), 0.05 |
| Pain | 0.92 (0.89–0.95), <0.001 | 0.96 (0.92–0.99), 0.01 |
| General health | 0.84 (0.79–0.89), <0.001 | 0.90 (0.85–0.96), 0.001 |
Multivariable models are adjusted for the full series of risk factors listed in Table 1. See text for details.
Prognostic power of the SF-36 domains versus a risk model based on an established risk factor for mortality in the dialysis population
A basic model including the full set of risk factors listed in Table 1 explained 22.9% of the variability in survival of the study cohort. Among SF-36 domains, physical activity was the one that added the highest explanatory power to the basic model (added explanatory power 5.3%, P for the overall fitting <0.001) as compared with the other SF-36 domains (added explanatory power range 0.3–1.6%) (Table 3). Of note, in an analysis comparing physical functioning and age, the explanatory power added by this SF-36 domain (5.3%) was higher than that added by age (3.4%). The gain in discriminating power, as assessed by Harrell’s C, was 1.7% for the physical functioning domain and <1.0% for the other domains. Physical functioning improved calibration because the difference between observed and predicted outcomes of the model including physical functioning (χ2 = 0.61, P = 0.89) was less significant—which indicates improvement [10]—than that of the model not including this variable (χ2 = 3.25, P = 0.29). No other SF-36 domain but energy/fatigue improved risk calibration. Physical functioning was also more powerful for risk reclassification (categorical NRI 8.7%, P = 0.006) than the other SF-36 domains (NRI range 0.8–4.9, P ≥ 0.02). By the same token, the category-free NRI improvement by physical functioning (+46%) was superior to that by other HRQoL domains (NRI range 22–25%). Similarly, the IDI of physical functioning (3.4%, P < 0.001) was higher than that by other SF-36 domains (IDI range 0.4–1.5, P ≤ 0.03).
Explanatory power for mortality of a clinical model based on traditional risk factors (age, gender, current smoking, diabetes, cardiovascular comorbidities, cholesterol, arterial pressure), biomarkers of inflammation/nutrition (CRP, albumin), dialysis vintage and haemoglobin and of the same model after the inclusion of the eight SF-36 domains, one by one, in separate models
| Cox regression models | Explained variation in mortality of the model, % | Added explanatory power, % |
|---|---|---|
| Basic model | 22.9 | |
| + Physical functioning | 28.2 | 5.3 |
| + Energy/fatigue | 24.5 | 1.6 |
| + Emotional well-being | 24.3 | 1.5 |
| + Social functioning | 23.2 | 0.3 |
| + Pain | 23.7 | 0.8 |
| + General health | 24.1 | 1.2 |
Explanatory power for mortality predicted by the ARO risk calculator and by this same calculator and the eight SF-36 domains as tested one by one in separate models
| 2-year mortality | 1-year mortality | |||
|---|---|---|---|---|
| Cox regression models | Explained variation in mortality of the model, % | Added explanatory power, % | Explained variation in mortality of the model, % | Added explanatory power, % |
| ARO risk calculator (mortality) | 23.2 | 22.0 | ||
| + Physical functioning | 28.9 | 5.7 | 27.3 | 5.3 |
| + Energy/fatigue | 24.9 | 1.6 | 23.3 | 1.3 |
| + Emotional well-being | 25.0 | 1.8 | 23.5 | 1.5 |
| + Social functioning | 23.4 | 0.6 | 22.5 | 0.5 |
| + Pain | 24.6 | 1.4 | 23.0 | 1.0 |
| + General health | 25.3 | 2.1 | 23.4 | 1.4 |
The combination of the six SF-36 domains that were independently related to the death risk (see above) added a 6% discriminant power for mortality, which is a discriminant ability of magnitude close to that achieved by the physical functioning domain alone (+5.3%). Similarly, the risk reclassification by the categorical NRI and the IDI provided by the combination of the six SF-36 domains (NRI 10.9%, IDI 4.3%, P < 0.001 for both) only modestly increased the categorical NRI (8.7%) and the IDI (3.4%) by physical functioning alone. Similarly, the continuous NRI of the six domains of the SF-36 (+49%) was similar to that of physical functioning alone (+46%, see above).
Prognostic power of the SF-36 domains versus the ARO risk calculator
The ARO risk score explained 23.2% of the variability in mortality at 2 years and 22.0% at 1 year. Physical activity was the domain of the SF-36 adding the highest explanatory power to the ARO risk score [added explanatory power 5.7% (2 years) and 5.3% (1 year), P for the overall fitting <0.001] as compared with the other domains [added explanatory power range 0.6–2.1% (2 years) and 0.5–1.5% (1 year)] (Table 4). The gain in discriminating power, as assessed by Harrell’s C at 2 years and 1 year was 2.0 and 1.9%, respectively, for the physical functioning domain and <1.0% for the other domains. Physical functioning was the sole domain that improved calibration (by 48%) when added to the ARO risk score. Physical functioning was also more powerful for risk reclassification (categorical NRI 10%, P = 0.001 both for the 2-year and the 1-year risk of death predicted by the ARO risk score) than the other SF-36 domains (categorical NRI ≤5%, P = not significant), and the same was true for the IDI (by physical functioning 4%, P < 0.001; IDI for the other domains ≤2%, P ≤ 0.04). Again, the continuous NRI by physical functioning (+53%, both at 1 and 2 years) was superior to that by the other SF-36 domains [from +19% to +33% (1 year) and +18% to +32% (2 years)].
The combination of the six SF-36 domains that were independently related with mortality (including physical functioning; see Table 2) added 6.7% (2-year mortality) and 5.6% (1-year mortality) discriminant power to the death risk predicted by the ARO risk score. These estimates were very close to those achieved by the physical functioning domain alone (+5.7% and +5.3%; see above). Similarly, the categorical risk reclassification (NRI +13%) and the IDI (5%) obtained by the combination of the six SF-36 domains were again of the same order as that of physical functioning per se (10 and 4%, respectively). The continuous NRI by physical functioning alone (+53%) was similar to that of the six SF-36 domains combined [+51% (1 year); +48% (2 years)].
Finally, further analyses combining physical functioning status with the two summary measures of the SF-36 [i.e. the Physical Component Score (PCS), a score including physical functioning, and the Mental Component Score (MCS)] showed that the prognostic value of physical functioning was superior to that of the same variable combined either with the PCS or the MCS (Supplementary dataTable S1).
DISCUSSION
Among the eight HRQoL domains of the SF-36, physical functioning was by far the one with the highest prognostic power for mortality in haemodialysis patients. Furthermore, the explained variability in mortality, risk discrimination, risk calibration and reclassification by physical functioning was of similar magnitude to that achieved by the same domain combined with other SF-36 domains. Overall, these results suggest that physical functioning has potential for refining prognosis in the dialysis population.
Cohort studies based on estimated [21, 22] or objectively measured physical activity [23] or actual physical performance [24] have shown that these measurements are independently associated with the risk of death in the dialysis population. Physical functioning is an essential domain of HRQoL and a metric of this domain is a centrepiece of the most widely applied instrument for measuring HRQoL in chronic conditions and in ESKD, i.e. the SF-36 [25–27]. Mapes et al. [7] were the first to associate poor HRQoL with a high risk for death and hospitalization, independent of other risk factors, in patients of the DOPPS cohort [7]. Importantly, in this study the physical functioning domain of HRQoL was more robustly related with death as compared with the mental domain, emphasizing the potential causal role of physical dysfunction in the adverse health outcomes of ESKD. More recently, the physical activity domain of the SF-36 was associated with asymptomatic and symptomatic lung congestion both in haemodialysis [28] and peritoneal dialysis patients [29].
In the present study we tested the predictive value for mortality of the SF-36 domains not only by the classical Cox regression analysis, an approach useful to explore causality, but also by applying state-of-the-art prognostic tests including risk calibration, discrimination, reclassification and the explained variability in mortality. We analysed the SF-36 domains both individually and combined and estimated the additional prognostic value of these metrics over and above two prediction instruments, i.e. a model based on established risk factors for mortality in ESKD and the ARO risk score, which is a well-validated risk score for mortality in the same population [14]. In other words, we followed the approach formally recommended for assessing at an individual level the prognostic value of biomarkers and health metrics to be applied in clinical practice [9], which is a problem different from causality [30]. In our cohort, all but two of the eight domains of the SF-36 (role limitation by physical health and by emotional problems) predicted mortality in adjusted Cox regression analyses, confirming the findings in the DOPPS, which is the sole study linking poor HRQoL to adverse clinical outcomes in ESKD [7]. The key observation emerging from prognostic analyses (see above) in the present study is that physical functioning is the domain of the SF-36 with the highest power for risk calibration, discrimination and reclassification and the one that explained the highest proportion of the variability in mortality in the ESKD population. Furthermore, comparison of the prognostic value of physical functioning with the combination of the six domains of SF-36 (physical functioning included), which were independently related to death risk in our cohort, showed that this domain captures most of the global prognostic information by HRQoL in the ESKD population. By the same token, the predictive power of physical functioning was superior to that of the same variable considered in conjunction with each of the two summary scores of the SF-36, i.e. the PCS (which includes physical functioning) and the MCS. This observation implies that the other domains in these scores, most of which failed to be independently related with mortality, may actually reduce the ability of physical functioning to predict death.
Our study has several limitations. First, it is based on a single cohort composed of Caucasian haemodialysis patients. Therefore our findings need to be confirmed in other cohorts and in other ethnic groups. Second, QoL was assessed at baseline only. Even though the prognostic value of physical functioning is considered of potential clinical relevance, it remains to be seen whether repeated measurements of this variable are useful to improve risk prediction and clinical care in these patients. Furthermore, whether stratification of the haemodialysis population by this domain is useful in clinical practice remains an issue to be tested in specific clinical trials. In this respect, it should be noted that in the context of a randomized clinical trial, a physical training programme profiled along with the individual's physical performance at baseline [31] produced a meaningful increase in physical performance in dialysis patients. Third, although we showed that physical functioning adds meaningful prognostic information to a model based on established predictors of mortality in the haemodialysis population and to a well-validated risk score in the same population (the ARO risk score), the external validity of our findings remains to be established. Therefore the present analyses should be considered as hypothesis generating rather than hypothesis testing.
In conclusion, findings in this study further underscore the relevance of poor physical functioning in the haemodialysis population and suggest that the physical functioning domain of the SF-36, a metric that can be assessed in just 2 min, may help to refine the prognosis in this population. Whether stratification of the haemodialysis population by the SF-36 physical functioning domain may be useful in clinical practice remains to be tested in appropriate intervention studies in this population.
ACKNOWLEDGEMENTS
The PROGREDIRE Working Group collaborators who participated in this study: Giovanni Alati, Eleonora Barreca, Rosalia Boito, Margherita Bovino, Vincenzo Bruzzese, Maria Capria, Simonetta Cassani, Salvatore Chiarella, Antonio Chippari, Teresa Cicchetti, Edoardo Crifò-Gasparro, Carlo Curti, Francesco D’Agostino, Emanuela D’Anello, Maria De Gaudio, Aldo Foscaldi, Cesare Fornaciari, Corrado Franco, Alfredo Gaglioti, Domenico Galati, Francesco Grandinetti, Maurizio Gullo, Maria Rosa La Gamba, Domenico Logozzo, Iginia Maimone, Maria Letizia Mannino, Elena Mazzuca, Agazio Mellace, Giuseppe Natale, Vincenzo Panuccio, Domenico Plutino, Antonio Pugliese, Anna Reina, Rita Roberti, Mariagrazia Santangelo, Arcangelo Sellaro, Rosalba Scicchitano, Carmela Vardè and Francesco Zingone.
CONFLICT OF INTEREST STATEMENT
None declared. The results presented in this article have not been published previously in whole or part, except in abstract format.
REFERENCES
United States Renal Data System. v2 CH6 Mortality. https://www.usrds.org/2015/view/v2_06.aspx (11 April 2018, date last accessed)


Comments