


Abstract
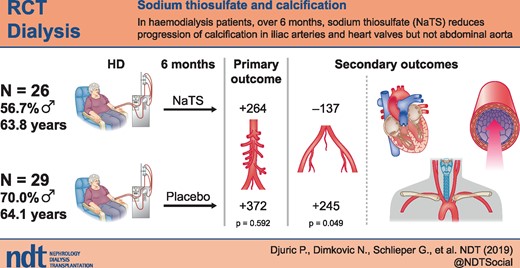
Sodium thiosulphate (NaTS) is mostly used in haemodialysis (HD) patients with calcific uraemic arteriolopathy. This double-blind, randomized, placebo-controlled study assessed the effect of NaTS on progression of cardiovascular calcifications in HD patients.
From 65 screened patients, we recruited 60 patients with an abdominal aorta Agatston calcification score ≥100. Thirty patients were randomized to receive NaTS 25 g/1.73 m2 and 30 patients to receive 100 mL of 0.9% sodium chloride intravenously during the last 15 min of HD over a period of 6 months. The primary endpoint was the absolute change of the abdominal aortic calcification score.
The abdominal aortic calcification score and calcification volume of the abdominal aorta increased similarly in both treatment groups during the trial. As compared with the saline group, patients receiving NaTS exhibited a reduction of their iliac artery calcification score (−137 ± 641 versus 245 ± 755; P = 0.049), reduced pulse wave velocity (9.6 ± 2.7 versus 11.4 ± 3.6; P = 0.000) and a lower carotid intima-media thickness (0.77 ± 0.1 versus 0.83 ± 00.17; P = 0.033) and had better preservation of echocardiographic parameters of left ventricular hypertrophy. No patient of the NaTS group developed new cardiac valve calcifications during the trial as compared with 8 of 29 patients in the saline group. By univariate analysis, NaTS therapy was the only predictor of not developing new valvular calcifications. No adverse events possibly related to NaTS infusion were noted.
While NaTS failed to retard abdominal aortic calcification progress, it positively affected calcification progress in iliac arteries and heart valves as well as several other cardiovascular functional parameters.
INTRODUCTION
Vascular calcification (VC) is a well-recognized risk factor for cardiovascular events and mortality in the general population, but particularly in patients with chronic kidney disease (CKD) [1]. In patients with end-stage renal disease on chronic haemodialysis (HD) or peritoneal dialysis, cardiovascular calcifications are highly prevalent and, even in young patient’s, progress at a rapid rate [2]. Clinical consequences may arise from impaired blood flow through calcified arteries or cardiac valves, but particularly from the stiffer vasculature with increased cardiac afterload [3], and this may explain the almost ubiquitous observation that cardiovascular calcifications in CKD potently predict mortality [3].
The pathogenesis of cardiovascular calcifications in CKD is complex and involves accelerated ageing of the cardiovascular system [4]; high calcification ‘pressure’, in particular due to altered handling of serum phosphate and calcium in CKD; but also reduced physiological defences against VC, in particular a relative vitamin K deficiency, and consequently impaired action of the main vascular wall calcification inhibitor matrix Gla protein [4].
So far, cardiovascular calcifications in CKD are mostly considered as a one-way road with little evidence for spontaneous regression and even successful kidney transplantation does not lead to resolution of calcification [5]. Therapeutic approaches have focused on secondary prevention via lowering of serum phosphate, reducing calcium loading and controlling secondary hyperparathyroidism with calcimimetics [6–9]. Trials focusing on correction of the vitamin K deficiency in HD patients, such as our VitaVasK trial, are ongoing [5, 10], and the first evidence suggests that direct oral anticoagulant therapy may induce less calcification progress compared with vitamin K antagonist [11]. Increasing serum magnesium (Mg) may also reduce the progression of calcification via inhibiting calcium phosphate crystal formation [12]. Other novel compounds to inhibit calcification progress, such as SNF-472, are currently being evaluated [13].
A conceptually different approach is the administration of sodium thiosulphate [NaTS (Na2S2O3)], which can mobilize calcium from deposits and forms highly soluble calcium thiosulphate complexes in addition to NaTS’s antioxidant and vasodilatory activity [14, 15]. NaTS is a chelating agent used mainly for cyanide poisoning [16], but it may also improve skin necrosis in uraemic arteriolopathy (calciphylaxis) and soft tissue calcification of uraemic [17–19] and even non-uraemic origin [20, 21]. The first reports on the effects of NaTS on cardiovascular calcifications in chronic HD patients are available as well [22, 23]. In these two non-randomized studies, progression of arterial calcification in HD patients slowed or was arrested following 4–5 months of intravenous administration of NaTS at the end of the HD session [22, 23]. Another pilot study administered NaTS via the dialysate in six patients [24]. To our knowledge, there is no published randomized, placebo-controlled study on the treatment effect of NaTS on the progression of cardiovascular calcifications in HD patients. We therefore set up an interventional double-blind, randomized, placebo-controlled study to determine the effect of NaTS given over 6 months on the progression of cardiovascular calcification in HD patients.
MATERIALS AND METHODS
Patients and trial protocol
The trial was double-blind, randomized, placebo-controlled and conducted over 6 months. Screening started in March 2015 and therapy finished in December 2015. Of 230 patients in the Clinical Department of Renal Diseases, Zvezdara University Medical Centre, we recruited 65 patients who fulfilled the inclusion criteria and who were willing to participate in the study. Given the exploratory nature of this trial, no power calculations were possible (post hoc achieved power was 90.6%). The study was approved by the Zvezdara University Medical Center ethical board and all patients signed informed consent after detailed information about the study protocol.
Inclusion criteria were on chronic thrice-weekly HD for >6 months, age >18 years, abdominal aortic calcification score (AACS) ≥100 determined using the Agatston method [25, 26] and the ability to give informed consent. Exclusion criteria were intolerance or allergy to NaTS, pregnancy, involvement in another study, active/chronic inflammation, being on vitamin K antagonistic drugs, malignancy and life expectancy <6 months.
Patients received conventional bicarbonate HD three times per week (4 h per session) using high-flux polysulfone membranes. Dialysate calcium concentration ranged from 1.25 to 1.5 mmol/L and dialysate magnesium was 1.0 mmol/L. Bicarbonate in the dialysis fluid was adjusted according to the serum bicarbonate (S-HCO3−) level. Dialysis conditions and medications were kept constant as far as possible throughout the study.
Randomization was carried out by an unblinded member of the team using an online programme (http:/www.graphpad.com/quickcalcs/randomize1.cfm) to randomize patients into two groups. NaTS and saline were filled into bottles of the same appearance and they were prepared by the unblinded member of the team in order to keep the participating clinicians blinded to patient allocation. NaTS or saline delivered by the unblinded member of the team was labelled with patient codes, depending on their allocation. Patients of the NaTS group received NaTS 25 g/1.73 m2 dissolved in 100 mL saline intravenously during the last 15 min of every HD session, while patients of the saline group received 100 mL of 0.9% saline during the last 15 min of every HD session.
The primary endpoint of the trial was the absolute change in the AACS determined using a 16-slice computed tomography (CT) scanner and the Agatston method. Secondary endpoints included changes in the abdominal aortic calcification volume (AACV) score, iliac artery Agatston calcification score (IACS), iliac artery calcification volume score (IACV), intima-media thickness of the common carotid arteries (IMT CCAs), pulse wave velocity (PWV), cardiac valve calcification and left ventricular hypertrophy, all determined as described below. Finally, adverse events were captured as reported by the patients and treating physicians.
Demographic, biochemical and dialysis data
Patient characteristics were taken from the medical records and included age, sex, dialysis vintage (months), presence of diabetes mellitus and hypertension and medication.
Routine laboratory data were captured as the average of three measurements before the start and three at the end of the trial. Samples for laboratory analyses were obtained at the start of the HD procedure after a 3-day HD interval.
The adequacy of dialysis was assessed using Kt/V values calculated using the Daugirdas formula [27]. Serum corrected calcium was calculated using an online programme (https://www.mdcalc.com/calcium-correction-hypoalbuminemia).
Diagnostic procedures
Non-contrast-enhanced CT scans of the abdomen were performed using a GE Light Speed 16 multislice spiral CT scanner (120 kVp, 75 mAs; GE Healthcare, Chicago, IL, USA). Scanning was done in sequential 3.75 mm thick layers. CT images were transferred by a single observer who was blinded to the treatment groups to a dedicated VITREA 2 workstation (Vital Images, Minnetonka, MN, USA) equipped with a programme to calculate the Agatston score and volume as described previously [25, 26]. Intra-observer variability was 0.2%. An aortic segment 5 cm proximal to the bifurcation of the abdominal aorta was scored and analysed (AACS and AACV). The common iliac artery was scored from the bifurcation of the abdominal aorta to the bifurcation of the common iliac artery and scores of the left and right iliac artery were combined to yield the IACS and IACV. Progression of calcification was defined as a difference between the follow-up and baseline square root–transformed calcium volume scores ≥2.5 mm/year according to a previously described methodology [28].
Echocardiography was performed with a GE Vivid 7 machine using a 2.5-MHz probe allowing M-mode, two-dimensional and pulsed Doppler measurements. Measurements were made according to the recommendations of the American Society of Echocardiography [29]. The following parameters were determined: presence and localization of calcifications in cardiac structures, left ventricular end-diastolic diameter (LVEDD), left ventricular end-systolic diameter, ventricular septum thickness in diastole (IVSD), left ventricular posterior wall thickness in diastole (LPWD) and ejection fraction (EF). Intra-observer variability was 4%.
Common carotid arteries were investigated by B-mode ultrasonography (using the SONOACE 7000 system with 7.5-MHz linear transducers). IMT and carotid plaques were assessed in both common carotid arteries 4 cm from the bulbs, within carotid bulbs and within the first 2 cm of the internal and external carotid arteries. IMT was calculated as the mean of four measurements [30]. Plaques were defined as echogenic structures showing protrusion into the lumen with focal widening that was 50% greater than the IMT of adjacent sites. Highly echogenic plaques producing bright white echoes with ultrasound shadows were considered to be calcifications [29]. Intra-observer variability was 7%.
PWV was determined using the Complior SP system (Artech Medical, Pantin, France). PWV was measured utilizing two sensors (one carotid and one femoral) simultaneously to determine the velocity of the pulse in relation to the distance between the femoral artery and the suprasternal notch. Two measurements were performed by two observers and mean values were calculated. Interobserver variability was 6%.
All diagnostic procedures were performed before and after the study period of 6 months and investigators for all tests were blinded to the treatment arms.
Statistical analysis
Statistical calculations were performed using SPSS version 16.0 (SPSS, Chicago, IL, USA). Data were expressed as a percentage for discrete variables and as mean values for continuous variables. Statistical analyses included exploratory descriptive and analytic statistics. The independent sample t-test was used to compare variables with normal distribution between different groups. In cases where variables did not have a normal distribution, the Mann–Whitney U test was used. Paired tests for differences between pre- and post-study values were calculated using the paired samples t-test. Univariate and multivariate logistic regression analyses were used to assess factors associated with calcification progression. All variables that were significant in the univariate analysis were included in the multivariate analysis. P-values <0.05 were considered to be statistically significant.
RESULTS
Baseline characteristics
Of the 65 patients screened, 60 who had an AACS ≥100 determined using the Agatston method were considered eligible for the study (Figure 1). Thirty patients were randomized to the NaTS group and 30 patients to the saline group. As shown in Figure 1, four patients of the NaTS group dropped out of the trial: one patient died after a stroke, one underwent surgery for a splenic arterial aneurysm at another institution and was lost to follow-up and two patients withdrew their consent for personal reasons. In the saline group, one patient withdrew informed consent for personal reasons. Thus, at the end of the trial, 55 patients were available for the final analysis using a per-protocol approach.
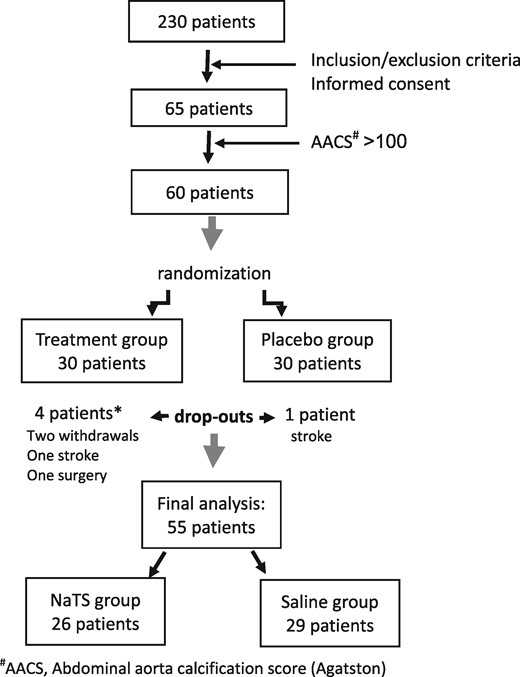
Study flowchart.
Baseline demographic, dialysis and biochemical data of the patients are shown in Tables 1 and 2. There were no significant differences between the groups regarding any of the parameters assessed. Therapeutic use of phosphate binders (only calcium carbonate was used) and calcitriol was comparable in both groups (Table 1). Other vitamin D analogues, native vitamin D or calcimimetics were not used in any patient.
Baseline characteristics of the patients
| Parameters | NaTS group (n = 30) | Saline group (n = 30) | P-value |
|---|---|---|---|
| Males, % | 56.7 | 70.0 | 0.211 |
| Age (years), mean ± SD | 63.8 ± 13.2 | 64.1 ± 9.7 | 0.938 |
| Body weight (kg), mean ± SD | 71.5 ± 9.1 | 72.0 ± 7.5 | 0.713 |
| Active/previous smokers, n | 7 | 9 | 0.230 |
| Dialysis vintage (months), mean ± SD | 104.4 ± 80.5 | 103.7 ± 75.1 | 0.972 |
| Diabetes (main disease or comorbidity), % | 23.3 | 20.0 | 0.500 |
| ESRD assumed due to, % | – | – | 0.210 |
| Diabetes mellitus | 10.0 | 10.0 | – |
| Hypertension | 50.0 | 56.7 | |
| Glomerulonephritis | 20.0 | 3.3 | |
| Tubulointerstitial renal disease | 13.3 | 16.7 | |
| ADPKD | 0 | 5.0 | |
| Other | 6.7 | 3.3 | |
| Dialysate calcium (mEq/L), mean ± SD | 1.35 ± 0.3 | 1.36 ± 0.4 | 0.845 |
| Patients receiving binders, % | 20 | 23 | 0.932 |
| Intake of elemental calcium from PO4− binders (g/day), mean ± SD | 1.36 ± 0.61 | 1.38 ± 0.54 | 0.541 |
| Patients receiving calcitriol, % | 14 | 13 | 0.593 |
| Calcitriol (µg/week), mean ± SD | 1.75 ± 1.33 | 1.77 ± 1.36 | 0.491 |
ADPKD, autosomal dominant polycystic kidney disease; SD, standard deviation.
Primary endpoint
The AACS significantly increased after 6 months of therapy and there was no statistically significant difference in the absolute change of the calcification score (ΔAACS) between the NaTS and saline group (Table 3).
Parameters of vascular calcifications before and after therapy with NaTS
| Parameters | NaTS group (n = 26) | Saline group (n = 29) | P-value** (NaTS versus saline group) | |||||
|---|---|---|---|---|---|---|---|---|
| Before | After | P-value* | Before | After | P-value* | Before | After | |
| AACS, median (IQR) | 3879 | 4823 | 0.003 | 4054 | 4478 | 0.002 | 0.993 | 0.879 |
| (2036.8–5724.0) | (2090.8–5889.3) | (1175.5–7123) | (1169.5–7564.5) | |||||
| ΔAACS, mean ± SD | 264 ± 487 | 372 ± 919 | 0.592 | |||||
| AACV, median (IQR) | 3221.5 | 3710.5 | 0.006 | 3319 | 3406 | 0.001 | 1.000 | 0.866 |
| (1566.3–4325.0) | (1607.3–4487.0) | (1001.5–5407) | (992.5–5705) | |||||
| ΔAACV, mean ± SD | 197 ± 357 | 282 ± 703 | 0.543 | |||||
| IACS, median (IQR) | 3903.5 | 3844.5 | 0.485 | 3394.5 | 3865 | 0.295 | 0.835 | 0.736 |
| (808.5–7900.0) | (954.5–7453.0) | (831.5–8673.5) | (774–9995.75) | |||||
| ΔIACS, mean ± SD | −137 ± 641 | 245 ± 755 | 0.049 | |||||
| IACV, median (IQR) | 3129.5 | 2984.5 | 0.809 | 2723 | 3054 | 0.449 | 0.787 | 0.723 |
| (663.8–5978.0) | (784.3–5613.5) | (692.5–6524.0) | (674.5–7533.5) | |||||
| ΔIACV, mean ± SD | −88 ± 495 | 177 ± 581 | 0.074 | |||||
| PWV (m/s), mean ± SD | 11.4 ± 3.6 | 9.6 ± 2.7 | 0.000 | 10.4 ± 2.8 | 10.4 ± 2.7 | 0.574 | 0.363 | 0.332 |
| CCA IMT (mm), mean ± SD | 0.83 ± 0.17 | 0.77 ± 0.13 | 0.033 | 0.82 ± 0.14 | 0.83 ± 0.14 | 0.682 | 0.953 | 0.133 |
| CCA LD (mm), mean ± SD | 7.22 ± 1.00 | 7.16 ± 0.90 | 0.568 | 7.31 ± 0.74 | 7.43 ± 0.80 | 0.371 | 0.238 | 0.218 |
| Patients with calcified CCA plaques, n | 17 | 17 | 1.000 | 21 | 23 | 0.500 | – | |
Bold indicates statistical significance and correspond to head P-value (P-value*).
P-values refer to comparisons within groups before and at the end of the study.
P-values refer to comparisons before (NaTS versus saline) and after the study (NaTS versus saline) except for values ΔAACS, ΔAACV, ΔIACS and ΔIACV, where P-values refer to the comparison between NaTS and saline groups.
IQR, interquartile range; LD, lumen diameter; SD, standard deviation.
Secondary endpoints
Abdominal aortic calcification determined as a volume score (AACV) instead of the Agatston score (AACS) progressed similarly in both groups (Table 3).
As shown in Table 3, the mean Agatston score in the iliac arteries decreased in the NaTS but not the saline group. The difference in absolute change of IACS (ΔIACS) between the two groups was statistically significant (P = 0.049).
PWV and CCA IMT significantly decreased in the NaTS group but not in the saline group (Table 3). In contrast, neither the luminal diameter of the CCA nor the number of calcified plaques changed significantly during the study in either group.
Cardiac structure, function and valvular calcifications are shown in Table 4. Cardiac parameters of left ventricular hypertrophy (LVEDD, IVSD and LPWD) significantly worsened in the saline but not in the NaTS group. There were no patients with newly calcified cardiac valves at the end of the trial in the NaTS group, while eight patients in the saline group developed de novo calcifications of the valves (Table 4).
Cardiac structure/function and calcification of cardiac valves before and at the end of therapy with NaTS
| Echosonographic parameters | NaTS group (n = 26) | Saline group (n = 29) | P-value** (NaTS versus saline group) | |||||
|---|---|---|---|---|---|---|---|---|
| Before | After | P-value* | Before | After | P-value* | Before | After | |
| LVEDD (mm), mean ± SD | 47.1 ± 8.5 | 47.7 ± 7.7 | 0.512 | 47.3 ± 6.4 | 50.0 ± 7.0 | 0.013 | 0.583 | 0.241 |
| LVDES (mm), mean ± SD | 32.9 ± 6.9 | 33.5 ± 6.0 | 0.476 | 34.2 ± 6.1 | 35.6 ± 6.2 | 0.195 | 0.466 | 0.213 |
| IVSD (mm), mean±SD | 11.6 ± 2.2 | 12.0 1.8 | 0.063 | 11.4 ± 2.0 | 11.9 ± 1.6 | 0.041 | 0.619 | 0.662 |
| LPWD (mm), mean ± SD | 11.3 ± 2.2 | 11.6 ± 1.5 | 0.242 | 10.8 ± 1.6 | 11.7 ± 1.4 | 0.000 | 0.426 | 0.973 |
| EF (%), mean ± SD | 54.2 ± 7.2 | 53.1 ± 6.9 | 0.282 | 54.8 ± 7.0 | 53.8 ± 7.8 | 0.227 | 0.717 | 0.571 |
| Overall patients with calcified valves, n | 20 | 20 | 1.000 | 20 | 28 | 0.008 | – | |
| Patients with calcified aortic valves, n | 6 | 4 | 11 | 10 | ||||
| Patients with calcified mitral valves, n | 5 | 3 | 1 | 3 | ||||
| Patients with calcified aortic plus mitral valves, n | 9 | 13 | 8 | 15 | ||||
Bold indicates statistical significance and correspond to head P-value (P-value*).
P-values refer to comparisons before and at the end of the study.
P-values refer to comparisons before (NaTS versus saline) and after the study (NaTS versus saline).
Predictors of endpoints
Univariate logistic regression analysis was used to assess the impact of several factors on the probability of AACS progression in a model that contained 12 independent variables: gender, age, smoking, dialysis vintage, Kt/V, diabetes, NaTS therapy, corrected calcium, serum phosphorus (S-PO4), phosphate binder, calcitriol and intact parathormone (iPTH). In this analysis, dialysis vintage {odds ratio [OR] 0.99 [95% confidence interval (CI) 0.985–1.000], P = 0.044} and corrected serum calcium [S-Ca; OR 16.8 (95% CI 1.23–230.4), P = 0.034] were significant predictors of AACS progression. However, by multivariate analysis, no factor significantly predicted AACS progression. By using the same predictors in a univariate logistic regression model, we found that none of the 12 parameters was a significant predictor of IACS calcification progress or of CCA IMT reduction.
The analysis of risk factors for developing de novo valvular calcifications showed that patients who received saline had an OR of 9.5 to develop new valvular calcifications as compared with those receiving NaTS [OR 9.5 (95% CI 1.10–82.4), P = 0.041]. NaTS therapy was the only significant protective factor in this univariate analysis.
Also, NaTS was the only significant predictor of reduction of PWV. Patients who received NaTS had a 5.8-fold higher chance to decrease their PWV [OR 5.89 (95% CI 1.62–21.4), P= 0.007].
Safety data
Laboratory data before and after therapy are shown in Table 2. Total albumin and corrected S-Ca decreased significantly in both groups. Serum phosphate increased significantly after 6 months of therapy with NaTS but not with saline. Uric acid fell significantly in the saline group only and iPTH significantly increased in the NaTS group. All other parameters did not change significantly over the course of the trial (Table 4).
Laboratory data before and at the end of therapy with NaTS (pre-dialysis values obtained after a 3-day HD interval)
| Laboratory parameters | NaTS group (n = 26) | Saline group (n = 29) | P-value** (NaTS versus saline group) | |||||
|---|---|---|---|---|---|---|---|---|
| Before | After | P-value* | Before | After | P-value* | Before | After | |
| Total protein (g/L) | 70.3 ± 5.5 | 69.7 ± 4.7 | 0.503 | 70.8 ± 5.7 | 70.2 ± 5.5 | 0.477 | 0.731 | 0.710 |
| Serum albumin (g/L) | 38.6 ± 3.0 | 38.4 ± 2.5 | 0.700 | 38.8 ± 1.8 | 38.1 ± 3.1 | 0.146 | 0.858 | 0.716 |
| Uric acid (µg/L) | 380.9 ± 58.1 | 370.8 ± 69.4 | 0.431 | 390.4 ± 90.6 | 361.0 ± 83.1 | 0.016 | 0.647 | 0.578 |
| Cholesterol (mmol/L) | 4.6 ± 1.2 | 4.6 ± 0.9 | 0.927 | 4.5 ± 0.9 | 4.5 ± 1.0 | 0.711 | 0.789 | 0.654 |
| HDL (mmol/L) | 1.1 ± 0.4 | 1.2 ± 0.4 | 0.593 | 1.2 ± 0.4 | 1.1 ± 0.4 | 0.539 | 0.589 | 0.433 |
| LDL (mmol/L) | 2.6 ± 0.8 | 2.6 ± 0.7 | 0.953 | 2.6 ± 0.8 | 2.6 ± 0.9 | 0.993 | 0.865 | 0.970 |
| Triglycerides (mmol/L) | 2.0 ± 1.0 | 2.1 ± 1.6 | 0.607 | 1.7 ± 0.8 | 1.7 ± 0.8 | 0.847 | 0.704 | 0.946 |
| S-Na (mmol/L) | 136.5 ± 3.4 | 137.0 ± 2.9 | 0.743 | 135.6 ± 2.8 | 136.5 ± 2.0 | 0.078 | 0.358 | 0.550 |
| S-Cl (mmol/L) | 102.7 ± 2.9 | 102.1 ± 3.5 | 0.424 | 102.3 ± .1 | 102.8 ± 3.3 | 0.817 | 0.927 | 0.441 |
| S-Mg (mmol/L) | 1.43 ± 0.2 | 1.41 ± 0.1 | 0.599 | 1.31 ± 0.1 | 1.32 ± 0.1 | 0.243 | 0.007 | 0.050 |
| S-Ca (mmol/L) | 2.37 ± 0.2 | 2.25 ± 0.2 | 0.004 | 2.38 ± 0.2 | 2.28 ± 0.2 | 0.001 | 0.768 | 0.621 |
| Corrected Ca (mmol/L) | 2.63 ± 0.3 | 2.39 ± 0.2 | 0.002 | 2.62 ± 0.3 | 2.43 ± 0.3 | 0.000 | 0.926 | 0.539 |
| S-PO4 (mmol/L) | 1.41 ± 0.4 | 1.68 ± 0.5 | 0.002 | 1.44 ± 0.4 | 1.45 ± 0.3 | 0.809 | 0.838 | 0.051 |
| S-HCO3 (mmol/L) | 22.4 ± 4 | 22 ± 2.5 | 0.651 | 22 ± 3 | 22 ± 4 | 0.357 | 0.690 | 0.986 |
| iPTH (pg/mL), median (IQR) | 129.7 (59.8–256.1) | 189 (69.1–403.8) | 0.018a | 110.1 (60.5–172.2) | 79.9 (55.5–264.3) | 0.068 | 0.443 | 0.225 |
| Anion gap (mEq/L) | 12.1 ± 2.8 | 12.6 ± 2.8 | 0.449 | 11.4 ± 2.3 | 11.8 ± 3.1 | 0.580 | 0.399 | 0.209 |
| Hb (g/L) | 105 ± 15 | 103 ± 16 | 0.537 | 106 ± 11 | 106 ± 16 | 0.984 | 0.906 | 0.161 |
| Kt/V | 1.54 ± 0.35 | 1.48 ± 0.41 | 0.276 | 1.49 ± 0.32 | 1.42 ± 0.30 | 0.056 | 0.807 | 0.463 |
Bold indicates statistical significance and correspond to head P-value (P-value*). Values presented as mean ± SD unless stated otherwise.
Baseline (before) samples of only those patients finishing the trial entered the analyses.
P-values refer to comparisons before and at the end of the study.
P-values refer to comparisons before (NaTS versus saline) and after the study (NaTS versus saline).
HDL, high-density lipoprotein cholesterol; LDL, low-density lipoprotein cholesterol; Hb, haemoglobin.
In terms of adverse events, one patient of the saline group reported nausea. No other adverse events or intolerance possibly related to NaTS were registered. In particular, patients in the NaTS group failed to develop hypernatraemia, hypertension, anorexia, metabolic acidosis or changes in their anion gap. Overall, there were 16 hospital admissions in the trial subjects (10 in the NaTS group and 6 in the saline group): vascular access complications (n = 10), gastrointestinal bleeding (n = 1), peripheral vascular disease (n = 1), infection (n = 2), heart failure (n = 1) and hyperglycaemia (n = 1). None of the hospitalizations were considered to be related to NaTS treatment. There was no fatal outcome in either group.
DISCUSSION
This randomized controlled clinical trial primarily aimed to analyse the effect of NaTS on calcification of the abdominal aorta in chronic HD patients with significant pre-existing calcification. We selected abdominal aortic calcification as our primary endpoint, given that it is a surrogate marker of asymptomatic coronary artery disease and an independent predictor of cardiovascular events [31]. Also, abdominal aortic calcification precedes the occurrence of coronary artery calcification in HD patients [32]. Our trial failed to observe significant effects of NaTS on the primary study endpoint, namely the progression of abdominal aortic calcification. In contrast, a number of secondary endpoints, including progression of iliac artery or cardiac valve calcification, as well as several functional cardiovascular parameters (PWV, CCA IMT, LVDD, IVSD and LPWD) were positively and significantly affected by NaTS therapy. In the univariate regression model, NaTS therapy was the only significant protective factor against valvular calcification.
So far, two clinical studies have specifically addressed the effect of intravenous NaTS on the progression of cardiovascular calcification in HD patients. In the first one, 16 Thai patients with significant coronary artery calcification received 12.5 g NaTS twice weekly after HD for 4 months and were matched to 16 patients with no specific intervention but similar baseline calcification [22]. Progression of coronary artery calcification occurred in 25% of the NaTS patients as compared with 63% of the control patients [19]. In the second non-controlled study, 22 mostly African American patients with significant baseline coronary artery calcification received 12.5–25 g of NaTS three times per week over a 5-month period after each HD treatment [23]. Despite NaTS therapy, coronary artery calcification scores progressed in 14/22 subjects, but the absence of a control group precludes firm conclusions [23]. Comparison of these two studies with our present one is difficult given that the previous studies focused on coronary arteries and the thoracic aorta and enrolled patients with mostly different ethnicity, but more importantly, they were not randomized, lacked controls in one case [23] and used shorter treatment durations and/or possibly different dosages of NaTS (see below). In addition, none of the previous studies assessed the effects of NaTS on cardiac valves.
Another small pilot study analysed the effects of NaTS administered via dialysis fluid at a concentration of 10 g/L to six HD patients [24]. As compared with controls, this regimen significantly reduced coronary artery calcification in four and retarded progress in two patients. No side effects were registered during the study period of 6 months.
Our study is notable for the lack of an NaTS-related benefit to abdominal aortic calcification as opposed to retardation of iliac artery and cardiac valve calcification. One potential explanation for these divergent effects might include the high statistical scatter of AACSs, which, combined with only 6 months of treatment, might have prevented the detection of significant treatment effects. However, statistical noise was similar in the assessment of iliac artery calcification, suggesting an alternative explanation, namely different susceptibility of different cardiovascular regions to NaTS. In this context, it is important to note that particular arterial regions exhibit a different prevalence of calcification ranging from 20% to 70% [33]. Variability of calcification processes in different blood vessels may be a consequence of blood vessel type and size, blood flow characteristics, shear stress or even different ontogenetic origin [34]. Our findings underline the complex pathophysiology of cardiovascular calcification and stress that diverse factors may determine the susceptibility of various segments of the vascular tree to VC and its progression. In addition, it is not well established whether the composition of cardiovascular calcification differs at a chemical level in different regions and whether this too might affect its responses to NaTS therapy.
Another important finding of our study is the effect of NaTS therapy on arterial stiffness as assessed by PWV, that is, the gold standard method [35]. By using different diagnostic techniques, we and others have noted a relationship between PWV and the degree of VC [36–38]. It is therefore of particular interest that our treatment with NaTS led to a decrease in PWV, an indirect sign of reduced calcification of the arterial bed, although this relationship is still a matter of debate [39–41]. Another important parameter of vascular structure is CCA IMT. As for PWV, NaTS decreased CCA IMT in our patients, which is in contrast to previous North American observations [23]. A very recent Taiwanese study [42] analysed arterial stiffness by using a novel marker, the cardio-ankle vascular index (CAVI). In agreement with our data, 12.5 g of NaTS given twice weekly during the last hour of dialysis for 6 months significantly improved the CAVI and carotid–femoral PWV in the NaTS group, in addition to decreased coronary artery calcification scores [42]. In a subanalysis, NaTS benefits to arterial stiffness were observed only in non-diabetic patients [42].
Our data are remarkably similar to a small, short-term Polish intervention study with vitamin K supplements in non-dialysed patients with CKD Stages 3–5 [43]. In that study, 9 months of vitamin K failed to significantly affect VC progress and the only highly significant benefit was observed for progression of carotid IMT [43]. We speculate that significant retardation or even resolution of VC may need more prolonged observation periods, whereas IMT might be a more sensitive short-term marker for vascular benefits of a particular intervention.
Stiffened arteries may have a significant impact on cardiovascular remodelling. Enhanced cardiac work in response to stiffer arteries leads to left ventricular hypertrophy, thus potentially contributing to heart failure and/or sudden cardiac death [44]. While parameters of left ventricular hypertrophy (i.e. LVDD, IVSD and LPWD) significantly deteriorated in our saline group, they remained stable in the NaTS group. Again, these data differ from those of Mathews et al. [23], who noted no significant changes pre- versus post-NaTS in cardiac structure and systolic or diastolic cardiac function.
A possible adverse effect of NaTS therapy is anion gap acidosis [14]. In our group of patients, this was avoided by regular controls of S-HCO3−, by the administration of NaTS during HD and by adjusting the dialysate bicarbonate concentration in patients with worsening metabolic acidosis. In another study, NaTS therapy did not have a significant impact on inflammatory, haemodynamic and bone mineral density parameters [42]. Similarly, vertebral mineral density was stable in the Thai NaTS and North American trials [22, 23], whereas bone mineral density of the total hip decreased in the Thai patients [22].
In addition to the lack of bone mineral data, our study has further limitations. The relatively small number of patients and short observation or therapy period may have masked potential NaTS benefits. However, our trial is the largest that has been performed so far. The question of the time of drug application also deserves a comment since NaTS was administered during the last 15 min of HD rather than after HD as in previous trials [22, 23]. The HD clearance of NaTS is high and most authors recommended drug infusion either after the HD session or during the last half hour of dialysis. In our patients, NaTS was well tolerated and there were no study withdrawals or dose reductions due to adverse events. This difference could possibly explain why the NaTS tolerance in previous trials was much worse, with nausea in all North American patients despite anti-emetic therapy [23] and anorexia in 75% of the Thai patients [22]. Finally, values of S-Ca immediately after administration of NaTS were not available in our trial, so we have no insight into possible transient hypocalcaemia in response to NaTS. However, clinical signs of hypocalcaemia did not develop in any patient and stable levels of iPTH in our NaTS-treated patients argue against significant and prolonged NaTS effects on S-Ca.
In conclusion, NaTS proved to be a safe and effective therapeutic measure to reduce calcification at least in iliac arteries and heart valves and to improve carotid IMT and PWV in addition to decreasing evidence of left ventricular hypertrophy. Our study lends further support to initiating larger and more definitive clinical trials of NaTS in dialysis patients.
ACKNOWLEDGEMENTS
We thank all patients and dialysis personnel who contributed to this trial. We are grateful to Dr Franz Köhler Chemie, Bensheim, Germany for the donation of sodium thiosulphate.
CONFLICT OF INTEREST STATEMENT
None declared.


Comments