


Abstract
Retrospective studies suggest that tacrolimus-induced hypomagnesaemia is a risk factor for post-transplant diabetes mellitus (PTDM), but prospective studies are lacking.
This was a prospective study with measurements of serum magnesium and tacrolimus at pre-specified time points in the first year after living donor kidney transplantation (KT). The role of single nucleotide polymorphisms (SNPs) in hepatocyte nuclear factor 1β (HNF1β) was also explored because HNF1β regulates insulin secretion and renal magnesium handling. Repeated measurement and regression analyses were used to analyse associations with PTDM.
In our cohort, 29 out of 167 kidney transplant recipients developed PTDM after 1 year (17%). Higher tacrolimus concentrations were significantly associated with lower serum magnesium and increased risk of hypomagnesaemia. Patients who developed PTDM had a significantly lower serum magnesium trajectory than patients who did not develop PTDM. In multivariate analysis, lower serum magnesium, age and body mass index were independent risk factors for PTDM. In recipients, the HNF1β SNP rs752010 G > A significantly increased the risk of PTDM [odds ratio (OR) = 2.56, 95% confidence interval (CI) 1.05–6.23] but not of hypomagnesaemia. This association lost significance after correction for age and sex (OR = 2.24, 95% CI 0.90–5.57). No association between HNF1β SNPs and PTDM was found in corresponding donors.
A lower serum magnesium in the first year after KT is an independent risk factor for PTDM. The HNF1β SNP rs752010 G > A may add to this risk through an effect on insulin secretion rather than hypomagnesaemia, but its role requires further confirmation.
INTRODUCTION
Post-transplant diabetes mellitus (PTDM) is one of the major metabolic complications after kidney transplantation (KT) [1–5]. Kidney transplant recipients (KTRs) with PTDM have a reduced long-term graft function [6] and a higher risk of graft failure [6–10], cardiovascular disease [5, 11, 12] and mortality [5, 8–11, 13]. Of the identified risk factors of PTDM, hypomagnesaemia is of special interest, because it is potentially modifiable, and because a link between magnesium and diabetes mellitus is becoming increasingly evident [14]. Magnesium acts as an intracellular cofactor for several metabolic pathways, including glucose transport and uptake, and insulin sensitivity and secretion [15–21]. In non-transplant populations, lower serum magnesium levels have been firmly linked to a higher risk of diabetes mellitus, although it is unclear if this association is causal [22, 23]. Hypomagnesaemia has also become a common finding in KTRs after the introduction of calcineurin inhibitors (CNIs) [24, 25]. CNIs down-regulate the transient receptor potential melastatin 6, a magnesium channel in the distal convoluted tubule involved in the reabsorption of magnesium [26]. Thus, CNIs cause hypomagnesaemia through renal magnesium loss [25]. CNIs are also a risk factor for PTDM and this risk may be mediated through the effects of CNIs on magnesium [2]. Indeed, in several retrospective studies, CNI-induced hypomagnesaemia has been associated with a higher risk of PTDM [2, 27, 28], although this has not been a consistent finding [3, 29, 30]. Therefore, the main aim of this prospective study was to analyse the roles of tacrolimus and serum magnesium on the risk of developing PTDM.
The second aim of this study was to explore the potential role of the transcription factor hepatocyte nuclear factor 1β (HNF1β) in PTDM. HNF1β plays a role in both insulin secretion and renal magnesium reabsorption [31]. Patients with mutations in the HNF1β gene develop diabetes mellitus and hypomagnesaemia [31, 32], and single nucleotide polymorphisms (SNPs) in HNF1β are associated with diabetes mellitus in the general population [33–36]. Interestingly, a recent study showed that CNIs down-regulate HNF1β, increasing the risk of PTDM 2- to 3-fold in patients with HNF1β mutations [37]. This provided a rationale to explore the role of HNF1β in KTRs receiving tacrolimus.
MATERIALS AND METHODS
Study design and population
This study was embedded within an investigator-initiated, prospective, randomized-controlled, parallel group, open-label, single centre clinical trial [38]. The objective of this randomized controlled trial was to investigate whether adaptation of the tacrolimus starting dose according to CYP3A5 genotype instead of body weight leads to an earlier achievement of the tacrolimus target whole-blood exposure. The design and rationale of the study have been described in detail elsewhere [38]. In brief, between 2010 and 2013, patients aged ≥18 years who were scheduled to receive a single-organ, blood group AB0-compatible kidney from a living donor in our centre, were screened. The final study population consisted of 237 patients. All patients gave written informed consent before inclusion and randomization. The study pre-specified three whole-blood tacrolimus target ranges: 10.0–15.0 ng/mL in Weeks 1 and 2; 8.0–12.0 ng/mL in Weeks 3 and 4; and 5.0–10.0 ng/mL after Week 4 post-KTR. The study was approved by the institutional review board of the Erasmus MC (Medical Ethical Review Board number 2010-080) and was registered in the Dutch national trial registry (http://www.trialregister.nl/trialreg/index.asp; number NTR2226, registered 25 February 2010).
Measurements
Pre-specified measurements of serum and urine magnesium, creatinine and non-fasting blood glucose levels were performed prior to transplantation and at 7 days and 1, 3, 6 and 12 months after KT. Blood and urine were collected on the same day. Prior to KT, only blood was collected. The measurements were performed by the Department of Clinical Chemistry using the Cobas 8000 modular analyzer series (Roche). Hypomagnesaemia was defined as serum magnesium level <0.70 mmol/L. The estimated glomerular filtration rate (eGFR) was calculated using the Chronic Kidney Disease Epidemiology Collaboration (CKD-EPI) equation [39]. Urine magnesium was expressed as ratio with urine creatinine. Whole-blood tacrolimus concentration was measured prospectively at 1, 3, 6 and 12 months after KT using an immunoassay. Because outpatient visits were not always scheduled exactly at these time-points, we allowed the following time windows for the measurements: Month 1 (20–40 days), Month 3 (76–106 days), Month 6 (157–207 days) and Month 12 (325–405 days). When multiple samples were available within the interval, the measurement closest to the defined time point was used for analysis. Information on age, sex, body mass index (BMI) and primary kidney disease of the patients was derived from the electronic case report forms of the original study.
Genetic analysis
To study the role of HNF1β in the risk of developing PTDM, we used a candidate gene approach to select different SNPs in HNF1β with a known association to diabetes mellitus (rs752010 G > A, rs4430796 A > G and rs7501939 C > T) [33]. To do so, DNA was extracted from peripheral blood leucocytes using the Blood DNA kit (Qiagen, Courtaboeuf, France) in accordance with standard protocols. Genotyping of the HNF1β allele was performed using TaqMan Assay reagents for allelic discrimination (Applied Biosystems, Courtaboeuf, France) with a 7900 Applied Biosystems thermal cycler. All genotyping was performed in duplo according to quality standards of the International Federation of Clinical Chemistry and Laboratory Medicine.
Outcome
The endpoint of this study was PTDM 1 year after transplantation. We chose the 1-year time point because (i) glucocorticoids are discontinued in our centre in all patients 3 months after transplantation and (ii) transient post-transplantation hyperglycaemia is usually resolved 1 year after transplantation, and does not predict PTDM [40]. PTDM was defined according to the American Diabetes Association as a fasting blood glucose >7.0 mmol/L, or a non-fasting blood glucose >11.1 mmol/L [41, 42]. Increased blood glucose levels were confirmed by repeat testing on a different day. In addition, patients who started with glucose-lowering drugs after KT were also considered to have PTDM.
Statistical analysis
Comparisons of the baseline characteristics of patients with PTDM and patients without PTDM were performed with Student’s t-tests for continuous variables and Chi-square tests for categorical variables. Missing data in covariates (<10% of total) were handled by multiple imputation using the Multivariate Imputation by Chained Equations package in R [43]. The number of imputed datasets was based on the average percentage of missing values [44], and the number of iterations gradually increased until convergence was achieved. Results are reported for imputed data, except for the baseline and genetic data. To examine the association between serum magnesium levels and whole-blood tacrolimus concentrations, univariate linear regression was used to calculate the betas, and univariate logistic regression was used to calculate odds ratios (ORs). Mixed-design analysis of variance (ANOVA) was used to test for differences in the repeated measurements (trajectories) of serum magnesium, whole-blood tacrolimus and eGFR in patients with and without PTDM. For the regression analyses, we calculated the area under the curve (AUC) for the trajectories of serum magnesium and whole-blood tacrolimus. In the univariate and multivariate logistic regression analyses, we included variables based on our hypothesis (serum magnesium and whole-blood tacrolimus AUC), and those which have previously been reported as risk factors for PTDM (age and BMI) [8]. Comparisons of the genetic characteristics of patients with PTDM and patients without PTDM were made with Chi-square tests. Univariate and multivariate logistic regressions, including dominant and recessive models, were used to examine the association between HNF1β SNPs and PTDM. A dominant model indicates that either one or two copies of the SNP allele are needed, whereas a recessive model indicates that two copies of the SNP allele are needed for the SNP to have an association with PTDM. Data were analysed using SPSS Statistics for Windows, Version 24.0 (IBM, Armonk, NY, USA) and R version 3.4.4 (R Foundation for Statistical Computing, Vienna, Austria). A two-sided P < 0.05 was considered as statistically significant.
RESULTS
Baseline characteristics
The original clinical trial included 237 patients who received their first KT from a living donor (Figure 1) [38]. Of these patients, 50 were excluded because of diabetes mellitus prior to transplantation, and 20 because of discontinuation of tacrolimus, loss-to-follow-up, transplant nephrectomy or death. This resulted in a total study population of 167 patients of whom 29 (17%) met our definition of PTDM. Despite our conservative definition of PTDM, this incidence is in agreement with previous studies [8, 45–47]. The mean age of the study population was 52 ± 14 years and 67 (40%) patients were female. Table 1 shows the comparison of the baseline characteristics of patients with or without PTDM. Patients with PTDM were significantly older (60 ± 7 versus 51 ± 15 years, P < 0.001) and had a higher BMI (28 ± 4 versus 26 ± 4 kg/m2, P = 0.004). Patients with PTDM also had a higher blood glucose level prior to KT and 1 year after KT. No differences in whole-blood tacrolimus, serum magnesium or urine magnesium/creatinine were observed. None of the patients had hepatitis C [48].
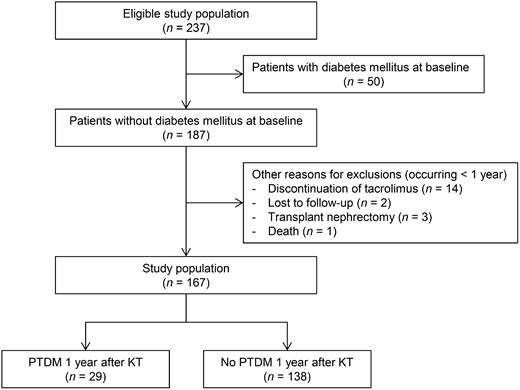
Flowchart of the study population. Of the 237 eligible patients, 50 patients were excluded because of pre-existing diabetes mellitus. Of the remaining 187 patients, 20 additional patients were excluded because of discontinuation of tacrolimus, loss-to-follow-up, transplant nephrectomy or death. This resulted in a total study population of 167 patients, which was further divided into 29 patients with PTDM and 138 participants without PTDM at 1 year after KT.
Comparison of baseline characteristics of patients with and without PTDM
| Characteristics | No PTDM | PTDM | P-value |
|---|---|---|---|
| (n = 138) | (n = 29) | ||
| General characteristics | |||
| Age, years | 51 ± 15 | 60 ± 7 | <0.001 |
| Female, n (%) | 57 (41.3) | 10 (34.5) | 0.5 |
| BMI, kg/m2 | 26 ± 4 | 28 ± 4 | 0.004 |
| Systolic blood pressure, mmHg | 136 ± 16 | 138 ± 13 | 0.7 |
| Diastolic blood pressure, mmHg | 82 ± 10 | 81 ± 8 | 0.4 |
| Primary kidney disease | |||
| Hypertension | 36 (26) | 12 (41) | 0.1 |
| Polycystic kidney disease | 27 (20) | 5 (17) | 0.8 |
| Glomerular disease | 33 (24) | 6 (21) | 0.7 |
| Other causes | 41 (30) | 6 (21) | 0.3 |
| Laboratory values prior to transplantation | |||
| eGFR, mL/min/1.73 m2 | 10 ± 5 | 10 ± 4 | 0.9 |
| Blood glucose, mmol/L | 5.1 (4.6–5.7) | 5.7 (5.2–6.6) | 0.003 |
| Serum magnesium, mmol/L | 0.86 ± 0.13 | 0.88 ± 0.13 | 0.4 |
| Laboratory values at 1 year | |||
| eGFR, mL/min/1.73 m2 | 48 ± 16 | 52 ± 17 | 0.3 |
| Blood glucose, mmol/L | 5.5 (4.9–6.2) | 6.6 (5.6–8.5) | <0.001 |
| Serum magnesium, mmol/L | 0.72 ± 0.09 | 0.69 ± 0.09 | 0.2 |
| Whole-blood tacrolimus, μg/L | 6.4 ± 2.7 | 6.4 ± 3.0 | 1.0 |
| Urine magnesium/creatinine, mmol/mmol | 0.38 ± 0.23 | 0.36 ± 0.19 | 0.8 |
Data are presented as n (%), mean ± SD or median (range).
Relationships between tacrolimus, magnesium and PTDM
We identified significant relationships between whole-blood tacrolimus concentration, serum magnesium levels and the risk of hypomagnesaemia at Year 1 (Table 2). Per microgram per litre increase in whole-blood tacrolimus concentration, the serum magnesium level decreased by 0.008 mmol/L (P = 0.003). In addition, per microgram per litre increase in whole-blood tacrolimus concentration, the OR for the development of hypomagnesaemia increased by 1.28 [95% confidence interval (CI) 1.09–1.50, P = 0.003]. Because serum magnesium levels did not differ between patients with and without PTDM at Year 1 (Table 1), we pursued a repeated measures (trajectory) analysis. In this analysis, we identified a significant difference between the serum magnesium trajectory of patients with PTDM compared with patients without PTDM (P = 0.04; Figure 2) . No significant differences were found between the whole-blood tacrolimus or eGFR trajectories of patients with and without PTDM.
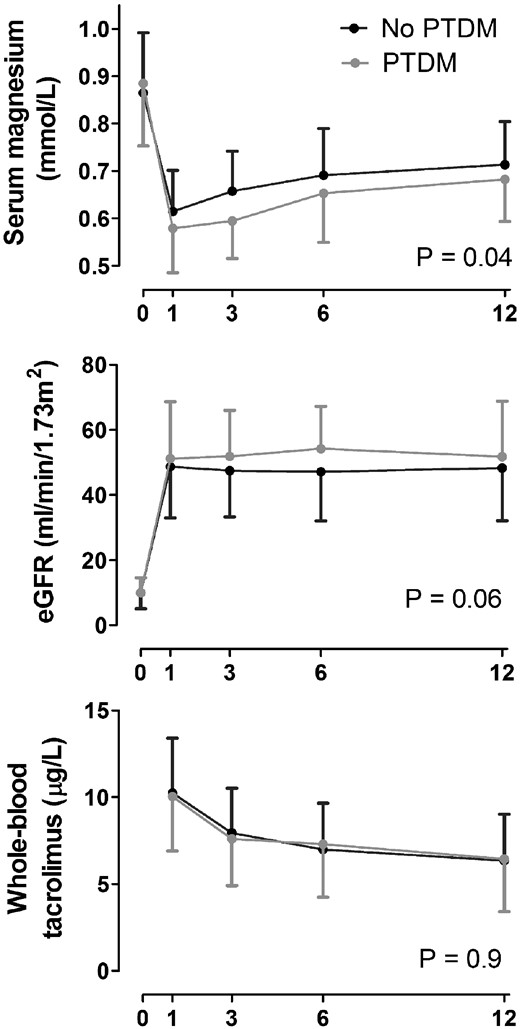
Serum magnesium, eGFR and tacrolimus trajectories during the first year after KT in patients with and without PTDM.
Association between whole-blood tacrolimus concentration, serum magnesium levels and the risk of hypomagnesaemia
| Outcome | β or OR (95% CI)a | P-value |
|---|---|---|
| Serum magnesium (mmol/L) | −0.008 (−0.014 to −0.0029) | 0.003 |
| Hypomagnesaemia (<0.70 mmol/L) | 1.28 (1.09 to 1.50) | 0.003 |
| Outcome | β or OR (95% CI)a | P-value |
|---|---|---|
| Serum magnesium (mmol/L) | −0.008 (−0.014 to −0.0029) | 0.003 |
| Hypomagnesaemia (<0.70 mmol/L) | 1.28 (1.09 to 1.50) | 0.003 |
Results are given per 1 μg/L increase in whole-blood tacrolimus.
Risk factors for PTDM
Possible risk factors for PTDM were analysed in univariate and multivariate models (Table 3). Based on our hypothesis, we included the AUC of the whole-blood tacrolimus and serum magnesium trajectories in the multivariate analysis in addition to age and BMI. In this multivariate analysis, age (OR = 1.05, 95% CI 1.01–1.10), BMI (OR = 1.11, 95% CI 1.01–1.23) and the serum magnesium AUC (OR = 0.98, 95% CI 0.96–1.00) were identified as independent risk factors for PTDM. Inclusion of the original trial assignment did not change the results.
Risk factors for the development of PTDM
| Univariate analysis | Multivariate analysis | |||
|---|---|---|---|---|
| Predictor | OR (95% CI) | P-value | OR (95% CI) | P-value |
| Age, per year | 1.06 (1.02–1.10) | 0.003 | 1.05 (1.01–1.11) | 0.01 |
| BMI, per 1 kg/m2 | 1.14 (1.04–1.25) | 0.006 | 1.11 (1.01–1.23) | 0.03 |
| Tacrolimus AUC | 1.00 (0.99–1.00) | 0.8 | 1.00 (0.99–1.00) | 0.6 |
| Serum magnesium AUC | 0.98 (0.96–1.00) | 0.01 | 0.98 (0.96–1.00) | 0.01 |
Calculated based on the trajectories in Figure 2.
AUC, area under the curve.
SNPs in HNF1β and the risk of PTDM
We analysed the prevalence of three HNF1β SNPs that were previously implicated in diabetes mellitus in the general population (rs752010 G > A, rs4430796 A > G and rs7501939 C > T) [33]. These SNPs were analysed both in recipients and donors to analyse if the association between the SNPs and PTDM could be explained by a renal or non-renal mechanism. When applying a recessive model, rs752010 G > A was significantly more common in patients with PTDM compared with patients without PTDM (Table 4). No significant differences were found for the other two SNPs (Supplementary data, Table S1). In an unadjusted recessive model, rs752010 G > A in KTRs was also associated with PTDM (Table 5). This association attenuated and became borderline significant when correcting for age and sex. No such associations were identified for the other two HNF1β SNPs (Supplementary data, Table S2). In addition, we found no association between HNF1β SNPs of the donor and the risk of PTDM (data not shown). Finally, we did not find a significant association between HNF1β SNPs and the risk of hypomagnesaemia (data not shown).
HNF1β SNP rs752010 G > A in kidney transplant recipients with or without PTDM
| HNF1β SNP rs752010 G > A | Genotype | Total population (n = 145), n (%) | No PTDM (n = 119), n (%) | PTDM (n = 26), n (%) | P-value |
|---|---|---|---|---|---|
| Genotype | GG | 30 (21) | 25 (21) | 5 (19) | 0.8 |
| AG | 72 (49) | 64 (54) | 8 (31) | 0.03 | |
| AA | 43 (30) | 30 (25) | 13 (50) | 0.01 | |
| Dominant | GG | 30 (21) | 25 (21) | 5 (19) | 0.8 |
| AG+AA | 115 (79) | 94 (79) | 21 (81) | 0.8 | |
| Recessive | GG+AG | 102 (70) | 89 (75) | 13 (50) | 0.01 |
| AA | 43 (30) | 30 (25) | 13 (50) | 0.01 |
Relationship between HNF1β SNP rs752010 G > A in the kidney transplant recipient and PTDM
| HNF1β SNP | Genotype | Model 1a | Model 2a | ||
|---|---|---|---|---|---|
| rs752010 G > A | OR (95% CI) | P-value | OR (95% CI) | P-value | |
| Dominant | GG | Ref. | Ref. | Ref. | Ref. |
| AG+AA | 1.10 (0.38–3.22) | 0.9 | 0.98 (0.32–2.97) | 1.0 | |
| Recessive | GG+AG | Ref. | Ref. | Ref. | Ref. |
| AA | 2.56 (1.05–6.23) | 0.04 | 2.24 (0.90–5.57) | 0.08 | |
Model 1: unadjusted; Model 2: adjusted for age and sex.
DISCUSSION
PTDM is a major metabolic complication of KT, but its pathogenesis is incompletely understood. In this prospective study, we analysed the role of tacrolimus and serum magnesium on PTDM. We show that there is a concentration-dependent effect of the CNI tacrolimus on serum magnesium (Table 2) and that the serum magnesium AUC in the first year after KT is an independent risk factor for the development of PTDM (Table 3). We also added an exploratory analysis on the role of genetic variation in the HNF1β gene on the risk of PTDM. This HNF1β hypothesis was based on reports that (i) patients with HNF1β mutations develop hypomagnesaemia and diabetes mellitus [32, 49, 50], (ii) patients with HNF1β mutations are more prone to develop PTDM [37], (iii) CNIs down-regulate HNF1β [37] and (iv) SNPs in HNF1β are associated with diabetes mellitus in the general population [33–36, 51, 52]. Although the univariate analysis showed an association between the HNF1β SNP rs752010 G > A and PTDM, significance was lost when adjusting for age and sex (Table 5). Because our study was not specifically powered to analyse this association, analysis in a larger cohort is of interest.
Van Laecke et al. [2] were the first to identify associations between the use of CNIs, serum magnesium and the risk of developing PTDM. They showed that patients with PTDM had lower serum magnesium levels and that lower serum magnesium levels resulted in a faster development of PTDM. Based on their analysis, they concluded that the association between CNI use and PTDM is largely attributable to CNI-induced hypomagnesaemia. Similarly, Garg et al. [28] showed that a lower serum magnesium level at 1 month after transplantation predicted PTDM as well as pre-diabetes. Huang et al. [27] performed the largest retrospective study to date (948 non-diabetic KTRs) and showed that both a lower post-transplant serum magnesium level and hypomagnesaemia are independent risk factors for PTDM. Stevens et al. [53] showed that a single-dose rabbit anti-thymocyte globulin resulted in less PTDM than a divided-dose, and that this also coincided with less hypomagnesaemia. In contrast, three retrospective studies (with a study population ranging from 205 to 589 patients) were unable to find an association between serum magnesium and PTDM [3, 29, 30]. This discrepancy may be explained by the fact that the studies by Van Laecke et al. [2], Huang et al., [27] and our study analysed multiple serum magnesium values rather than focusing on a single value [28]. This suggests that the duration of the exposure to lower serum magnesium concentrations is important for the risk of PTDM. This may also relate to the fact that serum magnesium is a poor reflection of the intracellular magnesium concentration, which is biologically more relevant [54].
Our research questions primarily focused on the pathogenesis of PTDM, but may also be relevant clinically. Although the association between lower serum magnesium and diabetes mellitus has long been recognized [22], the causality of this association has remained unclear. Hypomagnesaemia may predispose to diabetes mellitus, but hyperglycaemia could also lead to increased urinary magnesium excretion and therefore hypomagnesaemia. To investigate this directionality, we recently analysed whether a lower serum magnesium predicts subsequent pre-diabetes in the general population [23]. Patients with pre-diabetes are less likely to develop hyperglycaemia and therefore urinary magnesium loss. This study showed that lower serum magnesium was independently associated with a higher pre-diabetes risk after a median follow-up of 5.7 years [23]. A clinically more relevant question is whether correction of magnesium deficiency is able to improve glycaemic control. Several clinical trials have shown that oral magnesium supplementation can indeed increase serum magnesium and improve the levels of fasting glucose, insulin and glycated haemoglobin [55–57]. A recent experimental study extended these effects by showing that magnesium supplementation also improves mitochondrial function, reduces oxidative stress and improves diastolic dysfunction in diabetic mice [58]. One research group performed two small clinical trials with magnesium supplementation in hypomagnaesemic KTRs on tacrolimus [59, 60]. The first trial showed an effect of magnesium supplementation on fasting glucose but not insulin resistance [60], whereas the second trial showed no effects on insulin secretion [59]. Of note, in both trials magnesium oxide was used, which has a relatively low bioavailability and high risk of diarrhoea compared with some of the other magnesium salts (e.g. magnesium chloride, citrate or lactate) [61, 62].
The association between the HNF1β SNP rs752010 G > A and PTDM requires further confirmation. Several other SNPs have been linked to PTDM risk in KTRs, the majority related to β cell function [63]. One recent study also analysed the association between three HNF1β SNPs and PTDM, but did not find an association [64]. However, HNF1β SNPs have been identified as risk factors in several studies on the genetic susceptibility of diabetes mellitus [33–36, 51, 52]. Several of these diabetes mellitus susceptibility genes also predispose to PTDM, especially TCF7L2 [65]. The reason for focusing on HNF1β SNPs in this study was that HNF1β could link CNIs, serum magnesium and PTDM. In this view, patients with HNF1β SNPs would be more sensitive to CNI-induced hypomagnesaemia and therefore PTDM. However, our data do not support this theory, because (i) HNF1β SNPs were not associated with hypomagnesaemia and (ii) HNF1β SNPs in donors were not associated with PTDM risk. The HNF1β SNP rs752010 G > A did show a positive association with PTDM risk in recipients, but lost significance after correction for age and sex. The value of this finding remains uncertain in a study that was not specifically powered to address this association, and it would be of interest to analyse this SNP in a larger cohort of PTDM. If HNF1β increases the risk of PTDM, this is likely mediated through an effect on insulin secretion (recipient effect) rather than an effect on renal magnesium handling (donor effect).
This study has a number of strengths. First, it is the first study to analyse the relationship between tacrolimus, serum magnesium and PTDM in a prospective fashion. Serum magnesium is not always routinely measured [66], and previous studies may, therefore, have suffered from confounding by indication. Secondly, we defined PTDM conservatively as diabetes mellitus 1 year after transplantation to exclude transient forms of PTDM that occur early after transplantation. Thirdly, we analysed the risk factors of PTDM independent of glucocorticoids because these are discontinued 3 months after KT in our centre. Glucocorticoids can also cause renal magnesium loss and contribute to PTDM [26, 67]. Thus, defining PTDM at Year 1 allowed us to more specifically address the role of tacrolimus on serum magnesium and PTDM risk. Finally, analysing HNF1β SNPs in both recipient and donor allowed us to address the question how HNF1β may contribute to PTDM.
Our study also has a number of limitations. First, this study was conducted within the framework of a previously conducted clinical trial [38]. Therefore, the study was not specifically powered for the research questions of this analysis. However, when designing the trial, this study was already planned with measurements of serum and urine magnesium at pre-specified time points. The relatively small sample size did not allow adjustment for multiple covariates and confounders, which may have limited the external validity of the study. Secondly, because this was a cohort of KTRs using tacrolimus, we did not have patients on ciclosporin or a CNI-free regimen as comparators. Thirdly, the availability of HbA1c or oral glucose tolerance testing may have resulted in a different incidence of PTDM. Finally, reverse causality cannot be excluded. For example, patients who developed PTDM had higher blood glucose prior to KT, as was also observed by Van Laecke et al. [2]. This could imply that these patients were more prone to glycosuria and therefore renal magnesium loss. Conversely, it could also imply that a lower magnesium after KT contributed to the evolution from pre-diabetes to diabetes.
In conclusion, in the first year after KT, a higher tacrolimus whole-blood concentration is associated with lower serum magnesium and an increased risk of hypomagnesaemia. Lower serum magnesium in the first year after KT is an independent risk factor for PTDM. A separate and novel risk factor for PTDM may be the HNF1β SNP rs752010 G > A in KTRs, although this finding requires confirmation in a larger cohort.
FUNDING
This work was supported by a Dutch Kidney Foundation grant to EJH (14OKG19).
AUTHORS’ CONTRIBUTIONS
E.J.H. conceived the idea for this study. D.A.H. coordinated the clinical trial. A.C.B., A.M. and B.C.T.K. collected and analysed the data. R.H.N.S. facilitated the SNP analyses. A.C.B., A.M. and E.J.H. wrote the manuscript. T.G. and R.Z. provided supervision. All authors discussed the results and contributed to the final manuscript.
CONFLICT OF INTEREST STATEMENT
None declared.
REFERENCES
Author notes
Anna C. van der Burgh and Arthur Moes contributed equally to this work.


Comments