


Abstract
Observational studies have suggested a relationship between the plasma concentration of indoxyl sulfate (IS) and p-cresyl sulfate (PCS), small gut-derived ‘uremic solutes’, and the high incidence of uremic cardiomyopathy in patients with end-stage renal disease (ESRD). IS and PCS are derived from the metabolism of dietary components (tryptophan and tyrosine) by gut bacteria. This pilot study was designed to examine the effects of a poorly absorbable antibiotic (vancomycin) on the plasma concentration of two gut-derived ‘uremic solutes’, IS and PCS, and on the composition of the gut microbiome.
Plasma concentrations of IS and PCS were measured by MS-HPLC. The gut microbiome was assessed in stool specimens sequenced for the 16S rRNA gene targeting the V4 region.
The pre-dialysis mean plasma concentrations of both IS and PCS were markedly elevated. Following the administration of vancomycin (Day 0), the IS and PCS concentrations decreased at Day 2 or Day 5 and returned to baseline by Day 28. Following vancomycin administration, several changes in the gut microbiome were observed. Most striking was the decrease in diversity, a finding that was evident on Day 7 and was still evident at Day 28. There was little change at the phylum level but at the genus level, broad population changes were noted. Changes in the abundance of several genera appeared to parallel the concentration of IS and PCS.
These findings suggest that alteration of the gut microbiome, by an antibiotic, might provide an important strategy in reducing the levels of IS and PCS in ESRD.
INTRODUCTION
Vanholder and the EUtox group [1] identified more than 100 solutes that were significantly increased in concentration in the plasma of patients with reduced glomerular filtration. Of particular importance is a group of solutes that are small, ∼250 Da, are protein-bound, predominantly to albumin, and are therefore too large to be filtered across the glomerular capillary membrane or to diffuse across a dialysis membrane. Several solutes in this latter group, identified as ‘uremic solutes’, including indoxyl sulfate (IS) and p-cresyl sulfate (PCS), are actively transported by organic anion transporters (OATs) in the proximal renal tubule [2–5]. Observational studies have suggested a relationship between the plasma concentration of IS and PCS, both gut-derived ‘uremic solutes’, and the frequency of cardiovascular disease in patients with chronic kidney disease (CKD) [6–8]. Uremic plasma has been found to induce dysregulation of the expression of more than 2000 genes in cultured human renal tubular cells. Most of this gene dysregulation is not corrected by dialysis; 80% of this gene dysregulation is mimicked by spiking normal plasma with IS [9]. In vitro studies of the ‘downstream’ effects of IS in cultured cells have demonstrated that this solute combines with the cytoplasmic aryl hydrocarbon receptor, and is translocated to the nucleus where, after binding to the nuclear aryl hydrocarbon receptor, it acts as a transcription factor for many profibrotic molecules, i.e. ‘tissue factors’ [10, 11]. With the recognition of the important role these protein-bound solutes play in the cardiovascular outcome in chronic renal disease, there is considerable interest in the nature and origin of uremic toxins and consideration of possible approaches to reducing the plasma concentration of these ‘uremic solutes’ in patients undergoing hemodialysis or peritoneal dialysis and in patients in earlier stages of CKD [12].
Many of these uremic solutes are known to originate from the gut and, in some instances, are the products of bacterial enzymatic metabolism of dietary substrates [13–16]. This finding is based on the observation that IS and PCS are present at significantly lower concentrations in end-stage renal disease (ESRD) patients who have undergone prior total colectomy [15] and the finding that IS production is much lower in germ-free rodents as compared with conventional rodents [17]. Indole is produced from tryptophan by intestinal bacterial tryptophanases. Indole is readily absorbed into the portal circulation; in the liver it undergoes hydroxylation and sulfation, yielding IS [16]. Similarly, gut microbiota metabolize tyrosine to form 4-hydroxyphenylacetic acid, which is decarboxylated to form p-cresol, the precursor of PCS [16]. The major metabolizers are aerobes, mainly Enterobacteria, but anaerobes (e.g. Clostridium perfringens) also play a role. The fact that these protein-bound uremic solutes, believed to be toxic, are poorly removed by hemodialysis or peritoneal dialysis, has led to efforts to alter the gut microbiome to reduce IS and PCS production.
We here examine the effects of orally administered vancomycin on the plasma concentration of IS and PCS, in relation to changes in fecal microbiome composition, in a small group of patients with ESRD undergoing chronic hemodialysis. The glycopeptide antibiotic, vancomycin, is commonly used to treat Gram-positive infections [18]. Because of low systemic absorption, oral vancomycin is used to treat Clostridium difficile infection and is well tolerated. Oral vancomycin has been observed to disturb murine gut microbial communities, with increased uracil, amino acids and short-chain fatty acids (SCFA), and decreased metabolites, hippurate and phenylacetyl glycine in urine [19].
MATERIALS AND METHODS
Study subjects
The study protocol was approved by the NYULMC Institutional Review Board. Ten subjects with ESRD receiving thrice weekly hemodialysis in the River Renal Dialysis Unit of Bellevue Hospital were recruited and submitted witnessed, written consent after careful explanation of the procedures and the risks and benefits of the study (Table 1). We excluded subjects with a history of prior adverse reactions to vancomycin, subjects with a history of current or prior diarrheal disease and subjects who had received any antibiotic during the 3-month period prior to the study. Further, we excluded subjects with a prior history of C. difficile infection whether treated or not, and subjects with elevated white blood cell count or fever within 1 week of enrollment. The subjects, identified here by the letters A through J, were predominantly male and ranged in age from 27 to 67 years. They had been receiving hemodialysis for 2–8 years; pre-dialysis serum creatinine values ranged from 6.7 to 15.4 mg/dL.
Clinical characteristics of subjects
| Subject | Gender | Age (years) | Race | Etiology | Started HD | BUN (mg/dL) | Creatinine (mg/dL) |
|---|---|---|---|---|---|---|---|
| A | M | 63 | OTHER | HTN | 2011 | 92 | 15.4 |
| B | M | 46 | ASIAN | UNK | 2009 | 100 | 14.4 |
| C | M | 27 | HISP | HTN | 2011 | 66 | 12.9 |
| D | M | 67 | ASIAN | UNK | 2010 | 76 | 6.7 |
| E | M | 64 | ASIAN | HTN, DM | 2010 | 47 | 7.9 |
| F | M | 39 | AFRO | IGA NEPH | 2012 | 50 | 7.8 |
| G | M | 30 | ASIAN | HTN | 2012 | 71 | 11.0 |
| H | M | 45 | AFRO | HTN | 2008 | 67 | 12.5 |
| I | M | 57 | ASIAN | HEP B | 2011 | 61 | 8.2 |
| J | F | 49 | CAUC | HTN | 2012 | 62 | 10.0 |
HD, hemodialysis; BUN, blood urea nitrogen; HISP, Hispanic; AFRO, Afro-American; CAUC, Caucasian; HTN, hypertension; UNK, unknown; DM, diabetes mellitus; IGA NEPH, IgA nephropathy; HEP B, hepatitis B.
On Day −2 pre- and post-dialysis blood samples were obtained. Pre- and post-dialysis blood samples were collected 2 days later (Day 0). At the conclusion of this 3–3.5 h hemodialysis, each subject ingested a single 250 mg capsule of vancomycin. Subsequent pre-dialysis blood samples were obtained 2, 5, 7, 14 and 28 days following vancomycin administration. A fecal specimen was obtained on the day preceding Day 0 and on Days 7 and 28 following vancomycin administration.
All hemodialyses were carried out utilizing Fresenius models 2008K and 2008K2 Dialyzers, and Fresenius F180 polysulfone cartridges. The dialysate (Rockwell Medical) contained HCO3− 37 mEq/L, acetate 4 mEq/L, Na+ 140 mEq/L, and Ca++ 2.5 mEq/L. Measurement of the composition of dialysis fluid entering the dialysis cartridge (Siemens ABL90 analyzer) yielded a value for bicarbonate concentration of 33 mEq/L. The dialysate flow rate was 800 mL/min.
Metabolic tests
Blood samples were collected from the dialysis line proximal to the dialysis cartridge, into tubes with citrate anti-coagulant, kept on ice and separated by centrifugation within 1 h. Plasma was stored at −80°C. IS and PCS concentrations were measured by LC-MS with an Aigent 6460 Triple Quadripole LC-MS/MS system. IS (Sigma-Aldrich) and PCS (generously provided by Dr Bjorn Meijers) were dissolved in methanol to create standard curves against which to test the plasma samples.
Microbiome assessments
Fecal samples were collected in RNAlater™ (Sigma-Aldrich) and stored at −80°C. DNA was extracted using the MoBio PowerSoil DNA Extraction Kit (Mo-Bio Laboratories) and the microbial 16S rRNA gene was amplified with barcoded fusion primers, targeting the V4 region. Twenty-six samples were sequenced with the Illumina Miseq platform [20]. Using the QIIME pipeline, these underwent quality filtering of DNA sequences, demultiplexing, taxonomic assignment and alpha and beta diversity calculations [21] (Figure 1). UniFrac distances were used to compare bacterial communities by the taxa present in the community [22]. Metagenomic content of the microbiota samples was predicted from the 16S rRNA profiles; Kyoto Encyclopedia of Genes and Genomes (KEGG) pathway functions were categorized at level using phylogenetic investigation of communities by reconstruction of unobserved states (PICRUSt) [23], which predicts and compares bacterial pathways in different samples. Linear discriminant analysis effect size (LEfSe) [24] was used to detect significant changes in relative abundance of microbial taxa and predicted KEGG pathways post-vancomycin (Days 7 and 28). LEfSe analyzes the abundances of all taxa to test whether values in two groups of samples are differentially distributed. Taking into account variability and discrimination power, the LDA model then ranks the taxa based on relative differences between two samples.
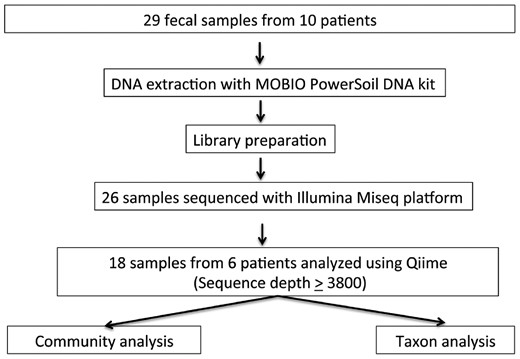
Processing of fecal samples. Of 29 fecal samples that were subject to DNA extraction and downstream processing, we studied only complete sample sets. In total, 18 samples from six subjects were analyzed using QIIME pathways and analytic tool.
RESULTS
Clinical outcomes
There were no adverse clinical events during the study.
Effects of vancomycin on solute concentrations
Before receiving vancomycin, on Days −2 and 0, the mean levels of IS agreed closely and were markedly elevated, 35.50 ± 9.3 (SE) and 39.34 ± 9.44 (SE) μg/mL, respectively, compared with the means of normal subjects in two prior studies (0.89 μg/mL [9], 1.1 μg/mL [25]). Levels of PCS were similarly elevated, 28.85 ± 7.37 (SE) and 47.49 ± 7.54 (SE) μg/mL, respectively, compared with mean levels in normal subjects, 1.93 μg/mL [25] (Table 2). The baseline (pre-dialysis) values for IS and PCS were highly variable among the 10 subjects in this study (Figure 2A), comparable to our prior observations in ESRD patients [9] and a larger group of patients with CKD reported by Suchy-Dicey et al. [25]. While baseline IS and PCS levels correlated poorly with levels of creatinine (Figure 2A), IS and PCS were themselves significantly correlated (Figure 2B).
Plasma concentrations of uremic solutes before and following administration of vancomycin on Day 0
| IS (µg/mL) | PCS (µg/mL) | |||||||||||||
|---|---|---|---|---|---|---|---|---|---|---|---|---|---|---|
| Subject | Day −2 | Day 0 | Day 2 | Day 5 | Day 7 | Day 14 | Day 28 | Day −2 | Day 0 | Day 2 | Day 5 | Day 7 | Day 14 | Day 28 |
| A | 98.3 | 104 | 58 | 106 | 147 | 33.9 | 104.2 | 58 | 75.1 | 72.4 | ||||
| B | 40.8 | 54.9 | 55 | 41.7 | 16.8 | 77.4 | 57.9 | 30.5 | 59.5 | 34.2 | 56.9 | 40.5 | 17.7 | 40.3 |
| C | 79 | 33 | 52.1 | 40.1 | 31.4 | 48.2 | 32.5 | 18.6 | 49.6 | 46 | 38.6 | 28.2 | ||
| D | 46.3 | 72.3 | 70 | 19.9 | 51.7 | 59.7 | 33 | 61 | 20.9 | 34.5 | 54.4 | 52.8 | ||
| E | 12.1 | 10.4 | 7.7 | 34.5 | 8.5 | 16.3 | 4 | 12.4 | 3.3 | 14.2 | 7.1 | 3.6 | ||
| F | 1.42 | 5.31 | 2.9 | 3.2 | 2.5 | 5.9 | 0 | 0 | 0 | 0 | 0.22 | 0 | ||
| G | 13.4 | 16.1 | 9.6 | 13.2 | 10 | 9.2 | 10 | 20.6 | 8.6 | 8.6 | 13.2 | 25.8 | 14 | 25.8 |
| H | 4.25 | 20.5 | 16 | 4.3 | 12.9 | 40.5 | 22.2 | 9.7 | 53.5 | 34.3 | 9.7 | 24.1 | 22.5 | 40.5 |
| I | 30.5 | 30.5 | 23 | 23.4 | 32 | 19.8 | 87.9 | 87.5 | 32 | 7.6 | 41.4 | 70.5 | ||
| J | 28.9 | 28.9 | 43 | 26.3 | 32 | 29.2 | 28.6 | 36.4 | 36.4 | 35.1 | 12.2 | 39.7 | 48.2 | 41.5 |
For statistical analysis, see Figure 3 and Supplementary data, Figure S1.
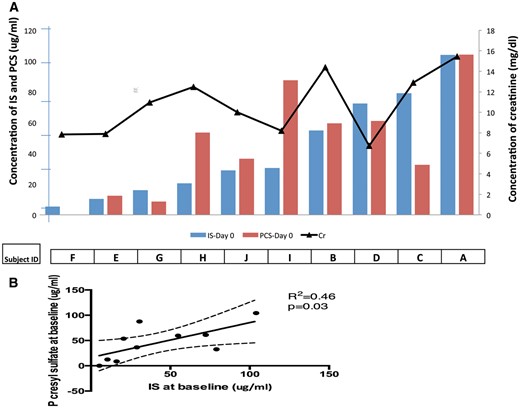
IS, PCS and serum creatinine. (A) Ten subjects are ranked in order of increasing baseline pre-dialysis plasma IS concentration (blue bars). Corresponding PCS concentrations are shown (red bars). The black line depicts the pre-dialysis serum creatinine (Cr) concentration for each subject. (B) Correlation between serum concentrations of IS and PCS (P = 0.03). However, neither IS nor PCS concentration correlated significantly with serum creatinine concentration.
To examine the changes in mean solute levels, we performed a linear mixed effects model analysis. We used the R statistical [26] computing environment including the packages lme4 [27], lmerTest [28] and lsmeans [29]. The model included the number of days from vancomycin administration as a categorical fixed factor, the type of solute (IS or PCS) as a categorical fixed factor and subject as a random factor. If there was a significant overall test for a fixed factor, least square means were obtained and differences among the least square means were tested using Tukey’s post hoc ‘Honestly Significant Difference’ method, calculated using error terms based on the model and Satterthwaite approximate degrees of freedom (Figure 3 and Supplementary data, Figure S1).
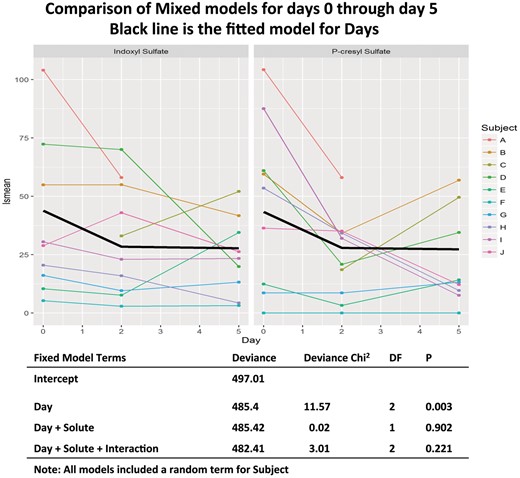
IS and PCS concentrations at baseline and on Days 2–5 following vancomycin. Left panel IS; right panel PCS. The heavy black lines are the fitted data from the mixed models analysis.
In a mixed models analysis of the levels of solute found on Days 0, 2 and 5, summarized in Figure 3, we found evidence for significant differences between the study days (χ2 = 11.57, df = 2, P = 0.003), but no significant difference between solutes and no significant interaction between the type of solute (IS versus PCS) and study day. When the least square means were examined using Tukey’s method, the lsmean solute levels on Days 2 and 5 were significantly reduced compared with Day 0 (P = 0.008 for each comparison). In most subjects the value for IS and PCS reached their nadir on between Days 2 and 7 (Table 2, Figure 3). Levels returned toward baseline by Day 28 (Table 2 and Supplementary data, Figure S1). The same analysis performed by fitting the model to the full data set from Day −2 through Day 28 showed a similar pattern of significance in the analysis of deviance; however, the significance of the individual pairwise comparisons between days became non-significant (P = 0.053 for Day 2 versus Day 0 and P = 0.073 for Day 5 versus Day 0 (Supplementary data, Figure S1). No significant differences were seen in any of the other pairwise comparisons.
Effects of vancomycin on the gut microbiota
To assess changes in the intestinal microbial community structure induced by antibiotic intervention, measures of richness and evenness were calculated based on microbial 16S rRNA sequences in fecal samples obtained from subjects at baseline, and 7 and 28 days post-antibiotic. After the vancomycin ingestion, community taxonomic richness decreased, as measured by the number of observed Operational Taxonomic Units (OTUs), Chao 1 index (data not shown) and phylogenic distances, as well as evenness, as calculated by the Shannon metric (Figure 4). The trend continued to Day 28.
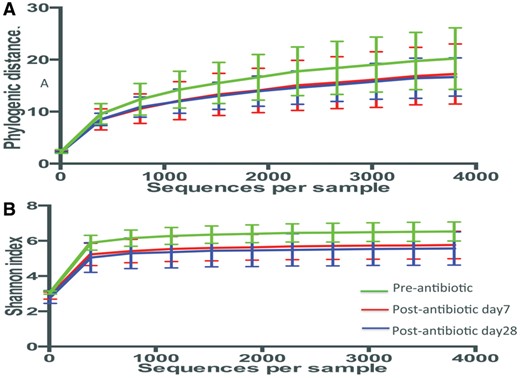
Alpha-diversity. Rarefaction analysis of gut microbiota from six patients, based on the time of antibiotic exposure (green: pre-vancomycin; red: 7 days post-vancomycin; blue: 28 days post-vancomycin). The depth is 3800 sequences per sample. No significant differences were found between any two groups in any indexes by Student’s t-test with 1000 Monte Carlo simulations. (A) Rarefaction measured with phylogenetic distance. (B) The Shannon index was used to measure species evenness in the groups.
The differences in microbial community structure in the fecal specimens from subjects sampled before and after vancomycin were assessed by unweighted Unifrac distances [21], and visualized by Principal Coordinates Analysis (PCoA). Nearly half (49%) of the total variation in β-diversity between the samples could be resolved on the first three PCoA axes. Importantly, most samples clustered tightly by subject (Figure 5A). The shifts from baseline to Day 7 due to vancomycin treatment were in different directions, as captured by the PCoA. In four of the six subjects studied, the greatest shift occurred by Day 7 with little change to Day 28 (Figure 5B).

Clustering of 18 samples from six patients pre- and post-vancomycin exposure. Sequences analyzed at depth 3800. (A) PCoA of the unweighted Unifrac distances for the samples at different time points (green: pre-vancomycin; red: 7 days post-vancomycin; blue: 28 days post-vancomycin). (B) Inter- and intra-group beta-diversity. Mean (±SEM) pairwise Unifrac distance obtained by unweighted methods. No significant differences were found between different time points by one-way ANOVA with the Tukey method for correction for multiple comparisons.
There were no significant changes across the three time points in the mean pairwise Unifrac distances over time in both the unweighted (Figure 5), and the weighted analyses (Supplementary data, Figure S2). This indicates that the amount of difference (distance) in the totality of the samples did not change much across 18 time points. As an ecological concept, it is recognized that communities have variation. While we observed variation within a community at each time point, the totals did not change much, i.e. everything stayed within certain boundaries. One might have hypothesized that there would be greater variation as a result of the antibiotic exposure but that was not what was observed. Similar clustering patterns were demonstrated by the Unweighted Pair Group Method with Arithmetic Mean (UPMGA) cluster analysis (data not shown).
Microbial population changes
To assess the specific changes in intestinal taxa, we compared the relative abundance of predominant (>1%) taxa identified from the sequences obtained before and after vancomycin treatment. Following treatment, there was little change at the phylum level (Figure 6A) but at the genus level (Figure 6B), broad population differences were noted. Changes in the abundance of several genera appeared to parallel the concentration of the metabolic products, IS and PCS.
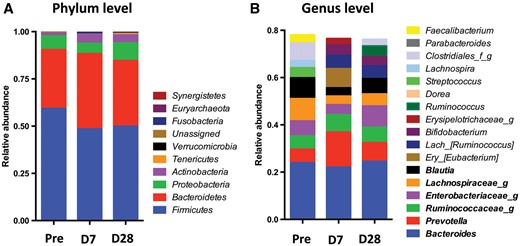
Taxonomic analysis of six patients pre- and post- vancomycin exposure. Pre: pre-vancomycin; D7: 7 days post-vancomycin; D28: 28 days post-vancomycin. (A) Phylum level. (B) Genus level: the 10 most abundant genera in each group are included. The genera shown in bold are among the 10 most abundant in all three groups.
Enterobacteriaceae, Lachnospiraceae and Blautia decreased at Day 7 and returned to or above baseline at Day 28, which matched the decline and subsequent rebound of plasma IS concentrations (Table 2, Figure 3 and Supplementary data, Figure S1). Taxa including Clostridia, Lachnospiraceae (Roseburia), Enterococcaceae and Bacteroidales (S24-7) diminished significantly (log LDA score >3) following treatment (Day 7), while Veillonellaceae increased (Figure 7A). Similarly, between Days 7 and 28, Bilophila significantly decreased (data not shown). When compared with baseline, there was a continued significant decrease in Lachnospiraceae (Roseburia) and Clostridiales at Day 28 (Figure 7B). These taxa (e.g. Clostridiales) include bacterial strains containing genes encoding tryptophanase and tyrosine-degrading enzymes.
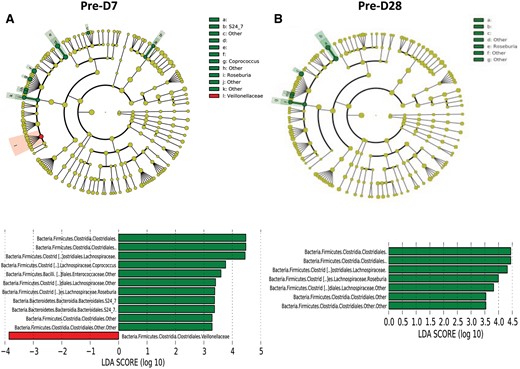
Comparison of microbiome differences in six patients pre- and post-vancomycin exposure. (A) Cladogram, generated from LEfSe analysis, represents taxa with enriched representation (P < 0.05) in 12 samples from the six patients (green: pre-vancomycin; red: 7 days post-vancomycin). The central points represent the root of the tree (Bacteria and Archaea), and each ring represents the next lower taxonomic level (phylum through genus). The diameter of each circle represents the relative abundance of the taxon. The strategy of multiclass analysis is the strict (all classes differential) analysis. Histogram of the LDA scores computed for features differentially abundant by vancomycin exposure status. LEfSe detects 10 microbial biomarkers with abundance differential in different time points. Pre-D7: predialysis Day 7; Pre-28: predialysis Day 28. (B) Cladogram, generated from LEfSe analysis, represents taxa with enriched representation (P < 0.05) in 12 samples from the six patients (green: pre-vancomycin; red: 28 days post-vancomycin). Histogram of the LDA scores computed for features differentially abundant by vancomycin exposure status. LEfSe detects seven microbial biomarkers with abundance differential in different time points.
Analysis of predicted metagenomes
For the samples obtained at Day 7 compared with baseline, PICRUSt showed a significantly decreased representation of seven predicted KEGG pathways in the bacterial populations and enrichment or increased representation of one metabolic pathway. There were substantial commonalities at Days 7 and 28, with no significantly different pathway representation (Supplementary data, Figure S3). Only the predicted KEGG pathway involved in synthesis and degradation of ketone bodies had significantly lower representation at Day 28 compared with baseline. These results indicate potential shifts in bacterial functions that were more prominent early following the vancomycin treatment.
DISCUSSION
This pilot study provides data that confirms our prediction that antibiotic-induced alteration of the gut bacterial populations would alter plasma concentrations of IS and PCS, both important gut microbiota-derived metabolites.
Since genes encoding the degradation of tyrosine and tryptophan have been identified in multiple bacterial families that colonize the human gut [30], the effects of antibiotic intervention on the tryptophan- and tyrosine-degrading microbiota were not predictable. Further, vancomycin might have exerted its effects on bacterial species responsible for the metabolism of poorly digested carbohydrates to SCFA, which interact with IS and PCS [30]. The vancomycin-induced decrease in plasma IS and PCS concentrations could be explained by suppression of specific tryptophan or tyrosine degrading microbiota, and/or by increase in competing taxa that bloomed in the vancomycin-perturbed gut. The recovery of uremic solute production at Day 28 suggests resilience of the taxa responsible for its generation in ESRD patients. While the observed decrease in plasma IS and PCS concentrations following a single vancomycin dose were transient, the fecal microbiome showed persistent diminution of multiple OTUs, of unknown consequence. The persistent trend of decreased diversity 4 weeks after the administration of vancomycin was unanticipated. A study of the response to ciprofloxacin in three normal subjects observed ‘taxonomic composition of the community closely resembled its pretreatment state by 4 weeks after the end of treatment, but several taxa failed to recover within 6 months' [31]. It is not clear at this time whether the persistent decrease in population diversity in our subjects was related to the specific effect of vancomycin, the uremic state or some other factor not identified.
While the primary focus of this pilot study was to compare the gut production of two uremic metabolites (IS and PCS) and microbiome changes in response to perturbation of the gut flora by an oral antibiotic, the very great variation in the ‘baseline’ plasma concentrations of the two solutes warrants comment. Considered as uremic solutes, it is evident that the range of observed baseline IS and PCS values in the subjects reported here far exceeds the range of values for pre-dialysis creatinine concentration, a solute widely taken as an index of the degree of reduced renal function [25] (Figure 2A). Our finding is in accord with a previous study in 75 patients undergoing maintenance hemodialysis, which reported IS values ranging from 1.1 to 44.2 μg/mL and PCS concentrations ranging from 0.9 to 84.0 μg/mL [32]. Meijers et al. [32] reported that plasma concentrations of bound solutes (IS, PCS and hippurate) varied more than plasma urea concentration in 25 subjects undergoing regular hemodialysis and concluded, based on measurements of spent dialysate, that this was attributable to enhanced solute generation rather than differences in renal excretion.
The differential presence of the bacterial taxa responsible for generating these gut-derived uremic solutes provides a parsimonious explanation for the wide range in their baseline concentrations. The prominent role of the gut in the generation of uremic solutes [13–16] supports our conclusion that the effect of vancomycin on their plasma concentrations was most likely related to compositional microbiome changes. Alterations in the gut microbiome related to uremia, bowel motility, prior antibiotic use and relative dietary abundances of substrates such as tryptophan and tyrosine and complex carbohydrates, probably modified the generation of the gut-derived uremic retention solutes at baseline. Although we did not monitor the dietary intake or changes in bowel habits of our subjects, the absence of gastrointestinal complaints or dietary changes among the subjects makes it unlikely that these factors explain our findings.
The alternative explanation for the wide range of baseline IS and PCS concentrations, that differences in their renal excretion are responsible, is also unlikely. Protein-binding limits the glomerular filtration of IS, which is actively secreted by OAT 1 and OAT 3 on the basolateral membrane of proximal tubular cells [2–4]. Residual renal function (RRF), continued urine production in patients undergoing chronic hemodialysis or peritoneal dialysis, represents a significant contribution of tubular secretion of protein-bound solutes and osmotically obligated fluid to unreabsorbed glomerular filtrate [3, 33, 34]. Some of the variability in plasma IS concentration among ESRD patients might be related to the extent that OAT-mediated proximal tubular secretion is preserved, but the great variability in published values of IS and PCS in patients with ESRD [32] and the small difference in IS values in patients with and without RRF [9] make it unlikely that differences in renal excretion of IS and PCS account for the great variability among patients.
Similar considerations might apply to the observed variation in the protein-bound PCS. In 203 patients with CKD stages 1–5, IS and PCS clearances were both linearly related to glomerular filtration rate [35, 36], although IS clearances exceeded PCS clearances by about 3-fold, consistent with the hypothesis of different transporters. More importantly, differences in the measured renal excretion of the two molecules were insufficient to account for the concentration differences. These studies underlie the widely held belief that variations in the gut production of these solutes constitutes a major factor in determining plasma concentrations in patients with impaired renal excretion of these solutes. This conclusion would seem to lend support to efforts to identify therapies that could alter the gut microbiome [37].
Studies that examined the effects of probiotics or pre-biotics on the production of IS and PCS suggest different pathways for their production. The oral administration of a pre-biotic (oligofructose-enriched inulin) in 22 patients undergoing maintenance hemodialysis resulted in a significant (20%) reduction in plasma concentrations of PCS and estimated PCS generation. In contrast, IS plasma concentrations and generation rates were unchanged [38]. Recently, a randomized controlled study of the effect of synbiotic (pre- and probiotic) therapy on the IS and PCS concentration in CKD patients also showed significant reductions in PCS but not IS [39].
To our knowledge, there have been no prior studies to assess the reduction of these uremic toxins by antibiotic suppression of the gut microbiome. This pilot study was limited by a small number of subjects with the possibility that these 10 subjects, receiving hemodialysis for three or more years, may not represent the responses of a larger, more diverse hemodialysis population. Further, while we have taken the decline in plasma IS and PCS concentrations as evidence of decreased production, we have not excluded the unlikely possibility that the decline in plasma concentration resulted from an increase in renal tubular secretion of these solutes. Of note, plasma concentrations of both IS and PCS declined following vancomycin administration in the two anuric subjects (D and A). A further limitation in this pilot study was the use of only a single dose of a single antibiotic (vancomycin). The findings are, in our judgment, sufficiently compelling to warrant the design of further studies with other antibiotics and repeated administration. We recognize that this was not a randomized study in that there was no control group to which no drug or a placebo was administered. Each subject served as his/her own control. We feel that the decrease of both IS and PCS among the 10 subjects makes it unlikely that our findings represent random changes in uremic solute concentrations in plasma.
The magnitude of the uremic solute reduction in this pilot study suggests that treatment with antibiotics or other agents that effect the gut microbiome, if a persistent effect, might reduce their burden when renal disease limits excretion. We recognize that treatment to reduce the production of uremic solutes would represent an off-label use of vancomycin. We selected this antibiotic because it is widely used to treat Gram-positive infections in patients undergoing maintenance hemodialysis and, given orally, it is poorly absorbed and exerts its effects largely in the gut. Finally, we recognize that further studies will be needed to determine whether the effects of vancomycin on uremic solutes and the gut microbiome will persist, increase or decrease, with repeated administration of vancomycin. In light of the great cardiovascular risk that elevated plasma concentration of ‘uremic retention solutes’ appears to exert in patients with CKD, even before the need for dialysis and the limited efficacy of modification of dialytic methods [40] to significantly reduce the cardiovascular risk in patients with ESRD, it is appropriate to examine alternate methods for reducing the plasma concentration of these uremic ‘toxins’ [12]. The evidence presented in this pilot study points to the gut production of uremic toxins as the most likely site at which intervention might have an impact on plasma uremic solute concentrations. As the population of uremic patients that might be considered for long-term antibiotic is very large, consideration should be given to the possible adverse effects of long-term use of any antibiotic agent, including the development of antibiotic resistance.
We recognize that there is precedent for the long-term administration of antibiotics in the prophylaxis against beta-hemolytic streptococcal infections to prevent recurrent rheumatic fever, prophylactic antibiotic administration to patients with cystic fibrosis, and use of oral administration of poorly absorbed antibiotics in patients with hepatic encephalopathy. Further understanding of the gut production of protein-bound, poorly dialyzed uremic retention solutes may lead to new therapies to reduce the most devastating complications of uremia, including ‘uremic cardiomyopathy’ or ‘accelerated atherosclerosis’ [6–8].
SUPPLEMENTARY DATA
Supplementary data are available online at http://ndt.oxfordjournals.org.
AUTHORS’ CONTRIBUTIONS
L.N. was responsible for processing fecal samples, interpreting the changes in microbiome findings, analysis and interpretation of data, drafting the article and revising it. J.R. designed the study, recruited subjects and carried out sample collection. P.S. collected samples and helped recruit subjects. S.J. collected samples, helped recruit subjects and created some of the graphics. A.M., a responsible nephrologist at River Renal Dialysis, approved the protocol and helped organize subject recruitment and sample collection. Z.G. carried out the analysis of fecal microbiome. L.L. measured uremic solutes (IS and PCS). R.H., epidemiologist, carried out analysis of results and interpretation of data. M.J.B., director of microbiome program, interpreted changes in microbiome and helped write the final manuscript, and provided intellectual content of critical importance to the work described. J.L. formulated the study, analyzed the results and assumed a major role in writing the MS. M.J.B. and J.L. also gave final approval of the version to be published.
CONFLICT OF INTEREST STATEMENT
None declared. The results presented in this paper have not been published previously in whole or part, except in abstract form.
REFERENCES
The R Project for Statistical Computing. https://www.r-project.org
lmerTest: Tests in Linear Mixed Effects Models. https://cran.r-project.org/web/packages/lmerTest/index.html


Comments