


Abstract
Podocyte depletion causes glomerulosclerosis, with persistent podocyte loss being a major factor driving disease progression. Urinary podocyte mRNA is potentially useful for monitoring disease progression in both animal models and in humans. To determine whether the same principles apply to crescentic glomerular injury, a rat model of anti-glomerular basement membrane (anti-GBM) nephritis was studied in parallel with a patient with anti-GBM nephritis.
Podocyte loss was measured by Wilms’ Tumor 1-positive podocyte nuclear counting and density, glomerular epithelial protein 1 or synaptopodin-positive podocyte tuft area and urinary podocyte mRNA excretion rate. Glomerulosclerosis was evaluated by Azan staining and urinary transforming growth factor (TGF)-β1 mRNA excretion rate.
In the rat model, sequential kidney biopsies revealed that after a threshold of 30% podocyte loss, the degree of glomerulosclerosis was linearly associated with the degree of podocyte depletion, compatible with podocyte depletion driving the sclerotic process. Urinary podocyte mRNA correlated with the rate of glomerular podocyte loss. In treatment studies, steroids prevented glomerulosclerosis in the anti-GBM model in contrast to angiotensin II inhibition, which lacked a protective effect, and urinary podocyte and TGF-β1 mRNA markers more accurately reflected both the amount of podocyte depletion and the degree of glomerulosclerosis compared with proteinuria under both scenarios. In a patient successfully treated for anti-GBM nephritis, urinary podocyte and TGB-β1 mRNA reflected treatment efficacy.
These results emphasize the role of podocyte depletion in anti-GBM nephritis and suggest that urinary podocyte and TGF-β1 mRNA could serve as markers of disease progression and treatment efficacy.
INTRODUCTION
Rapidly progressive glomerulonephritis (RPGN) is an important cause of end-stage kidney disease requiring renal replacement therapy [1, 2]. The major pathological component of RPGN is necrotizing crescentic glomerulonephritis. Although the prognosis for RPGN has improved over the past decade, it is still notably poor. Innovations that improve early detection and the monitoring of responses to treatments are needed [3].
Anti-glomerular basement membrane (anti-GBM) nephritis comprises 4–5% of RPGN in Japan [3], and the incidence of anti-GBM nephritis was reported as 0.5–1.8 per million people worldwide [4]. The GBM is a laminal structure comprising α3, α4 and α5 type IV collagen heterotrimers together with other components [5]. Anti-GBM nephritis in native kidneys is defined by the presence of auto-antibodies recognizing the noncollagenous-1 domain of the α3 chain of type IV collagen [5–7]. These autoantibodies bind rapidly and tightly to the GBM, where they are thought to drive the typical fulminant course of the disease [8–10], although autoreactive T-cells and genetic susceptibilities may also play a role [11, 12]. Environmental factors such as infection, smoking and exposure to organic solvents may trigger the autoimmune disease process in susceptible individuals [4, 13]. Conventional treatments for anti-GBM nephritis use a combination of high-dose methylprednisolone, cyclophosphamide and plasma exchange [14–19]. A key to minimizing injury and preserving kidney function is related to the degree of injury sustained by the time the condition is diagnosed and treatment is initiated. Better outcomes are associated with less than 30–50% of glomeruli being crescentic and serum creatinine being below 6 mg/dL [18–20]. Earlier diagnosis and implementation of effective treatments are thought to outcomes. A recent study reported that the close correlation between blood anti-GBM antibody levels and disease activity may be a potentially useful marker [21]. Serum creatinine, histological findings (percentage of crescent formation), urinary protein excretion rate and anti-GBM antibody levels are the major tools available to clinicians to diagnose and monitor disease activity and relapse.
Podocyte depletion causes glomerulosclerosis, and persistent podocyte loss drives progression to end-stage kidney disease in most forms of glomerular disease [22–37]. Podocytes are resident on the urinary space side of the GBM, so that as they detach or die, their products can be identified in urine. This raises the possibility that podocyte products in urine could potentially serve as useful biomarkers for monitoring glomerular disease activity and progression. The urinary pellet podocyte mRNA excretion rate has been used to monitor disease activity in both animal and human glomerular diseases [32–42]. Accumulating data suggest that podometric measurements are likely to prove useful for clinical decision-making, although to date no reports are available for RPGN. In the current study, we evaluated anti-GBM nephritis in both a rat model of the disease and in a human to determine whether disease progression is associated with podocyte depletion in this example of RPGN and whether it can be monitored noninvasively through urinary pellet mRNA markers.
MATERIALS AND METHODS
Ethical considerations
The animal study was approved by the Animal Research Committee of the University of Miyazaki. The studies were conducted according to the principles contained within the Declaration of Helsinki and were approved by the Institutional Review Board of the University of Miyazaki Hospital (no. 1073). Informed consent was obtained for the study of the human patient with anti-GBM nephritis. Control of urinary podocyte and transforming growth factor (TGF)-β1 mRNA excretion (median ± interquartile range) used previously published data from 28 healthy volunteers without hypertension, diabetes or kidney disease [40].
Rat model of anti-GBM nephritis
Rabbit anti-rat GBM serum [nephrotoxic serum (NTS)] was prepared as described previously [43, 44]. The rat model of anti-GBM nephritis was induced in male Wistar–Kyoto rats that were 5 weeks old and weighed approximately 100 g (Charles River Breeding, Yokohama, Japan) with an intravenous injection of NTS (0.3 mL/100 g body weight). Open kidney biopsies (wedge biopsy) were performed with removal of about 1/10th of the kidney at 1 and 2 weeks, and kidneys were harvested at week 4 when the rats were killed. A rat kidney contains about 50 000 glomeruli. We therefore obtained >30 glomeruli for each section of the biopsy, which is adequate for data analysis. Urine collection was performed every other day for 1 week, followed by urine collection on the first and fourth days of each week for a total 4 weeks. Urinary protein:creatinine ratio and podocyte [podocin and glomerular epithelial protein 1 (GLEPP1)] and TGF-β1 mRNA excretion were measured.
Steroid and angiotensin receptor blocker treatment models
Male Wistar–Kyoto rats (100 g) that received intravenous injection of NTS were assigned to three groups: (i) the steroid treatment group, which received methylprednisolone (Toronto Research Chemicals, Inc., North York, ON, Canada) at 30 mg/kg/day (days 7–14) by daily intraperitoneal injection, followed by oral prednisolone (Wako Pure Chemical Industries, Osaka, Japan) at 1.5 mg/kg/day (days 14–28) in drinking water; (ii) the angiotensin II receptor blocker (ARB) treatment group, which received losartan (provided by Merck, Rahway, NJ, USA) at 50 mg/kg/day (days 7–28) in drinking water; and (iii) the nondrug treatment group, which did not receive any drug. The control group was male Wistar–Kyoto rats (100 g), which received intravenous injection of saline. Rats were killed at 4 weeks, when the nondrug treatment group reached advanced kidney disease after NTS injection. Urine collection was performed as in the above protocol. Urinary protein:creatinine ratio and podocyte (podocin and GLEPP1) and TGF-β1 mRNA excretion were measured.
RNA from rat and human urine sediments
Rats were housed in metabolic cages for urine collection, which was performed as in the above protocol. Metabolic cages were set up to collect urine overnight (average 17 h). For human studies, a spot early morning urine sample was collected. All urine samples were centrifuged at 4 °C for 15 min at 3200 g on a tabletop centrifuge. The supernatant was removed, the pellet suspended in 1.5 mL diethyl pyrocarbonate-treated phosphate-buffered saline, and then centrifuged at 12 000 g for 5 min at 4 °C. The washed pellet was resuspended in RLT/β-mercaptoethanol buffer (RNeasy kit; Qiagen, Germantown, MD, USA) and then frozen at −80 °C until RNA extraction [33].
RNA from rat cortex
Rat cortex was dissected into small pieces after being perfused using cold phosphate-buffered saline. Samples were suspended in RLT/β-mercaptoethanol buffer (RNeasy kit; Qiagen) and frozen at −80 °C until RNA extraction [33].
RNA preparation and qRT-PCR assay
The total urinary pellet and cortex RNA were purified using an RNeasy mini kit (cat. no. 74106; Qiagen). cDNA was transcribed from sample total RNA using a high-capacity cDNA reverse transcription kit (Applied Biosystems, Foster City, CA, USA). Quantitation of podocin, GLEPP1, aquaporin 2, TGF-β1 and glyceraldehyde-3-phosphate dehydrogenase (GAPDH) mRNA abundance was performed with a 7300 HT fast real-time PCR system (Applied Biosystems) using TaqMan fast universal PCR master mix in a final volume of 10 μL per reaction. The TaqMan probes (Applied Biosystems) used were: rat Nephrotoc syndrome type 2 (NPHS2) (podocin) (cat. no. Rn00709834_m1); rat Protein-tyrosine phosphatase, receptor-type, O (PTPRO) (GLEPP1) (cat. no. Rn00569175_m1); rat aquaporin 2 (cat. no. Rn00563755_m1); rat TGF-β1 (cat. no. Rn00572010_m1); rat GAPDH (cat. no. Rn01775763_g1); human NPHS2 (podocin) (cat. no. Hs00922492_m1); human PTPRO (GLEPP1) (cat. no. Hs00243097_m1); human aquaporin 2 (cat. no. Hs00166640_m1); and human TGF-β1 (cat. no. Hs99999918_m1). All data were from 2-μg samples of cDNA measured in duplicate. cDNA standards were used for each assay, as previously described [33, 40].
Glomerulosclerosis index
The glomerulosclerosis index was estimated by a blinded observer using Azan-stained histologic sections. Mean glomerulosclerosis score (percentage of glomerulosclerosis) was estimated from 30 to 50 consecutive glomerular cross-sections by estimating the proportion of each glomerulus that had sclerosis. The definition of sclerosis used was the obliteration of the capillary lumen by increased extracellular matrix, with or without hyalinosis or foam cells.
Immunofluorescence microscopy
Frozen sections of kidney tissue were stained using standard procedures with fluorescein isothiocyanate (FITC)-conjugated goat anti-rabbit IgG antibody (cat. no. F0382; Sigma-Aldrich, St Louis, MO, USA) at a 1:100 dilution for the anti-GBM rat model, and FITC-conjugated polyclonal rabbit anti-human IgG antibody (cat. no. F0202; Dako, Glostrup, Denmark) at a 1:20 dilution for the human study.
Podometric analysis in rat kidney
Rat kidney was perfused with paraformaldehyde/lysine/periodate and embedded in paraffin prior to sectioning. Podocyte nuclear number and size were measured using Wilms’ Tumor 1 (WT1) immunofluorescence staining using 1.5-μm-thick sections, as previously described [33, 45]. Glomerular and podocyte volume per glomerular tuft area were measured by GLEPP1 immunoperoxidase staining, as previously described [33, 45]. Podocyte density was estimated by morphometric analysis using WinROOF imaging software (Mitani Corp., Tokyo, Japan) and Image-Pro (Media Cybernetics, Rockville, MD, USA), as previously described [45]. For all rat studies, 30–50 consecutive glomerular cross-sections were evaluated. The presence of glomerulosclerosis was estimated using 1.5-μm Azan-stained sections. WT1 primary antibody (SC-7385 monoclonal IgG1; Santa Cruz Biotechnology, Santa Cruz, CA, USA) at a 1:20 dilution and Cy3-labeled secondary antibody (Jackson ImmunoResearch Laboratories, West Grove, PA, USA) at a 1:100 dilution were used for rat podocyte nuclear identification. Slides were mounted using SlowFade Gold antifade reagent with 4′, 6-Diamidino-2-Phenylindole, Dihydrochloride (DAPI) (S36939; Invitrogen, Eugene, OR, USA). GLEPP1 mouse monoclonal antibody at a 1:100 dilution was used to identify podocyte cell area (kindly gifted by the Roger Wiggins Laboratory). Sections were stained for immunoperoxidase using a Vectastain Elite ABC kit (PK-6100; Vector Laboratories Inc., Burlingame, CA, USA).
Podometric analysis in human kidney biopsies
Human kidney biopsies were formalin-fixed and embedded in paraffin prior to sectioning. A 21-year-old man with possible hematuria, but without proteinuria or kidney dysfunction, was used for the control kidney. Podocyte nuclear number and size were measured using transducin-like enhancer of split 4 (TLE4) immunoperoxidase staining using 1.5-μm-thick sections, as previously described [40, 45]. Glomerular and podocyte volume per tuft area were measured using synaptopodin immunoperoxidase staining, as previously described [40, 45]. Podocyte density was estimated using morphometric analysis using WinROOF imaging software (Mitani Corp.) and Image-Pro (Media Cybernetics), as previously described [40, 45]. TLE4 primary antibody (SC-365406 monoclonal IgG1; Santa Cruz Biotechnology) at a 1:150 dilution was used for human podocyte nuclear identification. Synaptopodin mouse monoclonal antibody was used to identify podocyte cell area (cat. no. 65194; Progen Biotechnik, Heidelberg, Germany).
Serum creatinine
Serum creatinine was evaluated using a creatinine assay kit (L-type Wako CRE M; Wako).
Statistical analysis
Statistical analysis was performed using GraphPad PRISM software, version 6.0 (GraphPad Software, Inc., La Jolla, CA, USA). Serum creatinine measurements are mean ± standard deviation. Urinary measurements and histological examinations are mean ± standard error of the mean. Differences among the two groups were tested using the Mann–Whitney U-test, and more than two groups were tested using one-way analysis of variance (ANOVA) or the Kruskal–Wallis test for normal distributions or nonnormal distributions, as appropriate. When the result of one-way ANOVA or the Kruskal–Wallis test was significant, a Tukey test or a Dunn test was performed for post hoc analysis. Correlations between parameters were compared using single regression analysis (Spearman’s rank correlation or Pearson’s correlation) for normal distribution or nonnormal distribution, as appropriate. A P < 0.05 was considered statistically significant.
RESULTS
Persistent podocyte loss was associated with progression in this rat model of anti-GBM nephritis
A progressive model of anti-GBM nephritis using male Wistar–Kyoto rats was initiated by intravenous injection of rabbit anti-rat GBM serum (NTS) as previously described [43, 44]. Figure 1A shows immunofluorescent anti-rabbit IgG staining, with no immunostaining seen in the glomerulus at day 0 (before NTS injection). A strong linear pattern of immunostaining was observed at 30 min, and days 7, 14 and 28 after NTS injection. The time course of events in the model including the appearance of crescentic nephritis is shown in Figure 1B–G. Progression to more than 90% of glomeruli being sclerotic occurred by 28 days after NTS injection. These changes were associated with progressive reductions in podocyte number and density (Figure 1C–F). Podocyte parameters measured included WT1-positive podocyte nuclear number per glomerular tuft, podocyte nuclear numerical density (nuclear number per tuft volume), podocyte area density (percentage of tuft area positively stained for the podocyte cytoplasmic marker GLEPP1) and average glomerular volume. By day 7, the number of podocytes per glomerular tuft had not decreased significantly (Figure 1C), although glomerular inflammation was present (Figure 1A) and was associated with an increase in glomerular volume by about 40%, so that podocyte density measured using two independent methods (WT1-positive podocyte nuclear number per glomerular tuft volume and GLEPP1-positive percentage of glomerular tuft area) both decreased about 40%. From days 7 to 28, podocyte number per glomerular tuft as well as podocyte density progressively decreased in parallel with an increase in degree of glomerulosclerosis and proportion of sclerotic glomeruli (Figure 1B–G).
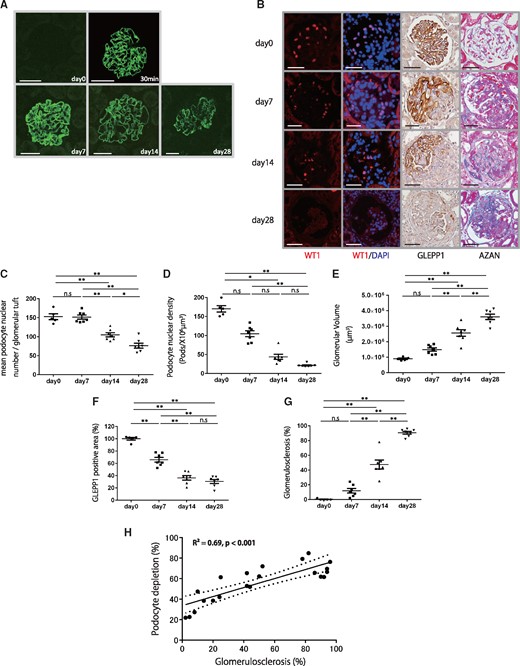
Histological and podometric analysis of disease progression in a rat model of anti-GBM nephritis. (A) Representative immunofluorescent anti-rabbit IgG staining at day 0, 30 min, days 7, 14 and 28 after NTS injection. No immunostaining was seen in the glomerulus at day 0. A strong linear immunostaining pattern was observed at 30 min, days 7, 14 and 28 after NTS injection (bar = 50 μm). (B) Representative histology for sequential kidney biopsies. From upper to lower, micrographs are from days 0, 7, 14 and 28 after NTS injection. Far-left and second-left panels show podocyte nuclei identified using WT1 and WT1/DAPI immunofluorescence staining. Second-right panel shows podocytes identified using GLEPP1/peroxidase. Far-right panel shows Azan staining (bar = 50 μm). (C) Quantification of histology using WT1-positive mean podocyte nuclear number per glomerular tuft. (D) Quantification of podocyte density. (E) Quantification of glomerular volume. (F) Percentage of glomerular tuft area that was positive for GLEPP1. (G) Percentage of glomerulosclerosis using Azan staining. (H) Relationship between percentage of GLEPP1-positive area per tuft and percentage of glomerulosclerosis using AZAN staining (n = 21, R2 = 0.69, P < 0.001). Dotted lines represent 95% confidence intervals. More than 30% podocyte depletion was a strong linear relationship between further podocyte depletion and the development of glomerulosclerosis. n = 7; ns = non-significant, *P < 0.05 and **P < 0.01, assessed using one-way ANOVA followed by the Tukey test. Part (D) was assessed using the Kruskal–Wallis test followed by the Dunn test.
Figure 1H shows the relationship between percentage of podocyte depletion (measured by the GLEPP1 peroxidase percent area) and degree of glomerulosclerosis (measured by Azan staining). After >30% podocyte depletion, there was a strong linear relationship between further podocyte depletion and the development of glomerulosclerosis (R2 = 0.69, P < 0.001). By day 28, serum creatinine increased to 0.61 ± 0.17 mg/dL versus 0.27 ± 0.04 mg/dL in normal controls (P < 0.01; Mann–Whitney test).
Persistent podocyte loss in this rat model of anti-GBM nephritis can be noninvasively monitored using urinary pellet podocytes and TGF-β1 mRNA
Figure 2A shows detached GLEPP1-positive cells (podocytes) from the glomerulus appearing within the Bowman’s space during acute injury. Quantitation of the podocyte detachment rate could be measured noninvasively using the urinary pellet of podocyte mRNA (Figure 2C and D, and Supplementary Figure S1A and B). Following NTS injection, both urinary protein:creatinine ratio (Figure 2B) and podocyte detachment rate [measured using the urinary pellet podocin:aquaporin 2 mRNA ratio (Figure 2C), podocin mRNA:creatinine ratio (Supplementary Figure S1A), GLEPP1:aquaporin 2 mRNA ratio (Figure 2D) and GLEPP1 mRNA:creatinine ratio (Supplementary Figure S1B)] increased by day 7 to reach a peak of 100- to 1000-fold above baseline. This high level of podocyte detachment persisted over the 28-day period of observation, during which podocytes became severely depleted in glomeruli (Figure 1B–G).
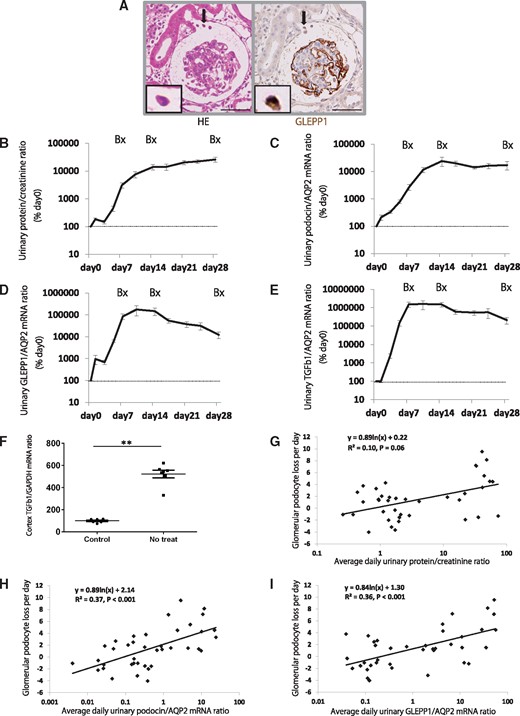
Urinary podocytes and TGF-β1 mRNA for disease progression in a rat model of anti-GBM nephritis. (A) Podocyte detachment from the glomerulus (arrowhead) in the rat model of anti-GBM nephritis. Left panel shows hematoxylin eosin (HE) staining and right panel shows GLEPP1/peroxidase immunostaining (bar = 50 μm). (B) Time course of urine protein:creatinine ratio. (C) Time course of urinary podocin:aquaporin 2 (AQP2) mRNA ratio. (D) Time course of urinary GLEPP1:AQP2 mRNA ratio. (E) Time course of urinary TGF-β1:AQP2 mRNA ratio. (F) Glomerular cortex TGF-β1 mRNA:GAPDH ratio at day 28 after NTS injection. (G) Relationship between glomerular podocyte loss per day (calculated by WT1-positive podocyte nuclear number per glomerular tuft at each time point; days 0, 7, 14 and 28) and average daily urinary protein:creatinine ratio at each time period (days 0–7, days 8–14 and days 15–28). (H) Relationship between glomerular podocyte loss per day and average daily urinary podocin:AQP2 mRNA ratio at each time period. (I) Relationship between glomerular podocyte loss per day and average daily urinary GLEPP1:AQP2 mRNA ratio at each time period. Proteinuria did not quite reach statistical significance (R2 = 0.10, P = 0.06) compared with urinary podocyte mRNA (podocin and GLEPP1) (R2 = 0.37 and R2 = 0.36, P < 0.001 and P < 0.001, respectively). **P < 0.01, assessed using the Mann–Whitney U-test.
The time course of fibrotic events taking place in glomeruli is shown in Figure 1B (stained blue by Azan) and quantitated as percent glomerulosclerosis (Figure 1G). The urinary pellet TGF-β1:aquaporin 2 mRNA ratio and TGF-β1 mRNA:creatinine ratio increases were delayed behind that of proteinuria and podocyte markers at day 2 after NTS injection but rapidly increased by day 7 and remained at 1000- to 10 000-fold above baseline through until day 28 (Figure 2E and Supplementary Figure S1C) as glomerular scarring rapidly progressed.
These data are consistent with the concept that in this model system, anti-GBM antibody-induced glomerular injury triggered persistently high levels of podocyte detachment (detectable noninvasively in the urinary pellet) that caused depletion of podocytes from glomeruli, which in turn resulted in progressive active fibrosis. This active fibrosis is reflected by high levels of TGF-β1 mRNA in the cortex (Figure 2F) and is detectable noninvasively in the urinary pellet and manifests as glomerulosclerosis and loss of renal function.
To test whether urinary podocyte mRNA markers predict the rate of podocyte loss from glomeruli at a point in time, we evaluated the relationship between glomerular podocyte loss per day (calculated using WT1-positive podocyte nuclear number per glomerular tuft at each time point: days 0, 7, 14 and 28) and the average daily urinary marker at each time period (days 0–7, days 8–14 and days 15–28). Proteinuria did not quite reach statistical significance (R2 = 0.10, P = 0.06). In contrast, urinary podocyte mRNA (podocin and GLEPP1) (R2 = 0.37, R2 = 0.36 and R2 = 0.22, R2 = 0.30; P < 0.001, P < 0.001 and P = 0.002, P < 0.001, respectively) (Figure 2G–I, and Supplementary Figure S1D and E) closely correlated highly with the rate of podocyte loss from glomerular tufts. These results suggest that urinary podocyte mRNA could predict the rate of podocyte loss from glomeruli at a point in time during disease progression more precisely than proteinuria.
Amelioration of glomerulosclerosis with treatment paralleled changes in glomerular podocyte parameters, and can be noninvasively monitored using urinary pellet podocyte and TGF-β1 mRNA
Steroids, immunosuppressive agents and plasma exchange remain key components of conventional treatments for anti-GBM nephritis [14–19]. Angiotensin II blockade using angiotensin-converting enzyme inhibition or angiotensin II receptor blockers (ARBs) is standard treatment for many forms of glomerular disease progression. We elected to compare the effects of treatment with steroids or ARB in the rat model simulating the regimens used in humans and beginning 7 days after NTS injection, when crescents are already detectable in glomeruli, as shown in Figure 1B.
We first tested whether urinary markers can predict treatment outcomes (steroids or ARB). As shown in Figures 3 and 4, steroid treatment resulted in almost complete prevention of the development of glomerulosclerosis, which paralleled the rate of reduction of podocyte detachment, measured using urine podocin, GLEPP1 and TGF-β1 mRNA. Proteinuria did not significantly reduce with steroid treatment. ARB treatment did not reduce any marker tested, including urinary protein:creatinine ratio, urinary podocyte (podocin or GLEPP1) or urinary TGF-β1 mRNA excretion rates (Figure 3 and Supplementary Figure S2A–C). As accurately predicted by all the urine markers tested, ARB treatment alone showed a lack in preventing progression in the model system (Figure 4).
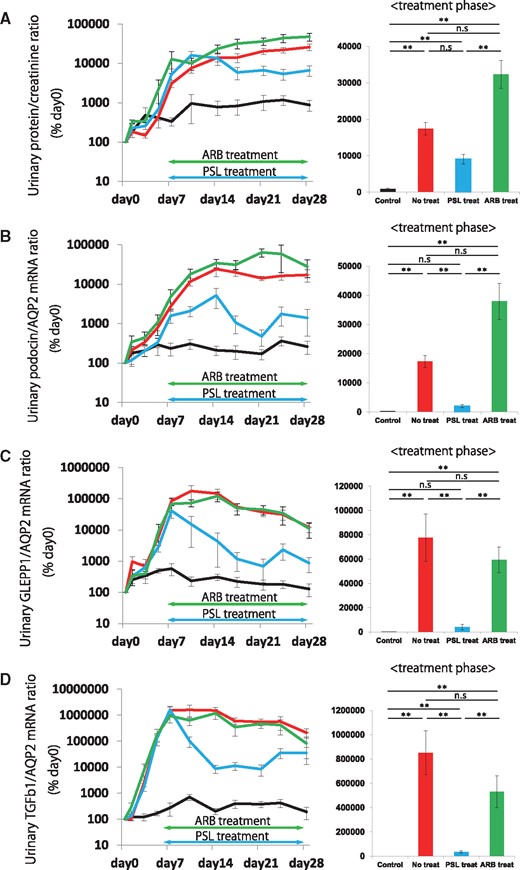
Effect on urinary podocyte and TGF-β1 mRNA following steroid or ARB treatment in a rat model of anti-GBM nephritis. (A) Time course of urinary protein:creatinine ratio and comparison in treatment phase (days 7–28). (B) Time course of urinary podocin:aquaporin 2 (AQP2) mRNA ratio and comparison in treatment phase (days 7–28). (C) Time course of urinary GLEPP1:AQP2 mRNA ratio and comparison in treatment phase (days 7 − 28). (D) Time course of urinary TGF-β1:AQP2 mRNA ratio and comparison in treatment phase (days 7–28). Steroid treatment rapidly and significantly reduced urinary podocyte mRNA in the urinary pellet for both podocyte markers tested (podocin and GLEPP1). A similar result was seen for urinary pellet TGF-β1 mRNA, where steroid treatment reduced urinary pellet TGF-β1 mRNA. In contrast, proteinuria was not significantly reduced by steroid treatment. ARB treatment did not reduce any marker tested including urinary protein:creatinine ratio, or urinary podocyte (podocin or GLEPP1) or urinary TGF-β1 mRNA excretion rates. n = 6 for the control group, n = 7 for the no treatment group, n = 6 for the steroid treatment group and n = 5 for the ARB treatment group. ns = non-significant, *P < 0.05 and **P < 0.01, assessed using the Kruskal–Wallis test followed by the Dunn test. PSL, predonisolone.
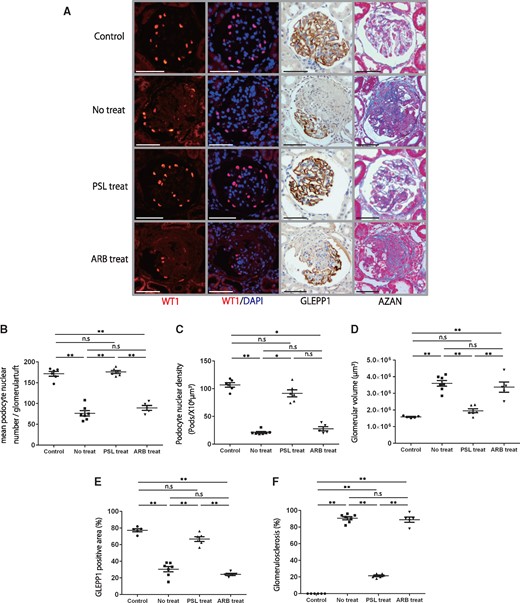
Histological and podometric analysis of the effects of steroids or ARB treatment in a rat model of anti-GBM nephritis. (A) Representative histology in a rat model of anti-GBM nephritis for the control, no treatment, steroid treatment and ARB treatment groups. From upper to lower, micrographs are from control, no treatment, steroid treatment and ARB treatment groups after NTS injection. Far-left and second-left panels show podocyte nuclei identified using WT1 and WT1/DAPI immunofluorescence staining. Second-right panel shows podocytes identified using GLEPP1/peroxidase. Far-right panel shows Azan staining (bar = 50 μm). (B) Quantification of histology using WT1-positive podocyte nuclear number per glomerular tuft. (C) Quantification of podocyte density. (D) Quantification of glomerular volume. (E) Percentage of glomerular tuft area that was positive for GLEPP1. (F) Percentage of glomerulosclerosis using Azan staining. While the no treatment and ARB treatment groups showed significant depletion of about 60% of podocytes and glomerulosclerosis in about 80% of glomeruli by 28 days after NTS injection, the steroid treatment group had a reduction in podocyte density of 15% compared with the control and was associated with only 20% of glomeruli showing glomerulosclerosis. n = 6 for the control group, n = 7 for the no treatment group, n = 6 for the steroid treatment group and n = 5 for the ARB treatment group. ns = non-significant, *P < 0.05 and **P < 0.01, assessed using one-way ANOVA followed by the Tukey test. Part (C) was assessed using the Kruskal–Wallis test followed by the Dunn test. PSL, predonisolone.
Urinary pellet podocyte and TGF-β1 mRNA excretion used to monitor disease activity in human anti-GBM nephritis
A 28-year-old man was admitted to our hospital with fever, proteinuria, hematuria and an elevated serum creatinine level. Anti-neutrophil cytoplasmic antibodies for myeloperoxidase and proteinase 3 were negative in serum; however, anti-GBM antibody was positive (>350 U/mL). A kidney biopsy showed crescentic glomerulonephritis and linear immunofluorescence staining for IgG. He was diagnosed with anti-GBM nephritis and was treated with intravenous methylprednisolone pulse therapy followed by oral prednisolone, oral cyclophosphamide and plasma exchange. After 5 weeks of treatment, his kidney function improved (serum creatinine decreased from 2.4 mg/dL to 1.7 mg/dL; estimated glomerular filtration rate, 29 mL/min/1.73 m2 to 42 mL/min/1.73 m2) and anti-GBM antibody also decreased (>350 U/mL to 6.9 U/mL) (Figure 5A and B). We performed a second kidney biopsy to determine the effect of treatment after 5 weeks. Histological findings of podocyte depletion showed improvement after treatment, as evaluated by TLE4-positive podocyte nuclear number per glomerular tuft and density and synaptopodin peroxidase staining (Figure 5C–G). Proteinuria, urinary podocyte (podocin and GLEPP1) mRNA and TGF-β1 mRNA excretion also decreased with treatment (Figure 5H–K). These results were comparable to results of the rat study, which showed that urinary podocyte and TGF-β1 mRNA excretion reflected the reduction in injury severity and stabilization of the clinical condition of the patient.
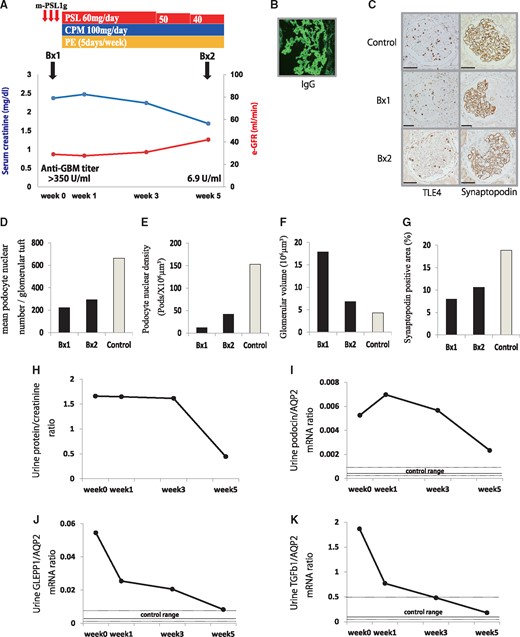
Patient with anti-GBM nephritis. (A) Clinical course of the anti-GBM patient. (B) Representative immunofluorescent IgG staining. (C) Representative histology of the kidney biopsies before and after treatment. From upper to lower, micrographs are from control (21-year-old man with possible hematuria but no proteinuria or kidney dysfunction), before treatment (Bx1) and 5 weeks after treatment (Bx2) in a patient with anti-GBM nephritis. Left panels show podocyte nuclei identified using TLE4 immunoperoxidase staining. Right panels show podocytes identified using synaptopodin immunoperoxidase staining (bar = 50 μm). (D) Quantification of histology using TLE4-positive podocyte nuclear number per glomerular tuft. (E) Quantification of podocyte density. (F) Quantification of glomerular volume. (G) Percentage of glomerular tuft area that was positive for synaptopodin. (H) Time course of urinary protein:creatinine ratio. (I) Time course of urinary podocin:aquaporin 2 (AQP2) mRNA ratio. (J) Time course of urinary GLEPP1:AQP2 mRNA ratio. (K) Time course of urinary TGF-β1:AQP2 mRNA ratio. Control of urine podocyte and TGF-β1 mRNA excretion (median ± interquartile range) used our previously published data from 28 healthy volunteers without hypertension, diabetes or kidney disease. PSL, predonisolone; CPM, cyclophosphamide; PE, plasma exchange.
DISCUSSION
The ‘podocyte depletion hypothesis’ posits that regardless of the underlying cause of glomerular injury, a critical degree of podocyte depletion causes glomerulosclerosis, and that persistent podocyte loss will ultimately cause end-stage kidney disease [23]. Data consistent with this concept have been reported for various animal models and human glomerular diseases [22–37]. Using a model of specific podocyte depletion in rats transgenic for the human diphtheria toxin receptor, we identified a quantitative relationship between the degree of podocyte depletion and amount of glomerulosclerosis [33]. Similar results have been reported using other model systems [30, 31].
The pathogenesis of anti-GBM nephritis is thought to be initiated by the binding of anti-GBM antibody to the GBM, thereby triggering an inflammatory process that drives glomerular injury and crescent formation leading to glomerulosclerosis. In prior studies, we used models of specific podocyte depletion compatible with the conclusion that podocyte depletion per se causes glomerulosclerosis in proportion to the degree of podocyte depletion [33]. The current study used an immune mechanism of glomerular injury (anti-GBM disease) to cause glomerulosclerosis resembling that seen in humans. The question addressed is whether podocyte depletion also occurs in this form of glomerular injury, and if it does, then could it potentially account for the amount of glomerulosclerosis that occurs. Furthermore, whether podocyte detachment and depletion could be a potentially useful way to monitor the disease process. The close relationship between podocyte depletion and glomerulosclerosis in anti-GBM disease was strikingly apparent in four ways: (i) the time course of podocyte depletion and the time course of glomerulosclerosis were quantitatively comparable; (ii) the threshold of podocyte depletion above which glomerulosclerosis became apparent (about 30%) was the same for anti-GBM disease as it was for podocyte depletion induced by diphtheria toxin-induced specific podocyte depletion [33]; (iii) above this 30% threshold, the degree of glomerulosclerosis was directly proportional to the degree of podocyte depletion; and (iv) the degree of protection provided by steroid treatment and lack of protection provided by ARB treatment for glomerulosclerosis paralleled the degree of podocyte depletion in each case. Taken together with prior studies that suggest that podocyte depletion causes glomerulosclerosis, these data are compatible with the conclusion that, in this model system, binding of anti-GBM antibody to the GBM resulted (either directly or indirectly through inflammatory processes) in loss of podocytes from glomeruli, which in turn resulted in glomerulosclerosis. While all glomerular cell types participate in and contribute to this inflammatory and scarring process, our data are compatible with podocyte loss being a determining factor.
Although the studies do not show a protective effect of ARB in the acute severe phase of anti-GBM nephritis, the results do not exclude the possibility that ARB might be useful in slowing or preventing further progression after initial injury.
Podocytes are resident on the urinary space side of the GBM. As they detach, their products appear in the urine, raising the possibility that podocyte products in the urine could serve as markers for monitoring glomerular disease activity. Hara et al. [46, 47] detected podocytes and podocyte fragments in urine using a podocalyxin antibody detection system in various human glomerular diseases. Cheruvanky et al. [48] and Zhou et al. [49] reported that urinary exosomal podocyte proteins were potentially useful as biomarkers for glomerular disease. We and others have reported that urinary podocyte mRNA excretion is a potentially useful biomarker in model systems and human glomerular diseases [32–42]. In the current study, we used two different podocyte markers (podocin and GLEPP1). We also used both a distal tubular marker (aquaporin 2) and urine creatinine concentration as house-keeping factors by which to correct for variations in RNA recovery and urine concentration. All of these strategies for measuring the rate of podocyte loss in the urine pellet gave approximately similar results.
We found that urinary podocyte mRNA markers correlated statistically with the rate of podocyte loss from glomeruli (Figure 2H and I, and Supplementary Figure S1D and E). Of note is the correlation (R2 = 0.36–0.37) between podocyte loss from glomeruli and podocyte products levels in urine, especially in the context of highly dynamic acute inflammatory processes such as anti-GBM disease with crescentic nephritis, which went through both an acute and a chronic phase over the 28 days of study. Not all podocytes that are lost from glomeruli will have detached and remain viable for detection with a urine assay. For example, some podocytes could be so damaged that they either undergo necrosis in situ or do not survive passage down the urinary tract to be quantifiable in urine. Other podocytes may be damaged and temporarily lose their markers, then subsequently recover to become viable podocytes. Nevertheless, urine podocyte measurement provides a close association with the rate of podocyte loss in the model system.
In terms of understanding the biology and applying it to clinical decision-making, it is important to determine what should be classed as a podocyte. All cells including podocytes are adaptable and have the capacity to change behavior depending on the circumstances. For the purpose of our analysis, a podocyte was defined as a cell that carries a certain set of markers that describe characteristic cell capacity and behavior. If a cell no longer carries those markers then, like an HIV-infected podocyte, it probably no longer behaves like a normal mature podocyte and should, therefore, not be counted as one. In this sense, expression of the markers not only serves to identify the cell but also allows for the determination of whether that cell is likely to be behaving within an accepted norm. This is in contradistinction to, for example, a lineage marker, where a cell could fundamentally change its phenotype and yet still express the lineage marker. Therefore, lineage markers and functional markers provide different but complementary information.
Cells comprising a glomerular crescent in anti-GBM nephritis include macrophages, podocytes and parietal epithelial cells (PEC) [50–57]. Smeets et al. [55] reported that the majority of crescents appeared to be contained within PEC and not podocytes in a mouse model of crescentic glomerulonephritis. Moeller's group reported that subtotal ablation of PEC led to cellular crescents [56], and cellular lesions were almost exclusively populated by PEC markers in human glomerular diseases [57]. These reports provide strong evidence that crescents predominantly appear within PEC. Furthermore, these authors have recently reported that deletion of the glucocorticoid receptor on PEC remarkably attenuates the protective effects of glucocorticoids in a mouse model of anti-GBM, demonstrating that PEC must play a key role in progression [58]. However, these data do not exclude the possibility that podocyte injury and loss also play key roles in driving glomerulosclerosis in crescentic nephritis, probably upstream of PEC activation and migration into glomeruli. Indeed, in the model system, podocytes observed to be detaching from glomeruli and podocyte products in the urinary pellet increased >100-fold above the normal range. Therefore, regardless of the cellular origin of crescents and the potential role of PEC in driving the scarring process, the degree of glomerular scarring observed was closely associated with the degree of glomerular podocyte depletion. If this is the case, then the urinary pellet podocyte mRNA excretion rate could potentially serve to identify and monitor disease activity and progression in both animal models and human anti-GBM nephritis, as was observed in the current study.
Proteinuria is a compound index of many forms of glomerular injury. This is illustrated in the current study by the finding that although steroid treatment reduced the degree of glomerulosclerosis by 90%, the urinary protein:creatinine ratio decreased by only 40% (NS) and remained high despite steroid treatment preventing further progression. This finding aligns with a previous study which reported that anti-GBM antibody caused proteinuria, independent of immune and inflammatory cells, in the isolated perfused kidney [59].
Urinary pellet podocyte and TGF-β1 mRNA markers accurately reflected the degree of protection from glomerulosclerosis and significantly correlated with the podocyte loss rate from glomeruli at any point in time. Proteinuria and urinary pellet mRNA markers provide different yet complementary information. In terms of monitoring progression, urinary pellet podocyte and TGF-β1 mRNA markers measure the biological process causing glomerulosclerosis and may, therefore, be more specific than proteinuria in determining glomerular injury progression.
TGF-β1 is a pro-fibrotic cytokine. Mice transgenic for TGF-β1 produced by the liver develop accelerated glomerulosclerosis [60]. TGF-β1 in the glomerulus is upregulated in various experimental nephritis models and human glomerular diseases including focal segmental glomerulosclerosis, IgA nephropathy, crescentic glomerulonephritis, lupus nephritis and diabetic nephropathy [61–63]. Urinary TGF-β1 excretion significantly increased in an anti-GBM model and in patients with RPGN, and correlated with the degree of crescent formation [64, 65]. TGF-β1 was found to be strongly expressed in cellular and fibro-cellular crescents in human crescentic glomerulonephritis [66]. Furthermore, TGF-β itself is thought to mediate podocyte injury [67]. Upregulated TGF-β may accelerate podocyte injury and depletion as well as drive the fibrotic events leading to glomerulosclerosis. In the current study, urinary pellet TGF-β1 mRNA significantly increased in the rat model of anti-GBM nephritis and showed decreased progression with steroid treatment. Urinary pellet TGF-β1 mRNA also increased in the human anti-GBM nephritis patient and decreased with steroid and immunosuppressive therapy. These results suggest that urinary TGF-β1 mRNA excretion could be a useful biomarker for evaluating progression and disease activity in anti-GBM nephritis.
In human anti-GBM nephritis affecting the native kidney, the antigenic target is typically the noncollagenous-1 domain of the α3 chain of type IV collagen [5–7]. In anti-GBM nephritis in allografts, the antigenic target may be different because Alport syndrome patients may carry collagen IV gene deletions that are exposed to novel epitopes in the kidney allograft [8]. In the current model, anti-GBM antibody was generated by immunizing rabbits with detergent-treated rat GBM. It is likely that this polyclonal antibody preparation could have contained antibodies for non-GBM components, including glomerular components, and other cells, although immunofluorescent studies did not suggest this as a significant concern. The findings that the parameters measured in the model were essentially the same as the human counterpart suggests that similar biological processes were taking place. Furthermore, podocytes themselves are responsible for synthesizing and assembling α3, α4 and α5 type IV collagen trimers and inserting them into the underlying GBM [68]. Therefore, the possibility cannot be excluded that anti-GBM antibodies might drive accelerated podocyte detachment through competing for podocyte adhesion to the GBM.
In this study, we included data from one human case of anti-GBM disease, but recognize that a single case report is of limited value. However, because anti-GBM disease is rare, any opportunity to study the disease must be taken. This case (unusually) improved with treatment, thereby allowing the relationship between improvements over time to be compared with the urine marker. Longitudinal repeat biopsy and urine samples were collected. The rat and human data complemented each other and mutually align. We therefore provide this information as a basis for further study to determine whether the urine markers could be useful for monitoring anti-GBM and related diseases.
Our findings support the hypothesis that in RPGN, as demonstrated with anti-GBM nephritis, glomerulosclerosis is associated with podocyte depletion from glomeruli, as it is in all other progressive glomerular diseases studied. We also found that the rate of podocyte detachment measured using urinary pellet podocyte mRNA accurately reflected the rate of podocyte loss from glomeruli, and that the scarring process can be monitored by urinary pellet TGF-β1 mRNA levels. These urinary markers provide complementary information to proteinuria that could be clinically useful for monitoring responses to treatment at a point in time during management of this group of severe glomerulonephritides.
SUPPLEMENTARY DATA
Supplementary data are available online at http://ndt.oxfordjournals.org.
ACKNOWLEDGEMENT
This study was presented in part at Kidney Week 2013, the annual meeting of the American Society of Nephrology, 7–10 November 2013, in Atlanta, GA, USA.
FUNDING
This work was supported by a grant for Clinical Research from Miyazaki University Hospital.
CONFLICT OF INTEREST STATEMENT
None declared.


Comments