


Background. The effect of maintenance intravenous (IV) iron administration on subsequent achievement of anemia management goals and mortality among patients recently initiating hemodialysis is unclear.
Methods. We performed an observational cohort study, in adult incident dialysis patients starting on hemodialysis. We defined IV administration strategies over a 12-week period following a patient's initiation of hemodialysis; all those receiving IV iron at regular intervals were considered maintenance, and all others were considered non-maintenance. We used multivariable models adjusting for demographics, clinical and treatment parameters, iron dose, measures of iron stores and pro-infectious and pro-inflammatory parameters to compare these strategies. The outcomes under study were patients' (i) achievement of hemoglobin (Hb) of 10–12 g/dL, (ii) more than 25% reduction in mean weekly erythropoietin stimulating agent (ESA) dose and (iii) mortality, ascertained over a period of 4 weeks following the iron administration period.
Results. Maintenance IV iron was administered to 4511 patients and non-maintenance iron to 8458 patients. Maintenance IV iron administration was not associated with a higher likelihood of achieving an Hb between 10 and 12 g/dL {adjusted odds ratio (OR) 1.01 [95% confidence interval (CI) 0.93–1.09]} compared with non-maintenance, but was associated with a higher odds of achieving a reduced ESA dose of 25% or more [OR 1.33 (95% CI 1.18–1.49)] and lower mortality [hazard ratio (HR) 0.73 (95% CI 0.62–0.86)].
Conclusions. Maintenance IV iron strategies were associated with reduced ESA utilization and improved early survival but not with the achievement of Hb targets.
INTRODUCTION
Efforts to treat hemodialysis patients' anemia while decreasing their use of potentially harmful [1–4] and costly [5–8] erythropoietin stimulating agents (ESA) have recently contributed to increased intravenous (IV) iron use in daily clinical practice [9]. Anemia treatment may be particularly intense during the first few months of chronic dialysis, when hemoglobin (Hb) values are often lowest. During that time, many patients receive ‘loading’ or higher than usual doses of IV iron therapy in conjunction with ESA treatment [9]. However, it is not clear whether, after this initial treatment phase, there are benefits to IV iron administration strategies that maintain regularly scheduled IV iron dosing or strategies in which IV iron is administered on an as-needed basis.
The 2012 Kidney Disease Improving Global Outcomes guidelines propose two strategies for the routine administration of IV iron in hemodialysis: ‘periodic’ (also called ‘rescue’ or ‘bolus’) iron repletion, consisting of serial IV iron administration aiming to replenish iron stores or ‘maintenance’ iron administration, consisting of smaller doses at regular intervals, aiming to stabilize iron storage [10]. Maintenance strategies, associated with fewer large IV iron doses, might limit the risks of toxic effects of IV iron [11] and might promote the stability of iron stores. Erythropoiesis could consequently be more consistently maintained, and, in turn, more efficient, requiring less administration of exogenous ESA. A small randomized controlled trial showed that maintenance iron administration reduced the amount of ESA required to maintain patients' Hb within target [12]. However, in a conflicting large observational study, bolus IV iron administration regimens were associated with higher Hb values and lower average ESA doses [13]. Notably, each of these studies included a mix of incident and prevalent patients, and they defined IV iron administration strategies differently [12, 13].
Thus, uncertainty surrounds the relationship between IV iron administration strategies following hemodialysis initiation, achievement of anemia management goals and clinical outcomes [12–15]. We studied the association of maintenance IV iron administration strategies during the first months following patients' hemodialysis initiation with the achievement of Hb targets, ESA doses and mortality in a contemporary national cohort of incident hemodialysis patients.
MATERIALS AND METHODS
Study population and data sources
Our study population comprised patients initiating in-center hemodialysis between 1 January 2003 and 31 December 2009 at 209 dialysis facilities operated by Dialysis Clinic, Inc. (DCI) [16]. DCI is a medium-sized not-for-profit provider of dialysis care in the USA. We obtained information regarding patients' dialysis treatments, demographics, comorbidity, routine laboratory tests, medications and hospitalizations from electronic medical records. We obtained additional information from the US Renal Data System through linkage to DCI data [16]. The study was approved by the Johns Hopkins University School of Medicine Institutional Review Board, Baltimore, MD, USA.
Rationale and study design
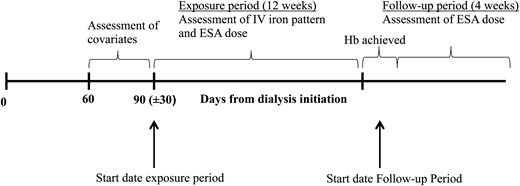
Timeline of the study, expressing the exposure and follow-up period in relation to dialysis initiation and iron parameter measurements. IV, intravenous; ESA, erythropoietin stimulating agents, TSat, transferrin saturation; Hb, hemoglobin.
Study population
We selected a candidate cohort of adult patients initiating in-center hemodialysis at DCI facilities between 1 January 2003 and 31 December 2009. For analyses of the association between IV iron administration strategy and anemia management goals, we included patients who had information available on both their IV iron administration strategy and anemia management goals (Hb target and ESA reduction) over the exposure and follow-up periods. For analyses of the association between IV iron administration strategy and early mortality, we included all patients with information on IV iron administration, but we did not require information on anemia management to be present. We excluded patients using darbepoetin during exposure or follow-up periods, since administration strategies of IV iron preparation and doses of other ESA formulation (epoetin alfa) could differ.
Exposure period
We assigned the start date for assessing IV iron administration strategy as the first day within 60–120 days after dialysis initiation, at which TSat, Hb and ferritin were measured simultaneously (Figure 1). If simultaneous assessment of these laboratory values did not occur on a single day within 60–120 days after dialysis initiation, we used the first day at which TSat and ferritin were measured simultaneously during the 60- to 120-day period. If the latter also did not occur within this period, then we selected the first date with a single TSat measurement.
Definition of maintenance IV iron administration
A priori, we defined maintenance strategies as administration of at least one dose of IV iron each week, every other week, every 3 weeks or every 4 weeks throughout the 12-week exposure period. All patients who did not meet the criteria for maintenance strategies during this 12-week period were assigned into a single ‘non-maintenance’ strategy group.
Outcomes
Our primary outcome was the achievement of clinically relevant anemia management goals following IV iron administration, which we defined as the achievement of an Hb concentration of 10–12 g/dL or >25% decrease in the prescribed mean weekly ESA dose, corrected for body weight. Because routine Hb assessments usually occurred monthly, we assessed the Hb outcome using the first Hb measured following the 12-week exposure period up to a maximum of 40 days after the end of the exposure period. We assumed that clinicians would use this achieved Hb measurement to guide their subsequent ESA prescription. Therefore, we used the mean weekly ESA dose over the 4 weeks following this achieved Hb measurement to calculate the difference in ESA use as a consequence of the iron administration strategy.
To estimate corrected weekly ESA doses, we divided the sum of all ESA doses administered during each week by each patient's post-dialysis target body weight during that week. In instances in which the target weight was changed during the week, we took the average of the two weights. To estimate mean weekly ESA requirements, we summed corrected weekly ESA doses during the exposure and follow-up periods and divided the sums by the total number of weeks during the 12 weeks of the exposure period (the 4 weeks of the follow-up period). We estimated percent change in ESA requirement as: 100 × (mean weekly exposure ESA dose − mean weekly outcome ESA dose)/mean weekly exposure ESA dose.
We assessed early all-cause mortality during the follow-up period, within 4 weeks after the first Hb measured or (if not applicable) until 4 weeks after the end of the follow-up period.
Covariates
We obtained patients' demographics (sex, race, ethnicity), age at dialysis initiation, primary cause of end-stage renal disease, body mass index (BMI) (weight in kg/height in m2) and residual estimated glomerular filtration rate (eGFR) at dialysis initiation as estimated by the Modification of Diet in Renal Disease Equation on the Centers for Medicare and Medicaid Services Medical Evidence Form (Form 2728) [16]. We estimated the burden of each patient's comorbidity within the 30 days prior to the IV iron exposure period from Medicare claims using an index score developed by Liu et al. [18]. We assessed patients' serum albumin and creatinine values prior and closest to the exposure start date within a maximum of 30 days. We considered infection to be present during a 21-day period prior to the start of the exposure period if patients were either prescribed IV antibiotics in the dialysis unit for more than 2 days during that period or hospitalized for infection during that period (see Supplementary data, Methods). We also assessed patients' dialysis facility locations and types of vascular access at baseline. To reflect the likelihood of iron deficiency, we created a 5-level categorical variable incorporating both TSat and ferritin values (see Supplementary data, Methods).
Statistical analyses
Primary analyses
We described differences in characteristics between patients with maintenance versus non-maintenance IV iron administration using one-way ANOVA for continuous variables and χ2 test for categorical variables. We quantified patients' relative odds of reaching the Hb and ESA targets using multivariable logistic regression models, adjusting for potential confounders including demographics (age, sex, race, ethnicity); clinical and treatment parameters (cause of end-stage renal disease, eGFR, BMI, comorbidity and year of dialysis initiation); iron dose (total iron dose during the exposure period); measures of iron stores (TSat and ferritin at the start of the exposure period); starting Hb and mean weekly ESA dose during the exposure period; and recent history of pro-infectious and pro-inflammatory parameters (vascular access, serum albumin, serum creatinine and infection). We assessed the association between strategy of IV iron administration during the exposure period and mortality using a Kaplan–Meier plot and logistic regression models adjusted for the same sets of confounders.
Sensitivity analyses
Because we hypothesized Hb at the start of the exposure period to be an important confounder, we also performed all analyses stratified by Hb at the start of the exposure period. We also assessed the influence of iron dose on our findings by performing a sensitivity analysis without adjustment for IV iron dose during the exposure period.
We hypothesized that patients who received no IV iron during the exposure period might be different from other patients not receiving maintenance IV iron regimens. Therefore, we performed a sensitivity analysis excluding these patients.
To study the influence of our study inclusion criteria, which did not require that all patients have TSat, ferritin and Hb available simultaneously, we performed a sensitivity analysis in which we restricted the study population to those who had all three laboratory values available at the same date. To assess the impact of our requirement that included patients have information on both exposure and outcome, we performed an additional sensitivity analysis in which we also included patients with information on the achievement of their Hb target but not their ESA dose requirements.
Missing values
After selecting our cohort, we imputed missing data by multiple imputation using chained equations and included all analysis covariates in the imputation models to predict missing values. The following variables had missing values and were imputed: serum creatinine (n = 22; 0.2%), vascular access (n = 262; 1.9%), eGFR (n = 166; 1.1%) and BMI (n = 168; 1.3%).
Model checks
We performed Wald tests to assess differences in outcomes among the strategies within the models. We conducted analyses with cluster–robust variance correction to adjust for potential clustering of observed effects within individual dialysis centers. We checked all models for linearity by inspection of plots of Pearson residuals versus continuous covariates. Only Hb did not show a linear distribution, therefore spline terms were incorporated (11 and 13 g/dL). We used STATA version 12 (College Station, TX, USA) for all analyses.
RESULTS
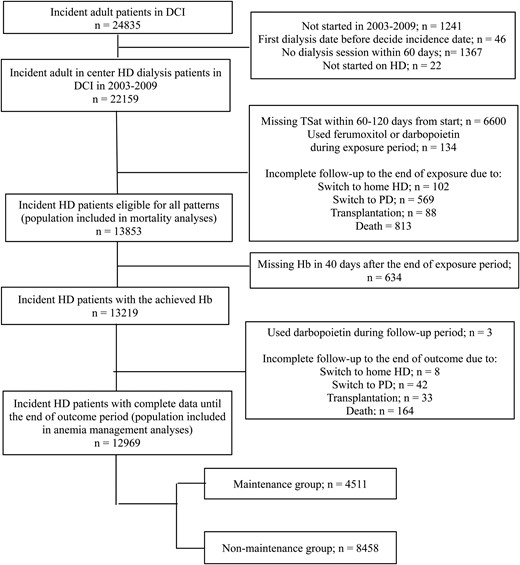
Flow diagram of in- and exclusion of study participants in the maintenance and non-maintenance IV iron administration strategy groups. CI, confidence interval; DCI, Dialysis Clinic Inc.; HD, hemodialysis; PD, peritoneal dialysis; TSat, transferrin saturation; Hb, hemoglobin.
Table 1 presents the baseline characteristics of the included patients according to IV iron administration strategy. Among those administered maintenance IV iron, 1289 (29%) patients were administered weekly IV iron, 1815 (40%) every 2 weeks, 828 (18%) every 3 weeks and 579 (13%) patients were administered IV iron every 4 weeks during the 12-week exposure period. The total iron dose during the exposure period was greater among the maintenance group compared with the non-maintenance group [mean iron dose in maintenance 1002 mg (standard deviation 575 mg) versus 775 (656) mg in the non-maintenance group (P < 0.001)]. Mean weekly ESA dose was lower in patients using maintenance IV iron [i.e. mean dose 564 (368) versus 590 (394) units/kg per week, P < 0.01] within this exposure period.
Baseline characteristics by IV iron dosing pattern
| Variables | Maintenance (n = 4511) | Non-maintenance (n = 8458) | P-value |
|---|---|---|---|
| Age (years) | 62 (15) | 62 (15) | 0.29 |
| Male (%) | 2500 (55) | 4593 (54) | 0.22 |
| Race (%) | 0.47 | ||
| White | 2694 (60) | 4962 (59) | |
| Black | 1616 (36) | 3122 (37) | |
| Ethnicity (%) | 0.04 | ||
| Hispanic | 237 (5) | 520 (6) | |
| Non-Hispanic | 4274 (95) | 7938 (94) | |
| Cause of end-stage renal disease (%) | 0.04 | ||
| Diabetes | 2208 (49) | 4025 (48) | |
| Hypertension | 1280 (28) | 2349 (28) | |
| Glomerulonephritis | 392 (9) | 741 (9) | |
| Other | 631 (14) | 1343 (16) | |
| Comorbidities (%) | |||
| Diabetes | 2908 (64) | 5305 (63) | 0.05 |
| Congestive heart failure | 1985 (44) | 3759 (44) | 0.63 |
| Liver disease | 65 (1) | 121 (1) | 0.96 |
| Cancer | 445 (10) | 899 (11) | 0.17 |
| eGFR (mL/min/1.73 m2) | 10.0 (4.4) | 10.0 (4.5) | 0.60 |
| Body mass index (kg/m2) | 29 (8) | 29 (8) | < 0.01 |
| Vascular access (%) | < 0.01 | ||
| Central venous catheter | 2970 (66) | 5670 (67) | |
| Arteriovenous fistula | 1012 (22) | 1728 (20) | |
| Arteriovenous graft | 465 (10) | 881 (10) | |
| Dialysis dose (single pool weekly Kt/V) | 1.32 (SD 0.60) | 1.35 (SD 0.54) | 0.01 |
| Hemoglobin at the start of exposure (mg/dL) | < 0.01 | ||
| ≤10 | 260 (6) | 707 (8) | |
| 10–12 | 1246 (28) | 2634 (31) | |
| ≥12 | 3005 (67) | 5117 (61) | |
| Ferritin at the start of exposure (ng/mL) | 361 (252) | 423 (432) | < 0.01 |
| TSat at the start of exposure (%) | 23.0 (10.0) | 22.8 (13.3) | 0.37 |
| Indication for iron at the start of exposure (%) | < 0.01 | ||
| Ferritin ≤500 ng/mL and TSat ≤20% | 1660 (37) | 3744 (44) | |
| Ferritin 501–800 ng/mL and TSat ≤20% | 253 (6) | 564 (7) | |
| Ferritin ≤500 ng/mL and TSat 20–30% | 1292 (29) | 1374 (16) | |
| Ferritin >800 ng/mL regardless of TSat | 181 (4) | 1163 (14) | |
| Others | 1125 (25) | 1613 (19) | |
| Year of dialysis initiation (year) | 2006 (1.8) | 2006 (2.1) | < 0.01 |
| Serum albumin (g/dL) | 3.6 (0.4) | 3.6 (0.5) | < 0.01 |
| Serum creatinine (mg/dL) | 6.7 (2.8) | 6.7 (2.8) | 0.316 |
| Infection (%) | 714 (16) | 1575 (19) | < 0.01 |
Age, estimated glomerular filtration rate (eGFR), total iron dose, mean weekly erythropoietin stimulating agent (ESA) dose, body mass index, ferritin at the start of the exposure period, transferrin saturation (TSat), year of dialysis initiation, serum albumin and serum creatinine are expressed as mean values (standard deviations); all others are expressed as numbers (percentages).
Association of IV iron administration strategy with outcomes
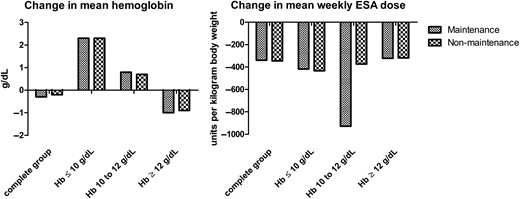
Differences in hemoglobin levels and mean weekly erythropoietin stimulating agent (ESA) doses before and after the exposure period. The figure represents the difference in means of hemoglobin levels and mean weekly doses corrected for body weight (units/kg).
Odds ratios for IV iron administration strategy with achievement of anemia management goals
| Anemia management goals | Maintenance (n = 4511) | Non-maintenance (n = 8458) | P-value |
|---|---|---|---|
| Achievement of hemoglobin 10–12 g/dL | |||
| Crude | 0.95 (0.88–1.03) | Reference | 0.19 |
| Adjusted | 1.01 (0.93–1.09) | Reference | 0.86 |
| Reduction in mean weekly ESA dose of 25% or more | |||
| Crude | 1.33 (1.18–1.49) | Reference | < 0.01 |
| Adjusted | 1.15 (1.02–1.30) | Reference | 0.02 |
| Mortality | Maintenance n = 4708 | Non-maintenance n = 9145 | |
| Crude | 0.52 (0.44–0.62) | Reference | < 0.01 |
| Adjusted | 0.73 (0.62–0.86) | Reference | < 0.01 |
ESA is erythropoietin stimulating agent. Adjusted analyses include demographic, clinical and treatment parameters (age, sex, race, ethnicity, cause of end-stage renal disease, comorbidity and year of dialysis initiation), total iron dose during the exposure period, measures of iron stores (transferrin saturation and ferritin) and hemoglobin at the start of the exposure period, mean weekly erythropoietin stimulating agent dose in units/kg during the exposure period and pro-infectious and pro-inflammatory parameters (vascular access, serum albumin, serum creatinine and recent infection).
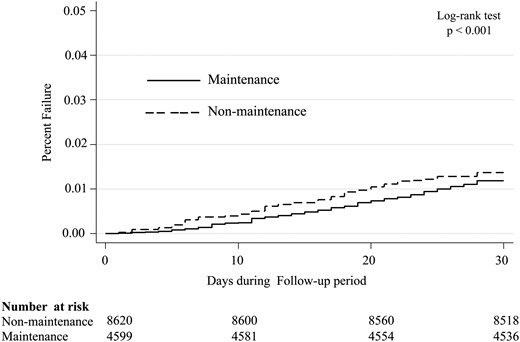
Kaplan–Meier curve presenting the cumulative probability of mortality for the maintenance and non-maintenance IV iron administration strategy groups during the follow-up period.
Sensitivity analyses
Stratified analyses showed associations of maintenance IV iron administration with ESA reduction to be strongest among patients with Hb above 12 g/dL at the start of the exposure period; this was also the group with the largest difference in mortality (Table 3). Baseline characteristics did not differ among the subgroups (Supplementary data, Tables S3 and S4).
Odds ratios for IV iron administration strategies with anemia management goals and mortality stratified by hemoglobin at the start
| Hb achievement | P-value | Reduction in mean weekly ESA dose of 25% or more | P-value | Mortality | P-value | ||||
|---|---|---|---|---|---|---|---|---|---|
| Maintenance n = 4511 | Non-maintenance n = 8458 | Maintenance n = 4511 | Non-maintenance n = 8458 | Maintenance n = 4708 | Non-maintenance n = 9145 | ||||
| Hemoglobin ≤10 g/dL at the start | |||||||||
| Crude | 0.84 (0.60–1.18) | Reference | 0.32 | 1.05 (0.76–1.44) | Reference | 0.76 | 0.78 (0.48–1.28) | Reference | 0.33 |
| Adjusted | 0.81 (0.57–1.16) | Reference | 0.25 | 1.00 (0.70–1.43) | Reference | 1.00 | 1.17 (0.72–1.88) | Reference | 0.53 |
| Hemoglobin 10–12 g/dL at the start | |||||||||
| Crude | 0.86 (0.75–0.98) | Reference | 0.02 | 1.13 (0.93–1.38) | Reference | 0.21 | 0.50 (0.37–0.68) | Reference | < 0.01 |
| Adjusted | 0.94 (0.81–1.08) | Reference | 0.38 | 1.05 (0.85–1.30) | Reference | 0.64 | 0.72 (0.51–1.00) | Reference | 0.05 |
| Hemoglobin ≥12 g/dL at the start | |||||||||
| Crude | 1.00 (0.91–1.11) | Reference | 0.96 | 1.40 (1.18–1.65) | Reference | < 0.01 | 0.52 (0.42–0.65) | Reference | < 0.01 |
| Adjusted | 1.06 (0.96–1.18) | Reference | 0.25 | 1.27 (1.07–1.52) | Reference | 0.01 | 0.69 (0.55–0.87) | Reference | < 0.01 |
ESA is erythropoietin stimulating agent. Adjusted analyses include demographic, clinical and treatment parameters (age, sex, race, ethnicity, cause of end-stage renal disease, comorbidity and year of dialysis initiation), total iron dose during the exposure period, measures of iron stores (transferrin saturation and ferritin) and hemoglobin at the start of the exposure period, mean weekly erythropoietin stimulating agent dose in units/kg during the exposure period and pro-infectious and pro-inflammatory parameters (vascular access, serum albumin, serum creatinine and recent infection).
In sensitivity analyses, which (i) did not adjust for total IV iron dose administered during the exposure period, (ii) excluded patients who received no iron from the non-maintenance group, (iii) restricted the study population to patients for whom the TSat, ferritin and Hb were available, (iv) used ferritin and TSat categories in line with the European guidelines [19] findings were very similar to our primary findings (Supplementary data, Table S5). The lack of association between IV iron administration strategy and the achievement of Hb targets persisted when we additionally included patients who only had an Hb value present during the outcome assessment period [adjusted OR 1.01 (95% CI 0.93–1.09)].
DISCUSSION
Among patients recently initiating hemodialysis, maintenance strategies of IV iron administration over a 12-week period were not associated with odds of achieving an Hb 10–12 g/dL. However, maintenance strategies were associated with reduction in ESA dose utilization of at least 25% and with 27% lower odds of early death, compared with non-maintenance strategies. Associations were independent of ESA and of cumulative iron doses. The implication of these findings is that administering regularly scheduled maintenance IV iron administration could not only lower ESA use and therein patient care costs, but it could also impact important clinical outcomes, including survival, as was found in this analysis.
To our knowledge, this study is the first comparative analysis of IV iron administration strategies on anemia management in incident hemodialysis patients. These patients require high doses of iron initially and are free from survivor bias, and thus represent a unique and clinically relevant population. In this population, our findings contribute to a growing body of evidence, including reports from a recent large observational study [13–15] and some small randomized controlled trials in prevalent patients [12, 20]. Prior studies have yielded findings both congruent and conflicting with ours, underscoring the complexity of interpreting study findings regarding the effects of IV iron administration on outcomes among hemodialysis patients. A recent observational study involving mainly prevalent patients from a different large US provider and focusing on bolus IV iron administration reported that bolus IV administration was associated both with more frequent achievement of Hb targets and with reductions in ESA requirements when compared with a maintenance IV iron administration strategy [13]. However, the former study also found that bolus administration was associated with higher cardiovascular and infectious mortality when compared with maintenance, congruent with our findings of reduced mortality with maintenance IV iron administration [14, 15].
Conflicting study findings could reflect differences in study design. For example, we studied the administration of IV iron administration shortly after patients initiated in-center hemodialysis, while prior studies studied primarily prevalent patients or populations consisting of both incident and prevalent patients [12–15, 20–22]. Furthermore, while we assessed IV iron administration strategies over a 12-week period, in concert with clinical practice guidelines [19], prior studies have assessed this over varying time periods, ranging from 4 [13–15] to 24 weeks [20]. When using a 1-month period to assess IV iron administration strategies and evaluating its outcomes in the following 6 weeks, as was done in the most recent large observational studies [13–15], the consequence is that the IV iron administration is very close to the outcome. Indeed, someone who just received a bolus of IV iron is more likely to have an increase in Hb and a decline in ESA dose, compared with someone who did not receive this bolus. But, over time, the patient receiving IV iron in a bolus strategy will have a decline in iron stores, followed by a decrease in Hb and an increase in ESA dose. Although we also followed patients for a period of 4 weeks after IV iron administration, the longer 12-week time frame we used to characterize the IV iron management strategy in our study may have strengthened our ability to capture sustained effects of iron management.
A final major difference in design to be mentioned is the fact that definitions of maintenance and non-maintenance strategies of IV iron administration vary widely among published studies, i.e. from regular doses following an initial loading dose [22] and aiming for a TSat of between 30 and 50% [12, 20] or any strategy not being a bolus regime [13–15]. As we hypothesized that a maintenance strategy potentially leads to a higher likelihood of being in target of Hb while receiving less ESA, we chose to compare any ‘true’ maintenance administration strategy (i.e. regular schedule) to any other IV iron administration strategy. Interestingly, we found that with this definition and our assessment over 12 weeks, the maintenance group received more iron overall, while in the previously mentioned studies the bolus groups received more iron. Correction for iron dose in our main models did not change our results, however. Furthermore, the sensitivity analysis excluding those who received no iron from the non-maintenance group showed findings similar to our main results, while iron doses after removing those who were receiving no iron were similar [i.e. 1000.7 (SD 574.4)] among the non-maintenance group versus 1002 mg (575 mg) in the maintenance group (P = 0.89). This suggests that iron dose is unlikely to be driving these results.
In our subgroup analyses, differences in ESA reduction and early mortality were most pronounced among patients with Hb exceeding 12 g/dL at the start of the IV iron exposure period. Reasons for this observation are unclear. However, it is possible that patients with higher Hb levels may receive less ESA and therefore be potentially at less risk of ESA-associated health hazards compared with patients with lower Hb receiving more ESA treatment. Indeed, patients starting with the lowest Hb, as expected, received the highest ESA doses (and the lowest IV iron doses) and vice versa (Supplementary data, Table S2). Another explanation could be that patients who start with a low Hb have more comorbidities, are at higher risk of ESA resistance and have less stable iron levels. One could hypothesize that this group therefore would not benefit from any IV iron strategy.
Like any observational study, ours could be influenced by unobserved and residual confounding, including confounding by indication. Also, we reported a statistically significant difference in dialysis dose at baseline; however, these absolute values do not reflect a clinically significant difference between the two groups. This observed difference is likely due to the large study population. In addition, restriction of our cohort to patients with all information available to define the IV iron administration strategies and outcomes limited our sample size and may have limited the generalizability of our findings, due to selection bias. Furthermore, IV iron administration protocols may vary from provider to provider and could influence findings. For example, during the period 2003–09 of our study, the Hb goal for clinicians was not uniform. Thus, other factors besides Hb goals might have influenced decisions to choose a certain IV iron administration strategy. Furthermore, we did not have other data such as C-reactive protein, which could have provided additional insight to our findings. Rigorous randomized controlled trials performed among nationally representative populations that carefully measure both patterns and doses of IV iron administration as well as competing risks for the achievement of important clinical outcomes are needed. Nonetheless, we believe that the careful selection of our incident cohort from a representative US dialysis population, in combination with a clinically robust design and thorough analyses, contributes important insight into the potential benefits of maintenance IV iron therapy on clinical care and important patient outcomes.
In conclusion, maintenance IV iron administration strategies were not associated with improved achievement of Hb targets among patients recently initiating hemodialysis, but they were associated with significantly lower ESA requirements and even more importantly lower early mortality, compared with patients on non-maintenance IV iron administration strategies, independent of iron doses. Our findings provide evidence that maintenance IV iron administration may represent a beneficial treatment strategy for incident hemodialysis patients, but the findings of this observational study should be confirmed by randomized clinical trials.
ACKNOWLEDGEMENTS
The authors express their gratitude to the staff and patients of Dialysis Clinic, Inc. The Developing Evidence to Inform Decisions about Effectiveness (DEcIDE) Network Patient Outcomes in ESRD Study was supported by the Agency for Healthcare Research and Quality (AHRQ) contract HHSA290200500341I, Task Order #6. W.M.M. was supported by a Postdoctoral Full Fellowship Abroad grant (KFB 11.005) of the Dutch Kidney Foundation (Nierstichting), The Netherlands. D.C.C. was supported by grant K23DK097184 from the National Institute of Diabetes and Digestive and Kidney Diseases (NIDDK) of the National Institutes of Health (NIH) and the Gilbert S. Omenn Anniversary Fellowship of the Institute of Medicine. T.S. was supported by grant K23DK083514 and J.J.S. was supported by grant K23DK095949 from the NIDDK (NIH). The sponsors did not have any role in the study design, collection, analysis, interpretation of the data, writing the report or the decision to submit the report for publication. N.T. was supported by the MHRC Establishment Award and the KRESCENT New Investigator Award. The KRESCENT Award is a joint initiative of the Kidney Foundation of Canada, Canadian Institute of Health Research and the Canadian Society of Nephrology.
AUTHORS' CONTRIBUTIONS
Research idea: B.G.J., D.C.M., K.M., K.B.R., L.E.B., N.T., P.L.E. Study design: B.G.J., D.C.C., D.C.M., J.J.C., K.B.R., K.B.M., L.E.B., N.T., P.L.E., S.M.S., T.S., W.M.M. Data acquisition: L.E.B., P.L.E. Statistical analyses: K.B.R., Y.L., C.A.C. Data analyses interpretation: B.G.J., D.C.C., D.C.M., J.J.C., K.B.R., L.E.B., N.T., P.L.E., S.M.S., T.S., W.M.M., Y.L. Supervision and mentorship: B.G.J., K.B.M., K.B.R., L.E.B. Each author contributed important intellectual content during manuscript drafting or revision and accepts accountability for the overall work by ensuring that questions pertaining to the accuracy or integrity of any portion of the work are appropriately investigated and resolved. L.E.B. takes responsibility that this study has been reported honestly, accurately and transparently, that no important aspects of the study have been omitted and that any discrepancies from the study as planned (and, if relevant, registered) have been explained.
CONFLICT OF INTEREST STATEMENT
None declared.
REFERENCES
APPENDIX
The DEcIDE Network Patient Outcomes in End Stage Renal Disease Study Team consists of members from the Johns Hopkins University, Baltimore, MD, USA (L. Ebony Boulware, Karen Bandeen-Roche, Courtney Cook, Josef Coresh, Deidra Crews, Patti Ephraim, Bernard G. Jaar, Jeonyong Kim, Yang Liu, Jason Luly, Aidan McDermott, Wieneke Michels, Paul Scheel, Tariq Shafi, Stephen Sozio, Albert Wu, Jing Zhou); University of California, San Francisco, CA, USA (Neil Powe); Chronic Disease Research Group, Minneapolis, MN, USA (Allan Collins, Robert Foley, David Gilbertson, Haifeng Guo, Brooke Heubner, Charles Herzog, Jiannong Liu, Wendy St Peter); Cleveland Clinic Foundation, Cleveland, OH, USA (Joseph Nally, Susana Arrigain, Stacey Jolly, Vicky Konig, Xiaobo Liu, Sankar Navaneethan, Jesse Schold); University of New Mexico, Albuquerque, NM, USA (Philip Zager); Tufts University, Boston, MA, USA (Dana Miskulin, Klemens Meyer); University of Miami, Miami, FL, USA (Julia Scialla); University of Manitoba, Winnipeg, Manitoba, Canada (Navdeep Tangri) and Academic Medical Center, Amsterdam, The Netherlands (Wieneke Michels).


Comments