


Background. The recent interest in incremental haemodialysis (HD) is hindered by the current prescription based on a fixed target model (FTM) for the total (dialytic + renal) equivalent continuous clearance (ECC). The latter is expressed either as standard Kt/V (stdKt/V), i.e. the pre-dialysis averaged concentration of urea-based ECC, or EKRc, i.e. the time averaged concentration-based ECC, corrected for volume (V) = 40 L. Accordingly, there are two different targets: stdKt/V = 2.3 volumes per week (v/wk) and EKRc = 13 mL/min/40 L. However, fixing the total ECC necessarily implies perfect equivalence of its components—the residual renal urea clearance (Kru) and dialysis clearance (Kd). This assumption is wrong because Kru has much greater clinical weight than Kd. Here we propose that the ECC target varies as an inverse function of Kru, from a maximum value in anuria to a minimum value at Kru levels not yet requiring dialysis. The aim of the present study was to compare the current FTM with the proposed variable target model (VTM).
Methods. The double pool urea kinetic model was used to model dialysis sessions for 360 virtual patients and establish equations predicting the ECC as a function of Kd, Kru and the number of sessions per week. An end-dialysis urea distribution V of 35 L (corresponding to a body surface area of 1.73 m2) was used, so that the current EKRc target of 13 mL/min/40 L could be recalculated at an EKRc35 value of 12 mL/min/35 L equal to 12 mL/min/1.73 m2. The latter also coincides with the maximum value of the EKRc35 variable target in anuria. The minimum target value of EKRc35 was assumed to coincide with Kru corrected for V = 35 L (i.e. Krc35 = 6 mL/min/1.73 m2). The corresponding target for stdKt/V was assumed to vary from 2.3 v/wk at Krc35 = 0 to 1.7 v/wk at Krc35 = 6 mL/min/1.73 m2. On this basis, the variable target values can be obtained from the following linear equations: target EKRc35= 12 − Krc35; target stdKt/V = 2.3 − 0.1 × Krc35. Two versions of stdKt/V were considered: the classic version (stdKt/VGotch) with Kru at 70%, and the current version (stdKt/VDaug) with Kru at 100%.
Results. The VTM with stdKt/VGotch produces results very close to those using the FTM with stdKt/VDaug. Once-weekly HD is virtually not allowed by the FTM. In contrast, the VTM allows dialysis to start at Krc35 ∼5 mL/min/1.73 m2 on a once-weekly HD schedule, at least in relatively healthy patients; this schedule can be maintained until Krc35 falls below 4 mL/min/1.73 m2, at which point the schedule should be changed to a twice-weekly HD schedule, that, in turn, could be maintained until Krc35 falls below 2 mL/min/1.73 m2.
Conclusions. A paradigm shift from the FTM to the VTM in the prescription of incremental HD is proposed, whereby the VTM would allow less frequent treatments at lower Kru, with important clinical and economic implications. This approach is likely to be safe but needs to be confirmed by randomized controlled trials.
INTRODUCTION
The majority of patients initiating dialysis have some degree of residual renal function (RRF). Although the importance of RRF is widely appreciated for peritoneal dialysis (PD) patients, the majority of haemodialysis (HD) centres do not take into account the RRF and start patients on a thrice-weekly HD (3-HD/wk) schedule, despite the Kidney Disease Outcomes Quality Initiative (KDOQI) guidelines suggesting that dialyser urea clearance (Kt/V) targets could be reduced for patients with a residual renal urea clearance (Kru) of ≥2.0 mL/min/1.73 m2 [1]. In recent years, renewed interest in twice-weekly HD (2-HD/wk) schedules and in incremental HD in general has been shown [2]. In practice, however, such interest is discouraged by the current HD adequacy guidelines [3, 4] that, by overestimating the dialysis needs in the presence of substantial RRF, would require such high values for both the RRF and dialysis dose (Kt/V) [2, 5] that it would be difficult to prescribe less frequent treatments. According to the above guidelines [3, 4], the dialysis dose can be relatively low at dialysis inception but should be progressively increased to compensate for any subsequent reduction in RRF. The general principle for calculating the amount of dialysis required to compensate for RRF reduction is based on the constancy of a given target value for the total (dialytic + renal) equivalent continuous clearance (ECC) over a 1 week period, i.e. at any point in time, the sum of Kru and the component of the equivalent continuous clearance (ECCd) provided by the intermittent dialysis clearance (Kd) should achieve the fixed total ECC target [6, 7]. The above principle has been advocated by KDOQI [3] and European Best Practice Guidelines [4]. However, they use two different versions of the ECC, namely the standard Kt/V (stdKt/V), i.e. the pre-dialysis averaged concentration (PAC)-based ECC [6, 8], and the time averaged concentration (TAC)-based ECC (EKR), corrected for urea distribution volume (V) = 40 L (EKRc) [7], respectively. Accordingly, there are two different targets: stdKt/V = 2.3 volumes per week (v/wk) [3] and EKRc = 13 mL/min/40 L [4].
However, fixing the total ECC necessarily implies perfect equivalence of its renal and dialytic components. This assumption is wrong because Kru has much greater clinical weight than Kd. This is more readily apparent when considering EKRc; paradoxically, it should not matter if the fixed total target value of 13 mL/min/40 L is obtained by summing up Kru = zero and ECCd = 13 mL/min/40 L, or Kru = 13 mL/min/40 L and ECCd = zero. This assumption is no longer tenable, because, in agreement with a basic physiology notion, many studies have shown that the native kidney function is clinically much more important than dialysis clearances [9–13]. The mistake probably derives from an underestimation of the risks associated with extrapolation to the clinical domain of the equivalence between Kru and Kd existing in the context of the urea kinetic model (UKM), in which 1 mL/min of RRF, represented by Kru, removes the same amount of urea as 1 mL/min of Kd does [14]. In contrast, we propose that the total ECC target varies as an inverse function of Kru, from a maximum value in anuria to a minimum value at Kru levels not yet requiring dialysis. In other words, here we propose a paradigm shift from the fixed target model (FTM) to the variable target model (VTM) in the prescription of incremental HD.
The aim of the present study was to compare the results expected from using the FTM with those from using the VTM in a large group of virtual patients with a wide range of Kru and dialysis doses and receiving 1-, 2- or 3-HD/wk schedules. Furthermore, to verify the clinical plausibility of the proposed VTM, data from a historical cohort of 150 patients starting HD over a 15-year time period and followed up for at least 3 months were analysed.
MATERIALS AND METHODS
Study design
The study design included two studies—Study A and Study B. Approval of the protocols (in accordance with the Declaration of Helsinki) was obtained from the Research Ethics Committee of the Miulli General Hospital. Informed consent was obtained from all studied patients.
Study A: simulation study
The formal double pool UKM was used to model the blood urea nitrogen (BUN) concentration profile over a week for 360 virtual patients characterized by a range of Kt/V, Kru and treatment schedules. An original software emulating the web-based Solute-Solver program was used [15, 16], which allowed calculation of PAC and TAC to be used for computing stdKt/V [6, 8] and EKRc [7], respectively.
Two different versions of stdKt/V were computed. The first version is the original index, introduced by Gotch as the G/PAC ratio [6]. The second is a modified version of the first version and was introduced by Daugirdas et al. [8] to account for the greater importance of Kru; it has been endorsed by the 2015 update of the KDOQI clinical practice guidelines for HD adequacy [3]. For clarity, the two parameter versions are denoted as stdKt/VGotch and stdKt/VDaug, respectively. Moreover, the equilibrated Kt/V (eKt/V) was calculated by iteration [16, 17], to be used to predict EKRc as a function of Kru for the 1-, 2- and 3-HD/wk schedules.
The individual characteristics of the 360 virtual patients were obtained by changing the value of one input parameter at a time, from an otherwise fixed input data set. The changing parameters were: double pool Kt/V (from 0.1 to 2.0, step 0.1), Kru (from 0 to 5 mL/min, step 1) and frequency of weekly treatments (from 1 to 3, step 1). In total, there were 360 patients (20 Kt/V × 6 Kru × 3 schedules). The other input parameters were: post-dialysis volume (V = 35 L), urea generation rate (G = 5.357 mg/min), corresponding to a normalized protein catabolic rate (NPCR) = 1 g/kg/day and session length (T) = 240 min. The inter-dialysis weight gain was assumed to vary as a function of three levels of Kru: 0.72 mL/min (∼7.2 L/week) for Kru ≤1 mL/min, 0.36 mL/min (∼3.6 L/week) for Kru ≤3 mL/min and 0.12 mL/min (∼1.2 L/week) for Kru ≥3 mL/min. Thus, the weekly fluid gain (equal to weekly ultrafiltration) is the sum of the weekly inter-dialysis weight gains. It is: b (the mean inter-dialysis weight gain rate, mL/min) × 10 080 (minutes in a week) − T × n dialysis sessions in a week; thus, weekly fluid gain (ultrafiltration) is: b × (10 080 − n × T).
Kd for the first session was computed from Kt/V, T and V. For subsequent sessions in the week, if any, Kd was corrected for the associated ultrafiltration rates [16].
The BUN profile was computed by numerical integration [16, 18] of the model equations [15, 16] for proximal (presumed extracellular) and distal (presumed intracellular) concentrations, minute by minute, for the 10 080 min of a week. The model constants were the same as in the Solute-Solver program [16]: fixed distal compartment V = 2/3 × V, post-dialysis proximal V = 1/3 × V, pre-dialysis extracellular V = V + intra-dialysis weight loss and intercompartment clearance = 16 × V = 560 mL/min.
Of note, since the average ratio of V to body surface area (BSA) was ∼20 [16], a V of 35 L corresponded to a BSA of ∼1.73 m2, so that, by correcting EKR for a double pool volume (V2p) of 35 L, instead of the previous single pool V of 40 L, we obtained a new version of EKRc, namely EKRc35= EKR/V2p × 35 L, with units expressed either as mL/min/35 L or as mL/min/1.73 m2. The same applied to the correction of Kru for V, namely Krc35= Kru/V2p × 35 L, with units as mL/min/35 L or mL/min/1.73 m2.
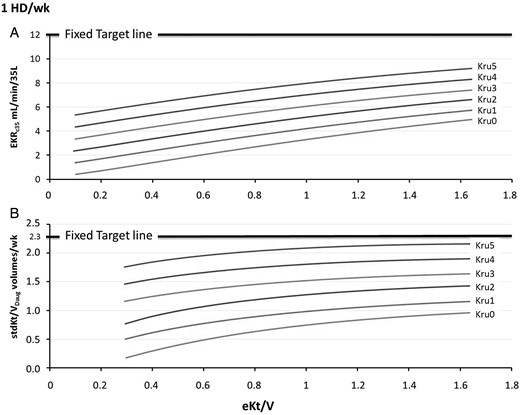
Once-weekly HD schedule: simulation results of the relationship between EKRc35 (A) or stdKt/VDaug (B) and eKt/V for integer Kru values ranging from 0 to 5 mL/min in virtual patients with V = 35 L (in this case Kru coincides with Krc35). The graph can be used for patients with V ≠ 35, by transforming their actual Kru (mL/min) into Krc35 (mL/min/35 L, or mL/min/1.73 m2). The intersection of the relationship curves with vertical lines allows quantifying either EKRc35 (A) or stdKt/VDaug (B), as a function of both Krc35 and eKt/V. Vice versa, the intersection with horizontal lines allows calculating the eKt/V to be prescribed. In (A), the thick horizontal line of EKRc35 = 12 mL/min/35 L is the fixed target and corresponds to the variable targets associated with Krc35 of 0. In (B), the horizontal line of stdKt/VDaug of 2.3 v/wk corresponds to the variable targets associated with Krc35 of 0.

Twice-weekly HD schedule: simulation results of the relationship between EKRc35 (A) or stdKt/VDaug (B) and eKt/V for integer Kru values ranging from 0 to 5 mL/min in virtual patients with V = 35 L. The legend of Figure 1 also applies to Figure 2.

Thrice-weekly HD schedule: simulation results of the relationship between EKRc35 (A) or stdKt/VDaug (B) and eKt/V for integer Kru values varying from 0 to 5 mL/min in virtual patients with V = 35 L. The legend of Figure 1 also applies to Figure 3.
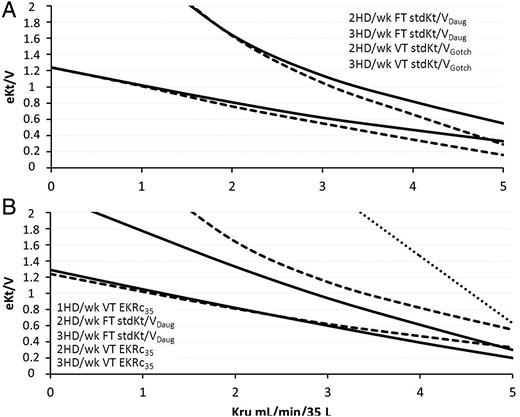
(A) Comparison between eKt/V fixed target (FT) ‘adequacy lines’ for stdKt/VDaug (solid lines) and variable target (VT) ‘adequacy lines’ for stdKt/VGotch (dashed lines) on 2-HD/wk and 3-HD/wk schedules. (B) Comparison between eKt/V fixed target ‘adequacy lines’ for stdKt/VDaug (dashed lines) and variable target adequacy lines for EKRc35 (dashed lines) on 2-HD/wk and 3-HD/wk schedules. The once-weekly ‘adequacy line’ is shown only for the variable target EKRc35 (dotted line).
Study B: clinical study
The main clinical and urea kinetic data from a historical cohort of 150 patients starting HD treatment at the Dialysis Unit of Matera Hospital over a 15-year period and followed up for at least 3 months were analysed. Data were extracted from a database already used for a retrospective study evaluating the outcome of incident HD patients on different treatment schedules [19]. Twenty patients were excluded from analysis for the following reasons: large variability of schedules and/or strategies of previous sessions (10 patients), incomplete data set (4 patients) and unreliable kinetic results (6 patients). Thus, the final analysis was performed on 130 incident HD patients. In the present study, we analysed only data associated with the urea kinetics measurements performed at month 3 after dialysis inception, when Kru is often present and less frequent dialysis is possible.
Pre-dialysis blood samples were collected before injecting any saline, heparin or other diluents; a second sample was obtained 15 s post-dialysis using a slow-flow technique [3, 4]. Urine samples were collected over a 24-h period and the time interval between the end of urine collection and pre-dialysis blood sampling was ∼1 h.
According to the Solute-Solver program, the data set used comprised: age, gender, height, dialysis schedule, blood-draw day of the week, pre- and post-dialysis body weight, blood flow rate, dialysate flow rate, dialyser mass transfer area coefficient for urea in vitro (KoA, mL/min, as reported by the manufacturer), pre- and post-dialysis BUN, urinary urea nitrogen concentration, urine volume, duration of collection period and time interval between the end of urine collection and dialysis start. These data were used to compute EKRc35, stdKt/VGotch and stdKt/VDaug using the UKM. A comparison was made between the paired EKRc35 values obtained using the UKM and the equations predicting EKRc35 in Study A (simulation study).
Statistics
Microsoft Excel 2010 software was used for calculating means and standard deviations, plotting the graphs and fitting the equations. All statistical inferences were made using IBM SPSS Statistics 20.0 (SPSS Inc., Chicago, IL, USA) and values of P < 0.05 were assumed as statistically significant. One-way analysis of variance (ANOVA) was performed to compare the three groups (1-HD/wk, 2-HD/wk and 3-HD/wk schedules). The χ2 test was used for distributions between groups of categorical variables, and the Bland–Altman plot was used to analyse correlations between modelled and predicted ECC values.
RESULTS
Study A: simulation study
Figures 1–3 show the relationships between either EKRc35 or stdKt/VDaug and eKt/V, for discrete Kru values and for 1-, 2- and 3-HD/wk schedules. Of note, these graphs can be used to either quantify the ECC (as a function of eKt/V, Kru and schedule) or calculate the eKt/V to be prescribed to achieve a given ECC, as a function of the Kru and schedule. Moreover, by drawing a target line, one can immediately see if a given schedule is allowed by the available Kru. Thus, Figure 1A shows that, for patients on a 1-HD/wk schedule, the thick horizontal line of EKRc35= 12 mL/min/35 L, i.e. the fixed target line, in the presence of Krc35 ≤5.0 mL/min/35 L, could not be reached, even with eKt/V values as high as 1.66, roughly corresponding to a double pool Kt/V = 2.0. In contrast, the variable EKRc35 target could be attained for Krc35 ≥4 mL/min/35 L and eKtV ≥1.5; thus, in the presence of Krc35= 4 mL/min/35 L, the appropriate variable EKRc35 target, according to equation (1), was 12 − 4 = 8 mL/min/1.73 m2, which could be attained with an eKt/V ≥1.5. Figure 1B shows similar results for stdKt/VDaug; the fixed target could not be reached, but the variable target could be attained for Krc35= 4 mL/min/1.73 m2, according to equation (2) (2.3 − 0.1 × 4 = 1.9 v/wk), with an eKt/V = 1.2.
Analysis of Figure 2A shows that, on a 2-HD/wk schedule, the fixed target line was crossed by the Kru curve for an eKt/V = 1.6, so that a Kru of at least 3 mL/min/35 L with a high eKt/V was required. According to the VTM, a Kru of at least 2 mL/min/35 L and an eKt/V ≥1.6 were needed; in fact, the target became 10 mL/min/35 L. Figure 2B shows that, on a 2-HD/wk schedule, a stdKt/VDaug ≥2.3 v/wk required a Kru of at least 2 mL/min/35 L with an eKt/V of ∼1.6. In contrast, a Kru of 2 mL/min/35 L would require a variable target of 2.0, which was attainable with an eKt/V of ∼1.7.
Figure 3A shows that, for patients on a 3-HD/wk schedule, the current EKRc35 target of 12 mL/min/35 L was associated with eKt/V values ranging from ∼1.2 to 1.3 in anuria to ∼0.7 in the presence of Kru = 5 mL/min/35 L. Obviously, much lower eKt/V values were required for the VTM in the presence of substantial Kru. Similar results are shown in Figure 3B; the target of 2.3 v/wk on a 3-HD/wk schedule required eKt/V values ranging from 1.2 in anuria to 0.3 for Krc35= 5 mL/min/35 L.
Figure 4 shows the relationships between Kru and eKt/V values required to attain the target for the different ECCs, and for one, two and three HD sessions per week. In other words, they compare the relative efficacy of the three ECCs in terms of ‘adequate’ eKt/V at equal Kru. Moreover, these graphs can be used to both assess the ECC and prescribe the eKt/V. In addition, these graphs not only confirm the results shown in Figures 1–3, but they also allow comparison of the eKt/V lines associated with the three ECCs. Figure 4A also provides a comparison between stdKt/VGotch and stdKt/VDaug; the associated eKt/V lines are nearly coincident, particularly at lower Kru values. Figure 4B, based on the results given in Figure 4A, compares the results obtained using EKRc35 with the VTM with those obtained using stdKt/VDaug with the FTM; on a 3-HD/wk schedule, there was a striking similarity between the two lines, particularly for Kru <4 mL/min/35 L. On a 2-HD/wk schedule, the two lines ran almost parallel at a distance of 0.2–0.3 eKt/V units. On a 1-HD/wk, only the EKRc35 line was possible.
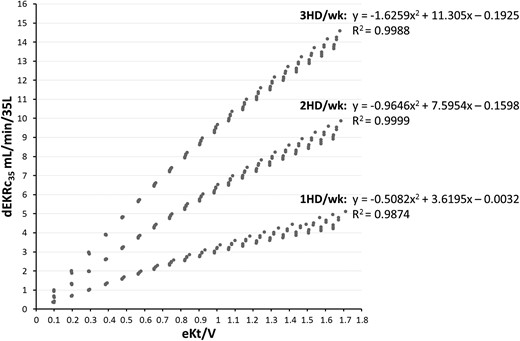
Relationships between the dialytic component of EKRc35 (dEKRc35= EKRc35 − Krc35) and eKt/V delivered for 1-, 2- and 3-HD/wk schedules and for Krc35 ranging from 0 to 5 mL/min/35 L. The fitting equation for each schedule is shown at the top of the curves. Of note, x2= (eKt/V)2; x = eKt/V.
Study B: clinical study
The main clinical and urea kinetic data of 130 incident HD patients are shown in Table 1. Three groups of patients were reported: 30 on 1-HD/wk, 60 on 2-HD/wk and 40 on 3-HD/wk schedules.
Main clinical and urea kinetic data of 130 incident HD patients; the latter studies were performed during and between two dialysis sessions about 3 months after HD initiation
| 1-HD/wk | 2-HD/wk | 3-HD/wk | P | |
|---|---|---|---|---|
| n (males/females) | 30 (21/9) | 60 (39/21) | 40 (15/25) | 0.007a |
| Age (years) | 64.6 ± 14.61 | 71.6 ± 13.23 | 66.4 ± 18.57 | 0.084 |
| Pre-dialysis body weight (kg) | 63.5 ± 12.17 | 63.0 ± 12.70 | 63.8 ± 15.47 | 0.953 |
| Post-dialysis body weight (kg) | 62.1 ± 11.51 | 61.2 ± 12.37 | 61.7 ± 15.06 | 0.942 |
| Blood flow rate (mL/min) | 265 ± 32.6 | 269 ± 30.6 | 270 ± 34.5 | 0.814 |
| KoA (in vitro) (mL/min) | 896 ± 133 | 863 ± 101 | 850 ± 130 | 0.248 |
| Session length (min) | 236 ± 13 | 232 ± 18 | 224 ± 19 | 0.017 |
| Pre-dialysis BUN (mg/dL) | 78 ± 23 | 73 ± 20 | 70 ± 25 | 0.339 |
| Post-dialysis BUN (mg/dL) | 22 ± 8 | 19 ± 7 | 19 ± 8 | 0.351 |
| Urinary output (mL/day) | 1878 ± 651 | 1369 ± 616 | 837 ± 440 | 0.0001 |
| KruCp0 (mL/min) | 4.6 ± 1.79 | 3.2 ± 1.50 | 2.0 ± 1.11 | 0.0001 |
| KruCwb (mL/min) | 4.4 ± 1.64 | 3.2 ± 1.47 | 2.1 ± 1.15 | 0.0001 |
| spKt/V | 1.43 ± 0.246 | 1.55 ± 0.287 | 1.55 ± 0.256 | 0.108 |
| eKt/V | 1.27 ± 0.219 | 1.37 ± 0.256 | 1.36 ± 0.25 | 0.151 |
| V2p (mL) | 30 735 ± 6569 | 27 951 ± 6291 | 27 016 ± 6352 | 0.049 |
| NPCR_2p (g/kg/day) | 0.99 ± 0.254 | 1.12 ± 0.309 | 1.21 ± 0.405 | 0.020 |
| EKRc35 (mL/min/35 L)—double-pool UKM | 8.76 ± 1.755 | 12.1 ± 2.222 | 14.6 ± 3.157 | 0.0001 |
| EKRc35 (mL/min/35 L)—equations (3–5) | 8.86 ± 2.021 | 12.5 ± 2.45 | 14.8 ± 2.144 | 0.0001 |
| stdKt/VGotch (v/wk) | 1.89 ± 0427 | 2.41 ± 0.453 | 2.87 ± 0.604 | 0.0001 |
| stdKt/VDaug (v/wk) | 2.21 ± 0.545 | 2.77 ± 0.600 | 3.18 ± 0.500 | 0.0001 |
| EKRc35≥12 mL/min/35 L, n (%) | 1 (3) | 26 (43) | 36 (90) | 0.0001a |
| EKRc35≥12 − Krc35 mL/min/35 L, n (%) | 30 (100) | 60 (100) | 39 (98) | 0.911a |
| stdKt/VDaug ≥2.3 v/wk, n (%) | 7 (23) | 32 (53) | 39 (98) | 0.0001a |
| stdKt/VDaug ≥2.3 − 0.1 × Krc35 v/wk, n (%) | 16 (53) | 50 (83) | 39 (98) | 0.015a |
Data are mean ± standard deviation unless otherwise indicated.
One-way ANOVA was performed.
aThe χ2 test was used for distributions between groups of categorical variables.
Most of the data were not different among the three groups, with some remarkable, but at least in part expected, differences in the 3-HD/wk patients: more females; lower urinary output, Kru and V2p; and higher NPCR, EKRc35 and stdKt/V.

Relationship between KruCp0 and KruCwb. The former was computed by dividing the product (urinary urea nitrogen concentration × urine output) by measured pre-dialysis plasma urea nitrogen (BUN Cp0); the latter was computed by dividing the same product by modelled averaged whole body urea nitrogen concentration, which is a water concentration, so that the correlation between the two values is excellent (R2 > 0.99).
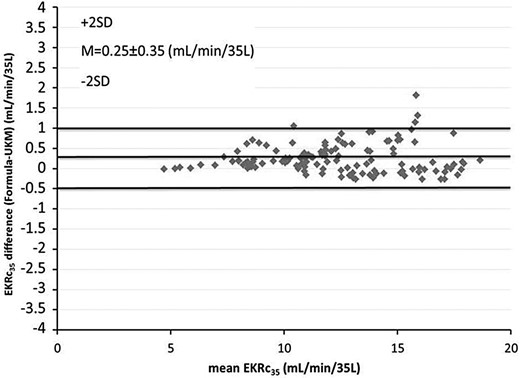
Bland–Altman plot comparing EKRc35 calculated with UKM and the predictive equations given in Figure 5.
DISCUSSION
The recent interest in incremental HD has been hindered by the current UKM-based prescription that, by overestimating the dialysis needs, even in the presence of substantial RRF, would require such high values for both the RRF and dialysis dose (Kt/V) [2, 5] that it would be difficult to prescribe less frequent treatments. This could cast doubts on the usefulness of the UKM as a guide to the prescription of incremental HD and push the search for alternative indices of dialysis adequacy [2, 5]. While agreeing that evaluating dialysis adequacy should not rely on a single index, we would like to remark on the need to keep the UKM as the gold standard, not only because it is the only established tool for assessing and prescribing dialysis [3, 4, 14], but mostly because we have to realize that it is not responsible for the overestimation of dialysis needs. The problem is not intrinsic to the UKM but rather is generated by a misunderstanding—the equivalence between Kru and Kd, correctly assumed by the UKM, only means that each mL/min of Kd clears the urea from the blood just as 1 mL/min of Kru does [2, 5, 13]. By no means should such kinetic equivalence imply that 1 mL/min of Kd is clinically equivalent to 1 mL/min of urea clearance provided by the native kidneys. The latter, in addition to a wider spectrum of solutes cleared, exert clinically important endocrinological and metabolic effects. As a logical consequence, here we suggest that a variable target is more rational than a fixed one, because it correctly gives more clinical importance to the RRF. We have selected EKRc to test our VTM hypothesis because such an index has the same units as Kru [7]. However, we have explored the possibility of using a variable target also for stdKt/V, for which the relationship with Kru is more complex. For clarity, it would be useful to deepen the discussion about the rationale for quantifying the renal clearance with respect to the dialysis clearance in the context of an incremental dialysis strategy. Thus, to calculate the amount of dialysis required to compensate for RRF losses, it is necessary either to transform RRF into Kt/V units or viceversa, to transform Kt/V into ECC units, so that the two components can be summed up [7]. The approach based on ECC is the current one, essentially because it can be used with all dialysis schedules [7]. However, there is no consensus on the specific ECC to be used. In fact, there are two different indices, namely EKRc computed from the G/TAC ratio [4, 7] and stdKt/V computed from the G/PAC ratio [6, 8], replacing TAC with PAC. Gotch suggested using PAC to give more importance to the BUN peak versus TAC, and at same time to ‘compress’ the HD clearance to result in equivalent weekly clearances for HD and PD [6, 20]. At that time, a weekly Kt/V of 2.0 was the adequate dialysis dose on PD, and this was the stdKt/V value corresponding to an adequate Kt/V of 1.2 on a 3-HD/wk schedule [6]. This seemed to unify the adequacy criterion for both HD and PD [6, 20]. However, it was realized later that a weekly clearance of 1.7 would suffice on PD [10]. A recent alternative hypothesis to justify the ‘compression’ of the clearance induced by stdKt/VGotch has been suggested by Depner and Bhat [2,1]; this could mimic the behaviour of sequestered small-molecular-weight solutes, which would have a high post-dialysis rebound, and thus a TAC value more similar to PAC [20, 2,1]. More recently, however, Daugirdas et al. [8] recognized that, in any case, the ‘compression’ of Kru associated with stdKt/VGotch is going in the wrong direction, because Kru should logically be added at 100% strength to the weekly clearance, as EKR is. On this basis, the KDOQI 2015 update recommends computing a ‘dialysis-associated’ stdKt/V and then adding back Kru on a 1:1 basis, eliminating the 30% compression of Kru [3]. We have called it ‘stdKt/VDaug’ and compared it with EKRc35. However, we also computed stdKt/VGotch to extend the comparison to the three ECCs. Almost unexpectedly, we found that stdKt/VGotch with the VTM produces similar results to those of stdKt/VDaug with the FTM, and both results are also very similar to the ones associated with EKRc35 using the VTM (Figure 4). This means that our hypothesis of a variable target and the addition of Kru at 100% to the ‘dialysis-associated’ stdKt/V could be viewed as two sides of the same coin—both increase the weight of Kru by about the same magnitude. Figure 4B summarizes the main results of our study and could represent the key graph for the prescription of incremental HD. In short, for a 3-HD/wk schedule, one could equally use either EKRc35 with the VTM or stdKt/VDaug with the FTM. The same could apply to a 2-HD/wk schedule, although using stdKt/VDaug would require a slightly higher eKt/V. For a 1-HD/wk schedule, only EKRc35 with the VTM could be used.
The results of Study A (simulation study) were confirmed by Study B (clinical study). It shows that, whereas the fixed target was largely attained only in patients on a 3-HD/wk schedule, the variable target was attained in the great majority of patients on 1-HD/wk and 2-HD/wk schedules, particularly with reference to EKRc35.
In agreement with recent literature data [22–25], we would also like to point out that starting HD with an incremental approach could help to preserve RRF and thus increase the time period on a less frequent treatment schedule. Old beliefs still remain that, in contrast to PD, RRF should inevitably abate soon after starting HD [26, 27]. However, recent data have shown that RRF could be better preserved by improving dialysate purity [28], dialysis membrane biocompatibility [29, 30] and overall dialysis biocompatibility, such that an identical decline of RRF in high-flux biocompatible HD and continuous ambulatory PD has been demonstrated [31]. With recent evidence that a frequent treatment schedule can increase the loss of RRF [3,2], it is straightforward to infer that a less frequent treatment schedule could help to preserve RRF [3,3]. Results from many observational studies of patients on a 2-HD/wk schedule are in agreement with the above hypothesis [22, 24, 25]. Furthermore, our own data [19] extend the latter hypothesis, showing that a 1-HD/wk schedule seems to preserve RRF better than a 2-HD/wk schedule.
Finally, our long-term experience in the field allows us to give some practical advice. The current target of 2.3 v/wk of the current stdKt/V would already allow a wider use of the twice-weekly HD schedule. Clearly, the Kru and urinary volume, as well as the metabolic and clinical conditions, should be assessed with increased frequency. In particular, the daily urinary volume should be at least 500 mL/day [33]. Furthermore, since the targets are about 10–15% higher than the minimum required values, there is no need to aim at ECC values higher than the target. Our empirical observations are in agreement with some recent literature data, showing that an excessive amount of dialysis could lead to a faster loss of RRF [21]. This should be kept in mind when we are faced with a patient with elevated BUN levels who has to start dialysis; some sort of conditioned reflex leads many clinicians to start with an intensive dialysis programme, which could cause an irreversible reduction of kidney function, just as an aggressive ultrafiltration could do.
However, the crucial point still remains unresolved, and a randomized controlled trial comparing incremental HD with the 3-HD/wk schedule and focused on hard outcomes, such as survival and quality of life, is urgently needed. It is hard to believe that the 3-HD/wk schedule, which is considered as ‘the standard of care’, has been widely accepted worldwide without having ever been studied in a randomized controlled trial.
In conclusion, a paradigm shift from the FTM to the VTM in the prescription of incremental HD is proposed, whereby the VTM would allow less frequent treatments at lower Kru, with important clinical and financial implications. The new criteria, in agreement with our long-standing clinical experience in the field of incremental HD, suggest that, at least in relatively healthy patients, HD can be started at Krc35 of ∼5 mL/min/35 L on a 1-HD/wk schedule; this can be maintained until Krc35 falls below 4 mL/min/35 L, at which point the treatment schedule should be changed to a 2-HD/wk schedule that, in turn, could be maintained until Krc35 falls below 2 mL/min/35 L, when the 3-HD/wk schedule becomes really necessary. This approach is likely to be safe, being in agreement with many observational data in the literature, as well as with the recent KDOQI endorsement of the addition of Kru at 100% to the dialysis stdKt/V [3]. However, this needs to be confirmed by randomized controlled trials.
SUPPLEMENTARY DATA
Supplementary data are available online at http://ndt.oxfordjournals.org.
ACKNOWLEDGEMENTS
The valuable help of Dr Pasquale Libutti, Division of Nephrology, Miulli General Hospital, Acquaviva delle Fonti, Italy, in the preparation of the manuscript is acknowledged.
CONFLICT OF INTEREST STATEMENT
None declared.


Comments