


Background. Compared to high-flux dialysis membranes, novel medium cut-off (MCO) membranes show greater permeability for larger middle molecules.
Methods. In two prospective, open-label, controlled, randomized, crossover pilot studies, 39 prevalent hemodialysis (HD) patients were studied in four dialysis treatments as follows: study 1, three MCO prototype dialyzers (AA, BB and CC with increasing permeability) and one high-flux dialyzer in HD; and study 2, two MCO prototype dialyzers (AA and BB) in HD and high-flux dialyzers in HD and hemodiafiltration (HDF). Primary outcome was lambda free light chain (λFLC) overall clearance. Secondary outcomes included overall clearances and pre-to-post-reduction ratios of middle and small molecules, and safety of MCO HD treatments.
Results. MCO HD provided greater λFLC overall clearance [least square mean (standard error)] as follows: study 1: MCO AA 8.5 (0.54), MCO BB 11.3 (0.51), MCO CC 15.0 (0.53) versus high-flux HD 3.6 (0.51) mL/min; study 2: MCO AA 10.0 (0.58), MCO BB 12.5 (0.57) versus high-flux HD 4.4 (0.57) and HDF 6.2 (0.58) mL/min. Differences between MCO and high-flux dialyzers were consistently significant in mixed model analysis (each P < 0.001). Reduction ratios of λFLC were greater for MCO. Clearances of α1-microglobulin, complement factor D, kappa FLC (κFLC) and myoglobin were generally greater with MCO than with high-flux HD and similar to or greater than clearances with HDF. Albumin loss was moderate with MCO, but greater than with high-flux HD and HDF.
Conclusions. MCO HD removes a wide range of middle molecules more effectively than high-flux HD and even exceeds the performance of high-volume HDF for large solutes, particularly λFLC.
INTRODUCTION
End-stage renal disease (ESRD) results in the retention of uremic toxins, which is associated with high mortality [1]. Uremic toxins are classified into small (<500 Da) and middle-molecular (500 Da–60 kDa) water-soluble solutes and protein-bound substances [1, 2]. While conventional hemodialysis (HD) modalities remove small solutes and smaller-sized middle molecules, clearance of larger middle molecules and protein-bound substances is poor [3].
Studies have associated middle molecules to pathological features of uremia, such as immune dysfunction and inflammation, as well as adverse outcomes in dialysis patients [4–8]. Free immunoglobulin light chains (FLCs) have a molecular weight of ∼22.5 and 45 kDa for kappa FLC (κFLC) and lambda FLC (λFLC), respectively. Importantly, FLC levels have been associated with mortality in chronic kidney disease (CKD) cohorts [9–11]. They can be considered larger middle molecules, insignificantly removed by HD [4].
Thus, efforts have focused on improving the clearance of larger middle molecules in dialysis. The introduction of more water-permeable high-flux membranes allowed the clearance of middle molecules such as β2-microglobulin [12, 13], and increasing convection with hemodiafiltration (HDF) considerably enhanced middle molecule clearance [14]. However, high-flux dialyzers have cut-off values of ∼20 kDa [15] and are thus limited in their ability to remove larger middle molecules, including κFLC and λFLC which have molecular sizes exceeding this threshold. Maintenance HD patients who are at high mortality risk seem to benefit from high-flux HD [16–18]. However, large outcome trials comparing HDF to HD have yielded equivocal results [19], with some secondary and retrospective analyses suggesting large convection volumes, which correlate with enhanced removal of middle molecules, result in more favorable outcomes [20–22]. This is, however, subject to a possibly large degree of bias, since healthier patients with better vascular access are likely to achieve better outcomes.
Medium cut-off (MCO) dialyzers utilize a novel class of membranes designed to increase the removal of larger middle molecules in HD [15] and, in contrast to more permeable high cut-off (HCO) membranes, are intended for routine use in maintenance HD patients. In the present two pilot studies, the performance of three prototypes of MCO dialyzers differing in membrane pore size were compared to HD and high-volume HDF using contemporary high-flux dialyzers. The particular focus was on the clearance of larger middle molecules, including κFLC and λFLC.
MATERIALS AND METHODS
Study design
In two prospective, open-label, 4-arm, randomized, active-control, crossover pilot studies, Theranova 400 dialyzer (MCO AA; Gambro Dialysatoren GmbH, Hechingen, Germany, a subsidiary of Baxter International Inc.) and two MCO dialyzer prototypes (MCO BB and CC) used in HD were compared in single, consecutive mid-week treatments to high-flux dialyzers used in HD (FX CorDiax 80; Fresenius Medical Care Deutschland, Bad Homburg, Germany; studies 1 and 2) and high-volume HDF (FX CorDiax 800; Fresenius Medical Care Deutschland, Bad Homburg, Germany; study 2) in a randomly assigned order, respectively. The MCO dialyzer membranes had increasing membrane permeability, i.e. AA < BB < CC [15]. Dialyzer membrane characteristics are described in Table 1. Our choice to compare to FX CorDiax dialyzers was based on their wide use in Europe and reports indicating they achieve significantly greater middle molecule removal than other high-flux dialyzers [23].
Characteristics of dialysis membranes in study dialyzers
| Lot no. | Inner diameter (µm) | Wall thickness (µm) | Membrane polymera | Effective surface areaa (m2) | UF coefficienta (mL/h/mmHg) | |
|---|---|---|---|---|---|---|
| MCO AA | 4–806 | 180 ± 2 | 36 ± 1 | Polyarylethersulfone-PVP blend | 1.7 | 48 |
| MCO BB | 4–807 | 180 ± 2 | 35 ± 1 | Polyarylethersulfone-PVP blend | 1.7 | 52 |
| MCO CC | 4–808 | 180 ± 2 | 35 ± 1 | Polyarylethersulfone-PVP blend | 1.7 | 49 |
| FX CorDiax 80 | VKU07200 | 175 ± 3 | 38 ± 2 | Polysulfone-PVP blend | 1.8 | 64 |
| FX CorDiax 800 | VIF15100 | 199 ± 3 | 44 ± 2 | Polysulfone-PVP blend | 2.0 | 62 |
Mean ± SD.
aAccording to manufacturer's instruction for use.
PVP, polyvinylpyrrolidone; UF, ultrafiltration.
Study 1 was performed in the dialysis units of the Medical University of Graz and the Hospital Hochsteiermark/Bruck/Mur, both in Austria. Study 2 was performed in the Dialysis Center Elsenfeld in Germany. The studies were conducted according to the Declaration of Helsinki and were approved by local ethics committees and competent authorities. Both studies are registered at clinicaltrials.gov (study 1: NCT02377570; study 2: NCT02377622).
In study 1, the dialysis sessions were 4 h long, with a dialysate flow (QD) of 500 mL/min and a blood flow (QB) of 300 ± 20 mL/min. In study 2, the dialysis sessions were 4–5 h long, with a QB of 400 ± 50 mL/min. The HDF sessions were performed in post-dilution volume-controlled mode, with a target total convective ultrafiltration volume of ≥23 L and the QD set at 700 mL/min. Since in online HDF, the effective QD is reduced by the reinfusion rate, a QD of 600 mL/min was used for the three HD sessions in study 2. In both studies, the ultrafiltration flow rate was adjusted to reach dry weight.
At all study centers, the dialysis treatments were otherwise based on current prescription and study protocol requirements. Throughout the duration of the patients' participation in the study, any individual anticoagulant treatment was continued as previously prescribed.
Patients
Inclusion and exclusion criteria are provided at clinicaltrials.gov. Patients were ≥18 years of age and were on either HD or HDF treatment for ≥3 months before enrollment, and had a κFLC/λFLC ratio of >0.37 and <3.1 and no history of monoclonal gammopathy. All patients provided written informed consent.
Samplings, analyses and calculations
Briefly, serum, plasma and spent dialysate samples were collected and sent to a central laboratory under standardized conditions. See Supplementary methods for detailed description of sampling and analysis.
Randomization
Every patient received each study dialyzer treatment in randomized order, which was assigned by a central computer-based randomization in the form of Williams design sequences.
Outcomes
The primary outcome was the λFLC Kovr of the MCO dialyzer prototypes used in HD mode, compared to high-flux dialyzers used in HD and HDF. Secondary outcomes were the clearance of other middle molecules and small molecules, as well as safety (albumin removal and treatment tolerance) of MCO HD.
Statistical analyses
Analyses were performed using SAS statistical analysis software [SAS, SAS/GRAPH, SAS/STAT; version 9.2 of SAS for Windows (SAS Institute Inc, Cary, NC, USA)]. Treatment effects were evaluated using a two-sided significance level of 0.050.
The intent-to-treat (ITT) population included all patients who received at least one study treatment. The ITT full analysis set included all patients who received at least one MCO HD treatment and one treatment with either high-flux dialyzer. Analyses of the primary and secondary efficacy end points used the ITT full analysis set.
When a laboratory value for any of the efficacy end points or for the safety analysis of the MD of albumin was below the lower limit of detection (LLOD), an imputed value of LLOD/√2 was used.
For the primary analysis of the λFLC Kovr, the mean within-patient difference in Kovr of λFLC between HD with each MCO dialyzer prototype and either HD or HDF was analyzed using a mixed model that included fixed effects of period, study dialyzer type and the random effect of subject.
The null hypothesis was that there was no difference in the λFLC Kovr between HD with any MCO dialyzer and treatment with either high-flux dialyzer. The corresponding alternative hypothesis was that there was a difference in the Kovr.
The secondary efficacy end points were analyzed using the same mixed model.
RESULTS
Demographics and baseline and study treatment characteristics
A total of 39 patients were included in the studies: 19 in study 1 and 20 in study 2. Study 1 patients were of a mean age (± SD) of 55.4 ± 13.44 years and had been receiving HD for a mean of 4.9 ± 4.65 years. Patients in study 2 were older (65.4 ± 12.24 years) and had a mean dialysis vintage of 5.6 ± 2.43 years.
Baseline characteristics are listed in Table 2 and the treatment characteristics as administered are shown in Table 3.
Baseline characteristics of the study population
| Variable | Study 1 | Study 2 |
|---|---|---|
| Age (mean ± SD) (years) | 55.4 ± 13.44 | 65.4 ± 12.24 |
| Gender, n (%) | ||
| Male | 12 (63.2) | 16 (80) |
| Female | 7 (36.8) | 4 (20) |
| Dialysis vintage (mean ± SD) (years) | 4.9 ± 4.65 | 5.6 ± 2.43 |
| Dry weight (mean ± SD) (kg) | 87.2 ± 20.06 | 76.9 ± 18.11 |
| Vascular access, n (%) | ||
| Native AV fistula | 13 (68.4) | 20 (100) |
| Double-lumen dialysis catheter | 3 (15.8) | 0 (0) |
| PTFE graft | 3 (15.8) | 0 (0) |
| Primary renal disease, n (%) | ||
| Diabetic nephropathy | 5 (26.3) | 2 (10) |
| Hypertensive | 4 (21.1) | 8 (40) |
| Glomerulonephritis | 3 (15.8) | 3 (15) |
| Interstitial nephritis | 1 (5.3) | 1 (5) |
| Polycystic kidney disease | 1 (5.3) | 1 (5) |
| Other | 5 (26.3) | 5 (25) |
AV, arteriovenous; PTFE, polytetrafluoroethylene.
Study treatment characteristics
| Variable | Study 1 | Study 2 | ||||||
|---|---|---|---|---|---|---|---|---|
| MCO AA | MCO BB | MCO CC | High-flux HD | MCO AA | MCO BB | High-flux HD | HDF | |
| Effective dialysis time (h) | 3.8 ± 0.06 | 3.9 ± 0.03 | 3.8 ± 0.04 | 3.8 ± 0.05 | 4.4 ± 0.24 | 4.3 ± 0.45 | 4.4 ± 0.24 | 4.4 ± 0.24 |
| Actual QB at 30 min (mL/min) | 301.8 ± 21.93 | 300.2 ± 22.91 | 301.2 ± 24.36 | 300.8 ± 22.99 | 400.0 ± 0.00 | 400.0 ± 0.00 | 400.0 ± 0.00 | 400.0 ± 0.00 |
| Actual VUF (L) | 2.0 ± 0.85 | 2.4 ± 1.29 | 2.4 ± 1.08 | 2.2 ± 1.15 | 2.6 ± 1.15 | 2.6 ± 1.22 | 2.6 ± 1.18 | 2.6 ± 1.11 |
| HDF reinfusion volume (L) | Not applicable | 21.4 ± 1.11 | ||||||
| Intradialytic weight change (kg) | 1.8 ± 1.02 | 2.1 ± 1.36 | 2.2 ± 1.34 | 1.9 ± 1.34 | 2.3 ± 1.09 | 2.2 ± 1.13 | 2.2 ± 1.13 | 2.2 ± 1.10 |
Mean ± SD.
HD, hemodialysis; HDF, hemodiafiltration; MCO, medium cut-off dialyzer; QB, blood flow; VUF, actual ultrafiltration volume.
Free light chain removal during HD using medium cut-off dialyzers compared to a high-flux dialyzer
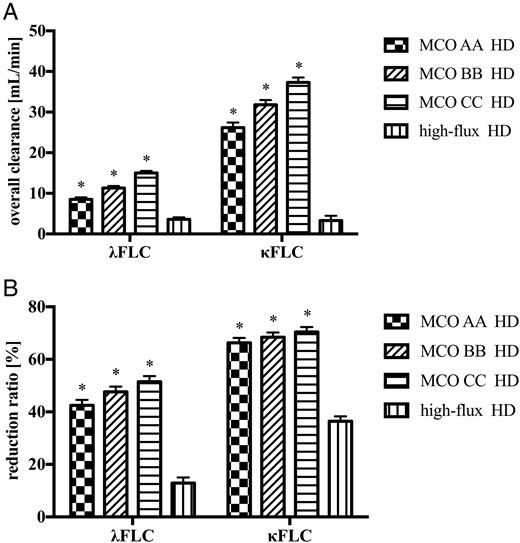
Free immunoglobulin light chain removal during hemodialysis with medium cut-off dialyzers and high-flux dialyzers in study 1. (A) Overall clearance. (B) Reduction ratio. Data are least square mean ± standard error. FLC, free light chain; MCO, medium cut-off dialyzer. *P < 0.001, compared to high-flux dialyzer.
Accordingly, HD treatments with MCO AA, BB and CC achieved significantly higher (P < 0.001) RR for λFLC [42.5 (2.06)%, 47.6 (2.06)% and 51.5 (2.10)%, respectively], compared to high-flux HD [12.9 (2.10)%]. Likewise, a significantly higher (P < 0.001) RR for κFLC was obtained with MCO AA, BB and CC [66.3 (1.85)%, 68.4 (1.85)% and 70.4 (1.88)%, respectively], compared to high-flux HD [36.4 (1.88)%] (Figure 1B).
Free light chain removal during HD using medium cut-off dialyzers compared to high-flux HD and HDF
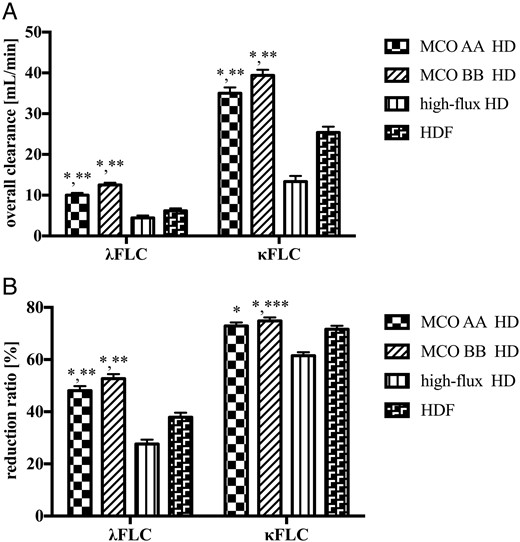
Free immunoglobulin light chain removal during hemodialysis with medium cut-off dialyzers and high-flux dialyzers and hemodiafiltration in study 2. (A) Overall clearance. (B) Reduction ratio. Data are least square mean ± standard error. FLC, free light chain; HD, hemodialysis; HDF, hemodiafiltration; MCO, medium cut-off dialyzer. *P < 0.001, compared to high-flux HD; **P < 0.001, compared to HDF; ***P = 0.01, compared to HDF.
Removal of other middle molecules during HD and HDF
In study 1, the MCO dialyzers achieved significantly higher mean Kovr of other middle molecules, such as α1-microglobulin, complement factor D (CFD), myoglobin and β2-microglobulin, compared to high-flux HD (Table 4). There was also a small, yet significant, increase in the mean phosphate (P < 0.001) and urea (P = 0.02) Kovr, whereas there was no difference in creatinine Kovr with any of the MCO dialyzers.
(A) Overall clearances and (B) reduction ratios of medium-sized and small solutes in hemodialysis treatments in study 1
| MCO AA HD | MCO BB HD | MCO CC HD | High-flux HD | |
|---|---|---|---|---|
| (A) Overall clearance (mL/min) | ||||
| α1-microglobulin | 3.8 (0.39)* | 5.2 (0.37)* | 7.0 (0.38)* | 0.1 (0.37) |
| Complement factor D | 26.5 (1.11)* | 30.4 (1.04)* | 34.6 (1.07)* | 1.8 (1.04) |
| Myoglobin | 52.0 (2.48)* | 59.3 (2.33)* | 68.1 (2.47)* | 11.9 (2.33) |
| β2-microglobulin | 67.9 (2.29)* | 71.9 (2.15)* | 75.7 (2.28)* | 26.1 (2.15) |
| Creatinine | 159.5 (3.60) | 159.9 (3.50) | 162.6 (3.54) | 157.2 (3.50) |
| Phosphate | 172.8 (4.84)* | 179.8 (4.74)* | 187.4 (4.78)* | 152.8 (4.74) |
| Urea | 216.9 (4.77)** | 216.7 (4.65)** | 217.2 (4.70)** | 208.2 (4.65) |
| (B) Reduction ratio (%) | ||||
| YKL-40 | 60.5 (1.66)* | 66.4 (1.66)* | 70.8 (1.66)* | 19.2 (1.69) |
| α1-microglobulin | 21.7 (2.42)* | 22.6 (2.42) | 29.3 (2.42)* | 7.7 (2.48) |
| Complement factor D | 56.9 (1.30)* | 61.7 (1.30)* | 64.4 (1.30)* | 16.6 (1.33) |
| Myoglobin | 63.1 (2.09)* | 67.2 (2.09)* | 68.9 (2.14)* | 8.6 (2.14) |
| β2-microglobulin | 71.5 (1.35)* | 72.0 (1.35)* | 72.1 (1.36)* | 53.0 (1.36) |
| Creatinine | 64.3 (1.31)** | 62.9 (1.31) | 63.1 (1.31) | 62.5 (1.31) |
| Phosphate | 58.8 (2.37) | 56.9 (2.37) | 57.6 (2.37) | 56.8 (2.37) |
| Urea | 71.3 (1.22)** | 70.5 (1.22) | 71.1 (1.22) | 70.1 (1.22) |
Mean ± SD.
Comparisons are based on a mixed model with fixed effects of period and study dialyzer type, and the random effect of subject.
*P < 0.001; **P < 0.05; (all versus HD).
Study 2 confirmed the findings on MCO HD versus high-flux HD. Compared to HDF, the removal of the larger-sized solutes was significantly greater with MCO HD. This was also true for Kovr of β2-microglobulin, whereas RR for β2-microglobulin was slightly lower with MCO AA, compared with HDF (Table 5).
(A) Overall clearances and (B) reduction ratios of medium-sized and small molecules in treatments in study 2
| MCO AA HD | MCO BB HD | High-flux HD | HDF | |
|---|---|---|---|---|
| (A) Overall clearance (mL/min) | ||||
| α1-microglobulin | 3.3 (0.20)* | 4.6 (0.20)* | 0.4 (0.20) | 1.3 (0.20) |
| Complement factor D | 26.3 (1.13)* | 32.8 (1.10)* | 8.2 (1.10) | 12.4 (1.10) |
| Myoglobin | 58.7 (2.46)* | 62.7 (2.39)* | 19.9 (2.39) | 35.6 (2.46) |
| β2-microglobulin | 84.7 (3.18)**,*** | 84.3 (3.10)**,*** | 55.1 (3.10) | 73.1 (3.18) |
| Creatinine | 210.4 (8.73) | 203.7 (8.31) | 208.9 (8.31) | 210.0 (8.31) |
| Phosphate | 209.8 (11.29) | 218.0 (10.71) | 193.2 (10.71) | 194.5 (10.71) |
| Urea | 281.9 (11.97) | 268.1 (11.32) | 277.0 (11.32) | 263.4 (11.32) |
| (B) Reduction ratio (%) | ||||
| YKL-40 | 63.6 (2.21)* | 68.8 (2.21)* | 29.8 (2.21) | 44.8 (2.21) |
| α1-microglobulin | 24.8 (8.97)*** | 30.1 (8.97)*** | 10.0 (8.97) | −8.9 (8.97) |
| Complement factor D | 63.0 (1.73)* | 66.7 (1.73)* | 32.9 (1.73) | 46.3 (1.73) |
| Myoglobin | 67.9 (2.34)* | 71.6 (2.34)* | 37.2 (2.34) | 59.3 (2.37) |
| β2-microglobulin | 78.5 (1.32)**,**** | 78.9 (1.32)** | 73.5 (1.32) | 80.6 (1.33) |
| Creatinine | 73.5 (1.45) | 73.2 (1.45) | 71.7 (1.45) | 73.7 (1.45) |
| Phosphate | 52.8 (2.13) | 48.8 (2.13) | 48.4 (2.13) | 51.0 (2.13) |
| Urea | 80.7 (1.33)***** | 80.3 (1.33)**** | 79.4 (1.33) | 81.6 (1.33) |
Mean ± SD.
Comparisons are based on a mixed model with fixed effects of period and study dialyzer type, and the random effect of subject.
*P < 0.001 versus HD and HDF; **P < 0.001 versus HD; ***P < 0.01 versus HDF; ****P < 0.05 versus HDF; *****P < 0.05 versus HD.
Albumin removal during medium cut-off HD
In study 1, there was a moderate, but larger, total mass of albumin removed with MCO AA [median 2.9 g (range 1.5–3.9)], BB [4.8 g (2.2–6.7)] and CC HD [7.3 g (1.9–9.7)], compared to high-flux HD [0.2 g (0.2–0.2)].
In study 2, albumin removal with MCO AA [median 3.2 g (range 1.9–3.9)] and BB HD [4.9 g (1.1–7.2)] was higher, compared to high-flux HD [0.2 g (0.2–0.3)] and HDF [0.4 g (0.3–0.8)], respectively.
Safety
Adverse events (AEs) were recorded during a 7-day period after each study treatment.
In study 1, 11 patients (58%) experienced at least one AE; a total of 23 AEs were comparably distributed between the study dialyzers. One patient withdrew from the study due to fistula thrombosis before receiving any study treatment. The only AE occurring in more than one patient was muscle cramps, which were observed in two patients (11%) during treatment with the MCO AA and CC dialyzers and the FX CorDiax 80 dialyzer, and in one patient (5%) during treatment with the MCO BB dialyzer. None of the AEs was considered possibly, or likely to be related to an investigational product and there were no serious AEs.
In study 2, 11 patients (55%) experienced at least one AE; there were a total of 31 AEs, the rate of which was again similar with the dialyzers used. One patient experiencing mild vomiting, dyspnea and nausea during his first study HD session with the MCO BB dialyzer withdrew from the study. Two serious AEs occurred in study 2, both requiring intradialytic hospitalizations (pulmonary edema and collapse not related to the study treatments). The only AEs occurring in more than one patient were headache in two (11%) patients treated with the MCO AA dialyzer and dyspnea in two (10%) patients treated with the MCO BB dialyzer. Six AEs were considered possibly, or likely to be related to an investigational product, which occurred in one patient treated with HD with the MCO BB dialyzer and one patient treated with HD with the FX CorDiax 80 dialyzer (each had three events).
There were no significant differences in pre- and post-treatment hematology parameters among the studied dialyzers in either study (data not shown).
DISCUSSION
Current HD techniques provide limited removal of large middle molecules. Even high-volume HDF, considered to be the most efficient in terms of middle molecule clearance [28], allows limited removal of solutes larger than β2-microglobulin, is not universally available and cannot be performed in all patients [29].
The results of the present two studies provide a detailed characterization of the performance of a novel class of dialysis membranes, which allows middle molecule removal that, at the very least, rivals high-volume HDF. The main objective was to compare the λFLC Kovr during MCO HD to that with high-flux dialyzers in HD and HDF. κFLC (22.5 kDa) and λFLC (45 kDa) are relatively large middle molecules that are considered uremic toxins. Higher FLC levels interfere with neutrophil function and may thus predispose to infections [4]. Also, higher λFLC levels have been associated with high mortality in patients with and without CKD [10, 30–32]. While greater clearance by HDF has been found for κFLC and, to a lesser extent, for λFLC, in comparison with high-flux HD, the pre-dialysis levels were not reduced [33, 34]. It has also been shown that certain adsorptive membranes may allow the removal of FLCs [35, 36]. Clearly, more research is needed to understand the role of FLCs in dialysis patients.
Study 1 compared HD treatments using three MCO prototypes to HD using a contemporary high-flux dialyzer. All three prototypes of the MCO dialyzer tested removed significantly more middle molecules, compared to the control treatment, across a wide molecular size range examined, as shown by higher Kovr and/or RR for β2-microglobulin (11.8 kDa), myoglobin (17 kDa), κFLC (22.5 kDa), CFD (24 kDa), α1-microglobulin (33 kDa), YKL-40 (40 kDa) and λFLC (45 kDa). Importantly, HD using the most restrictive of the MCO dialyzer prototypes tested resulted in increased λFLC removal, which was the primary outcome of this study. This was shown by a >2-fold increase in mean λFLC Kovr and a >3-fold increase in λFLC RR. Thus, at a QB of 300 mL/min, the MCO membrane allowed significantly greater middle molecule removal, compared to high-flux HD, without the prerequisites for high-efficiency HDF such as the online production of substitution fluid and high QB.
Increased filtration in modern high-flux membranes considerably increases the removal of smaller middle molecules, compared to conventional membranes [16]. HDF further improves middle molecule removal, compared to HD, using current high-flux membranes [20]. Recently, HDF using large convective volumes has been speculated to lead to improved outcomes in maintenance dialysis patients [21]. Some retrospective data and secondary analyses suggest a dose-dependent effect of middle molecule removal, since favorable outcomes were reported from studies using large convective volumes [20, 21]. A recent retrospective study in incident dialysis patients found an inverse relationship between convective volume (i.e. enhanced middle molecule removal) and mortality; however, these observations may be biased [37].
In study 2, HD treatments with the MCO AA and BB prototypes were compared to high-flux HD and high-volume HDF with a set total convective volume of 24 L at a QB of 400 mL/min. Again, both MCO dialyzers removed κFLC and λFLC more efficiently than high-flux HD and HDF. MCO AA and BB HD also achieved significantly greater Kovr and RR for other larger middle molecules such as α1-microglobulin, CFD and myoglobin. A slightly higher RR for β2-microglobulin was achieved with HDF, underlining that MCO HD more efficiently removes larger middle molecules in particular.
Increasing pore sizes, while permitting clearance of larger uremic toxins, bears the trade-off of the leaking of larger molecules such as albumin [38]. Excessive albumin loss can lower serum albumin levels in maintenance dialysis patients and is a theoretical limitation to the long-term use of highly permeable dialyzers [39].
During HD with the MCO dialyzer prototypes AA, BB and CC in study 1, there was a median loss of albumin of 2.9, 4.8 and 7.3 g per treatment session, respectively. In spite of these differences in albumin loss among the individual MCO dialyzers, the tightest membrane in the MCO AA dialyzer already achieved significantly improved FLC clearance, compared to both high-flux HD and high-volume HDF. Also, the albumin loss obtained with the MCO AA dialyzer was within the range observed in HDF treatment with high-flux dialyzers [40, 41], below transperitoneal albumin losses seen in peritoneal dialysis [42, 43] and less than a third of what has been reported for HD with HCO membranes [44]. Continuous 2-week treatment with HCO HD has been shown to lead to a modest decrease in serum albumin, without clinical symptoms of hypoalbuminemia, and a concomitant rise in serum cholinesterase activity, indicating increased hepatic albumin synthesis [44]. Whether long-term treatment with MCO HD has any clinically significant effect on serum albumin levels will have to be examined in future studies. However, the MCO AA dialyzer may be considered to have the most attractive benefit–risk profile of the MCO dialyzers studied, although its long-term effects on serum albumin clearly require further study. Based on these data, it is reasonable to speculate that MCO HD, which may remove larger solutes not only convectively by internal filtration, but also considerably by diffusion [45], may expand the benefits of high-efficiency HDF to a larger number of patients. It even allows the removal of larger uremic toxins not previously targeted by current maintenance HD technology.
Besides the novel membranes studied here, the presented data provide for the first time a unique characterization of HD membrane clearance for an extensive size range of middle molecules of between 11.6 and 45 kDa. The albumin loss during high-flux HD and HDF in this study was lower than in some previous reports [41, 46]. However, it should be pointed out that these studies were conducted using different less tight membranes, compared to the ones present in the control dialyzers used in this study.
Dialysis fluid quality is a potential safety concern when using more permeable membranes. However, experimental data indicate that adsorption is the main mechanism for retention of bacterial products to synthetic membrane materials [47] and in vitro data indicate that, for polyarylethersulfone (PAES)/polyvinylpyrrolidone (PVP) membranes, permeability is not a decisive factor for endotoxin retention [48].
A limitation of our study is that the Kovr only includes transmembrane removal and does not take into account any potential adsorption to the membrane. However, as conclusions drawn from the RR of middle molecules are very similar to those from Kovr measurements, adsorption of middle molecules to the studied membranes does not appear to be a major contributor to their overall removal. Other limitations are that this study design was confined to only one single treatment with each dialyzer for each patient and the study did not examine the long-term effects of such membranes on serum levels of middle molecules and albumin.
CONCLUSION
MCO HD removes a wide range of middle molecules more effectively than high-flux HD, with the trade-off of increased albumin removal, compared to high-flux HD and HDF. MCO HD also exceeds the performance of high-volume HDF for larger middle molecules, particularly λFLC. Importantly, MCO HD can be applied to maintenance HD patients, in whom high-volume HDF may not be used or is not available. Future studies should assess whether the performance of MCO HD improves outcomes.
SUPPLEMENTARY DATA
Supplementary methods are available online at http://ndt.oxfordjournals.org.
ACKNOWLEDGEMENTS
Studies were sponsored by Baxter.
CONFLICT OF INTEREST STATEMENT
A.H.K. has received travel support from Baxter. L.G.N., W.B. and M.A. are employees of Baxter. A.R.R. has received travel support and speaker's fee from Baxter. The results presented in this paper have not been published previously in whole or part, except in abstract format.
REFERENCES


Comments