


Abstract
Recent data suggest a role for fibroblast growth factor 23 (FGF-23) in volume regulation. In haemodialysis patients, a large ultrafiltration volume (UFV) reflects poor volume control, and both FGF-23 and a large UFV are risk factors for mortality in this population. We studied the association between FGF-23 and markers of volume status including UFV, as well as the intradialytic course of FGF-23, in a cohort of haemodialysis patients.
We carried out observational, post hoc analysis of 109 prevalent haemodialysis patients who underwent a standardized, low-flux, haemodialysis session with constant ultrafiltration rate. We measured UFV, plasma copeptin and echocardiographic parameters including cardiac output, end-diastolic volume and left ventricular mass index at the onset of the haemodialysis session. We measured the intradialytic course of plasma C-terminal FGF-23 (corrected for haemoconcentration) and serum phosphate levels at 0, 1, 3 and 4 h after onset of haemodialysis and analysed changes with linear mixed effect model.
Median age was 66 (interquartile range: 51–75) years, 65% were male with a weekly Kt/V 4.3 ± 0.7 and dialysis vintage of 25.4 (8.5–52.5) months. In univariable analysis, pre-dialysis plasma FGF-23 was associated with UFV, end-diastolic volume, cardiac output, early diastolic velocity e′ and plasma copeptin. In multivariable regression analysis, UFV correlated with FGF-23 (standardized β: 0.373, P < 0.001, model R2: 57%), independent of serum calcium and phosphate. The association between FGF-23 and echocardiographic volume markers was lost for all but cardiac output upon adjustment for UFV. Overall, FGF-23 levels did not change during dialysis [7627 (3300–13 514) to 7503 (3109–14 433) RU/mL; P = 0.98], whereas phosphate decreased (1.71 ± 0.50 to 0.88 ± 0.26 mmol/L; P < 0.001).
FGF-23 was associated with volume status in haemodialysis patients. The strong association with UFV suggests that optimization of volume status, for example by more intensive haemodialysis regimens, may also benefit mineral homeostasis. A single dialysis session did not lower FGF-23 levels.
INTRODUCTION
End-stage renal disease (ESRD) is characterized by profound abnormalities in mineral metabolism parameters including phosphate, calcium and the phosphate-regulating hormone fibroblast growth factor 23 (FGF-23). FGF-23 levels increase exponentially during the course of chronic kidney disease (CKD) to reach extremely high levels in haemodialysis [1]. Higher circulating levels of FGF-23 have been linked to an increased risk of mortality in both CKD [2, 3] and haemodialysis patients [4, 5]. Furthermore, high FGF-23 levels are associated with an increased risk of cardiovascular events, and particularly with cardiovascular complications related to volume overload, such as congestive heart failure [6]. FGF-23 emerged as a robust predictor for adverse outcome, suggesting that FGF-23 is not merely a biomarker but also exerts direct pathophysiological effects. Indeed, preclinical studies demonstrated that FGF-23 induces left ventricular hypertrophy in mice [7], although in rats neither high FGF-23 levels nor treatment with FGF-23 antibodies changed the minimal incidence of left ventricular hypertrophy compared with controls [8]. FGF-23 also did not correlate with ventricular hypertrophy in the participants of the Heart and Soul Study [9]. Another putative pathophysiological effect of FGF-23 is that it may directly stimulate tubular sodium transport to promote sodium retention [10]. Thus, it is of utmost importance to identify determinants of FGF-23 in haemodialysis patients and explore possible modes of intervention.
Renal function is a major determinant of FGF-23. Previous studies in haemodialysis patients revealed that the presence of residual renal function (RRF) is associated with FGF-23 independent of serum phosphate and calcium levels, and that anuric patients display higher FGF-23 levels than patients with residual diuresis [11, 12]. Haemodialysis patients requiring a higher ultrafiltration volume (UFV) have an increased mortality risk [13, 14]. FGF-23 is also associated with parameters of volume overload such as NT-proBNP and the vasopressin precursor copeptin, independent of renal function [15], in line with a potential link between FGF-23 and volume status. Therefore, in the current study, we aimed to assess whether UFV is an independent determinant of FGF-23, among other parameters of volume homeostasis.
Despite the accumulating evidence supporting the association between a high FGF-23 level and adverse cardiorenal outcomes in all stages of CKD, few solid data exist on the effects of low-flux haemodialysis treatment itself on FGF-23 levels. Haemodialysis lowers serum phosphate levels markedly. As serum phosphate and FGF-23 levels are strongly correlated, an intradialytic effect on FGF-23 levels might be expected, and was suggested by a preliminary study [16], even when FGF-23 is probably not dialysed due to its size. Therefore, we also investigated the intradialytic change in FGF-23 levels.
MATERIALS AND METHODS
Study design and measurements
We performed an observational study in a haemodialysis cohort recruited at the Dialysis Center Groningen and the University Medical Center Groningen. The protocol has been described previously [17]. In short, patients who underwent thrice-weekly haemodialysis for >3 months were eligible. Patients with severe heart failure (NYHA class IV) were excluded from participation. All measurements took place at the end of the longest interdialytic interval. Patients underwent a bicarbonate low-flux haemodialysis session with polysulfone hollow-fibre dialyser (F8; Fresenius Car, Bad Homburg, Germany). Blood and dialysate flows were 250–350 and 500 mL/min, respectively, with constant ultrafiltration rate. The dialysate bath consisted of 139 mmol/L sodium, 1.0 or 2.0 mmol/L potassium, calcium (1.5 mmol/L), magnesium (0.5 mmol/L), bicarbonate (34 mmol/L), acetate (3.0 mmol/L) and glucose (1.0 g/L). Blood samples were obtained at the start of dialysis, 1 h, 3 h and at the end of a regular 4-h haemodialysis session. Dialysate was obtained 30 min after the onset of the dialysis session. The study was performed in accordance to the Declaration of Helsinki and approved by the Medical Ethical Committee of the University Medical Center Groningen. The study took place between March 2009 and March 2010.
Clinical and laboratory measurements
Haematocrit and electrolytes (sodium, calcium, phosphate, total calcium and ionized calcium) were measured by routine laboratory procedures. We measured plasma FGF-23 with human FGF-23 (C-terminal) enzyme-linked immunosorbent assay (ELISA; Immutopics, Inc., San Clemente, CA, USA) in stored plasma samples. The concentration of plasma FGF-23 was corrected for haemoconcentration or -dilution according to Schneditz et al. [18]. In a subset of patients, FGF-23 was measured in the dialysate. Plasma copeptin was measured using a sandwich immunoassay (B.R.A.H.M.S GmbH/Thermo Fisher Scientific, Hennigsdorf/Berlin, Germany). Pro-A-type natriuretic peptide (ProANP) was measured using an automated sandwich immunoassay (MR-ProANP KRYPTOR, B.R.A.H.M.S. GmbH). Blood pressure was measured at all four time points. All patients underwent echocardiography 30 min before start of the haemodialysis session aimed at assessing cardiac function in general and development of ventricular systolic dysfunction in particular. Three experienced technicians performed the echocardiography, and one experienced technician performed all analyses offline [17]. Data on RRF (≥1 mL/min) and residual diuresis (defined as ≥200 mL/day) were extracted from patient records. RRF was calculated from a 24-hourly collection together with blood sampling using urinary and serum creatinine values: RRF = [(urinary creatinine excretion/serum creatinine)/1440].
Statistical analysis
Analyses were performed using SPSS version 22.0 for Windows (IBM Corporation, Chicago, IL, USA) and GraphPad Prism, version 5.01 (GraphPad Software Inc.). Data are reported as mean ± standard deviation for normally distributed data and median (interquartile range) for non-normally distributed data. Nominal data are presented as the total number of patients with percentage [n (%)]. A two-sided P-value <0.05 was considered to be statistically significant.
We used uni- and multivariable linear regression analyses to identify determinants of natural logarithmic transformed (Ln) plasma FGF-23 levels at the start of the haemodialysis session. In univariable regression analysis, we first studied known determinants of FGF-23 [serum phosphate, serum calcium, (serum) calcium–phosphate product (only univariable analysis) age and RRF—defined as creatinine clearance ≥1 mL/min]; putative determinants such as Kt/V for dialysis efficacy; UFV, plasma sodium, copeptin, systolic and diastolic blood pressure as proxies for volume status; ionized calcium as it may perform better than serum calcium; and gender and body mass index as possible confounders. We constructed a multivariable model with UFV as independent covariate and other significant contributing determinants of the univariable analysis, thus adjusting for known determinants of FGF-23 (calcium and phosphate levels). We aimed to construct the optimal model using as few variables as possible. Non-normally distributed variables were Ln-transformed when necessary to meet the assumptions of linear regression. We report standardized regression coefficients. We tested for effect modifications by invoking multiplicative interaction terms. As volume homeostasis may influence cardiac structural and functional parameters, we further investigated the correlation of FGF-23 with these parameters in a novel model. We investigated echocardiography parameters [cardiac output, stroke volume, heart rate, end-diastolic volume, end-systolic volume, left ventricular mass index (LVMI), ejection fraction (biplane Simpson's method), tricuspid annular plane systolic excursion (TAPSE) and tissue Doppler early diastolic velocity (mean e′)] and proANP in addition to UFV and copeptin in uni- and multivariable linear regression analysis. Changes in blood pressure and concentrations of FGF-23, copeptin, total and ionized calcium, phosphate and sodium before and after dialysis were analysed with paired t-tests, after Ln transformation when appropriate. The course of FGF-23 and phosphate during the haemodialysis session was analysed with a linear mixed effect model. We calculated the change in relative blood volume (RBV) using haematocrit (Ht) values: RBV (%) = (Ht before/Ht after dialysis session) − 1 × 100%. The correlation of changes in FGF-23 and phosphate or RBV was tested with Pearson's correlation test.
RESULTS
The 109 haemodialysis patients in our cohort were 66 (51–75) years old, had a dialysis vintage of 25.4 (8.5–52.5) months and weekly Kt/V of 4.3 ± 0.7. The mean UFV during the haemodialysis session was 2553 ± 777 mL. As shown in Table 1, before the onset of the haemodialysis session, patients had a mildly elevated blood pressure (systolic: 140 ± 23 mmHg and diastolic: 79 ± 15 mmHg), had high plasma copeptin levels, were hyperphosphataemic and displayed very high FGF-23 levels, as expected. Most patients used antihypertensive and calcium/phosphate-related treatments and had a mildly reduced systolic cardiac function as reflected by cardiac output and ejection fraction, and signs of diastolic dysfunction as reflected by early diastolic velocity, e′.
Baseline characteristics
| Unit | Value | Reference value | |
|---|---|---|---|
| Gender (male/female) | 71/38 | ||
| Age | Years | 66 (51–75) | |
| Dialysis vintage | Months | 25.4 (8.5–52.5) | |
| BMI | kg/m2 | 25.9 ± 4.5 | <25 |
| Systolic blood pressure | mmHg | 140 ± 23 | <140 |
| Diastolic blood pressure | mmHg | 79 ± 15 | <90 |
| FGF-23 | RU/mL | 7627 (3300–13 514) | <125 |
| Plasma sodium | mmol/L | 138 ± 3 | 132–144 |
| Serum calcium | mmol/L | 2.31 ± 0.16 | 9.0–11.0 |
| Serum phosphate | mmol/L | 1.71 ± 0.50 | 2.0–4.0 |
| Copeptin | pmol/L | 142 (91–245) | <14 |
| proANP | pmol/L | 754 (510–1080) | |
| RRF ≥1 mL/min | n (%) | 35 (32.1) | |
| Residual diuresis ≥200 mL/day | n (%) | 39 (35.8) | |
| UFV | mL | 2553 ± 777 | |
| Kt/V | 4.3 ± 0.7 | >3.6 | |
| Weight above target weight | kg | 2.4 ± 1.5 | |
| Medication use | |||
| Antihypertensivesa | n (%) | 75 (70.1) | |
| RAAS-blockade | n (%) | 23 (21.5) | |
| Diuretics | n (%) | 8 (7.5) | |
| Calcium or phosphate treatment | n (%) | 85 (79.4) | |
| Calcium-containing phosphate binders | n (%) | 45 (41.3) | |
| Echocardiographic parameters | |||
| Cardiac output | L/min | 3.6 ± 1.2 | |
| Stroke volume | mL | 52 ± 16 | |
| Heart rate | beats/min | 74 ± 14 | 60–100 |
| End-diastolic volume | mL | 106 ± 32 | |
| End-systolic volume | mL | 54 ± 22 | |
| Tricuspid annular plane systolic excursion | mm | 23 ± 5 | >17 |
| e′ tissue Doppler early diastolic velocity | cm/s | 6.6 ± 2.1 | >7.8 |
| LV mass index, males | g/m2 | 99 ± 25 | 49–115 |
| LV mass index, females | g/m2 | 84 ± 25 | 43–95 |
| LV ejection fraction (Simpson) | % | 50 ± 10 | >52 |
BMI, body mass index; FGF-23, fibroblast growth factor 23; RU/mL, relative units per millilitre; RAAS-blockade, blockade of renin–angiotensin–aldosterone system, either by angiotensin-converting enzyme inhibitors or by angiotensin receptor blockers; proANP, proatrial natriuretic peptide; LV, left ventricular.
aDefined as use of RAAS-blockade, calcium channel blockers, β blockers and/or diuretics.
Determinants of FGF-23 at the onset of the haemodialysis session
Univariable regression analyses identified serum phosphate, UFV, age and Ln copeptin as strong correlates of Ln FGF-23 levels at the onset of the haemodialysis session (Table 2). Total calcium and Kt/V were also positively associated with high FGF-23 levels. Notably, the calcium × phosphate product (Ca × Pi) correlated most strongly with Ln FGF-23 (standardized β = 0.655, P < 0.001). In multivariable regression analysis, total calcium, phosphate and UFV were independent predictors of FGF-23 levels (Table 3, Model 1). In this model, each 100 mL increase of UFV resulted in an increase of Ln-transformed FGF-23 with effect size B = 0.053 (95% confidence interval: 0.033–0.073). Thus, for every extra litre of UFV, FGF-23 levels increased by e0.53 = 170%, e.g. from 8103 to 13 766 RU/mL. Age, copeptin and Kt/V did not contribute to this model (Table 3, Model 2), nor did RRF (Model 3). We found no evidence for interaction by serum phosphate for the association between UFV and FGF-23, after introduction of the multiplicative interaction serum phosphate × UFV to a multivariable regression model with serum phosphate and UFV and Ln FGF-23 as dependent variables (Figure 1, P-interaction = 0.3). Use of ionized calcium instead of serum calcium did not materially change our findings, and ionized calcium did not correlate with FGF-23 in univariable analysis. Therefore, the correlation of (ionized) Ca × Pi product with FGF-23 appears to be driven by phosphate. FGF-23 did not differ between patients who did or did not use calcium-containing phosphate binders (P = 0.8), or use vitamin D or phosphate binders (P = 0.9).
Correlates of FGF-23 at onset of haemodialysis session
| Determinant | Standardized β | P-value |
|---|---|---|
| Ca × Pi | 0.655 | <0.001 |
| Serum phosphate | 0.629 | <0.001 |
| UFV | 0.579 | <0.001 |
| Age | –0.406 | <0.001 |
| Ln copeptin | 0.269 | 0.005 |
| Kt/V | –0.224 | 0.023 |
| Serum calcium | 0.201 | 0.037 |
| Diastolic blood pressure | 0.148 | 0.134 |
| Gender | –0.141 | 0.145 |
| RRF ≥1 mL/min | –0.100 | 0.335 |
| BMI | 0.089 | 0.376 |
| Residual diuresis ≥200 mL/day | –0.091 | 0.376 |
| Systolic blood pressure | –0.052 | 0.602 |
| Ionized calcium | 0.032 | 0.760 |
| Dialysis vintage | –0.026 | 0.789 |
| Plasma sodium | –0.001 | 0.995 |
Univariable regression analysis of natural Ln-transformed FGF-23.
BMI, body mass index; Ca × Pi, calcium × phosphate product; UFV, ultrafiltration volume; RRF, residual renal function; FGF-23, fibroblast growth factor 23.
Multivariable linear regression analysis: determinants of FGF-23 levels at onset of dialysis session
| Model | Determinant | Standardized β | P-value | R2 |
|---|---|---|---|---|
| 1 | Phosphate | 0.484 | <0.001 | 0.57 |
| Calcium | 0.247 | <0.001 | ||
| UFV | 0.373 | <0.001 | ||
| 2 | Phosphate | 0.480 | <0.001 | 0.58 |
| Calcium | 0.234 | <0.001 | ||
| UFV | 0.352 | <0.001 | ||
| Age | –0.063 | 0.4 | ||
| Copeptin | 0.076 | 0.3 | ||
| Kt/V | 0.043 | 0.5 | ||
| 3 | Phosphate | 0.520 | <0.001 | 0.62 |
| Calcium | 0.253 | <0.001 | ||
| UFV | 0.343 | <0.001 | ||
| RRF ≥1 mL/min | –0.091 | 0.2 |
Model 1 is the optimal regression model that used least determinants to predict most of the variations in FGF-23 levels. Model 2 assessed the effect of all significant correlates from the univariable analysis. Model 3 assessed whether RRF may attenuate the results.
FGF-23, natural log-transformed fibroblast growth factor 23; Standardized β, standardized coefficient; UFV, ultrafiltration volume; RRF, residual renal function.
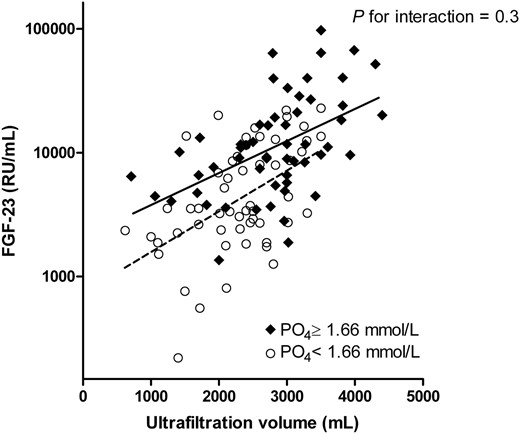
Both in patients with phosphate levels below and above median, UFV correlated with Ln-transformed FGF-23. Regression lines for FGF-23 and UFV are depicted per levels of serum phosphate above (continuous) and below (dashed) its median. FGF-23, fibroblast growth factor 23; PO4, phosphate.
FGF-23 correlates with echocardiographic volume parameters
We further investigated the correlation of FGF-23 with cardiac structural and functional parameters using echocardiography and the volume marker copeptin. Regarding the echocardiography parameters, FGF-23 correlated strongly with the systolic indices cardiac output, apparently driven by stroke volume in univariable analysis. FGF-23 also correlated with the diastolic indices e′ mean and end-diastolic volume (Table 4). Notably, FGF-23 was not associated with LVMI, left ventricular ejection fraction, TAPSE or proANP levels. Copeptin correlated significantly with FGF-23. In multivariable analysis, only cardiac output contributed further when UFV was included in the model. However, when we forced cardiac output into our final regression model (Table 3, Model 1), it did not contribute (standardized β = 0.085, P = 0.3).
Univariable correlates of FGF-23 at onset of dialysis session and echocardiographic and biochemical markers of volume status
| Determinant | Univariable | Multivariable | ||
|---|---|---|---|---|
| Standardized β | P-value | Standardized β | P-value | |
| UFV | 0.579 | <0.001 | 0.462 | <0.001 |
| Cardiac output | 0.389 | <0.001 | 0.279 | 0.02 |
| Stroke volume | 0.345 | 0.001 | ||
| Heart rate | 0.097 | 0.3 | ||
| ProAVP (copeptin) | 0.269 | 0.005 | 0.105 | 0.3 |
| End-diastolic volume | 0.286 | 0.007 | ||
| e′ mean | 0.228 | 0.02 | 0.004 | 0.9 |
| End-systolic volume | 0.148 | 0.2 | ||
| LVMI | 0.079 | 0.5 | –0.112 | 0.4 |
| Ejection fraction (Simpson) | 0.047 | 0.7 | ||
| TAPSE | 0.027 | 0.8 | –0.111 | 0.3 |
| Ln proANP | –0.007 | 0.9 | 0.042 | 0.7 |
ProANP and FGF-23 were Ln transformed. As cardiac output is the product of stroke volume and heart rate, these factors were not included in multivariable analysis. Similarly, ejection fraction, end-diastolic and end-systolic volume were excluded due to their strong relation with cardiac output.
FGF-23, fibroblast growth factor 23; UFV, ultrafiltration volume; proAVP, provasopressin; LVMI, left ventricular mass index; TAPSE, tricuspid annular plane systolic excursion; proANP, pro-A-type natriuretic peptide.
The effect of haemodialysis on FGF-23
During the haemodialysis session, serum phosphate levels declined significantly (Figure 2, mixed linear model, P < 0.001), whereas haemodialysis treatment had no effect on FGF-23 levels (P = 0.98) and a small effect on calcium levels. Changes in serum phosphate were not correlated with changes in FGF-23 at any of the time points (correlation of changes after 60 min R = –0.076, P = 0.5; after 180 min R = –0.025, P = 0.8; after end of dialysis R = –0.096, P = 0.4). We could not detect FGF-23 in the dialysate in any patient when analysing a subgroup of 10 haemodialysis patients, supporting the observation that FGF-23 was not cleared by haemodialysis. Changes in serum or ionized calcium, both of which increased during haemodialysis (Table 5), did not correlate with changes in FGF-23. In order to more closely delineate the effects of individual volume changes during the haemodialysis session on FGF-23 levels, we did find that the change in FGF-23 correlated positively with the change in RBV (Figure 3): patients with a more pronounced reduction in blood volume had also a more pronounced reduction of FGF-23 levels, whereas patients whose blood volume increased demonstrated an increase in FGF-23 levels.
Parameters during haemodialysis
| Unit | At start haemodialysis | At end haemodialysis | P-value | |
|---|---|---|---|---|
| Systolic blood pressure | mmHg | 140 ± 23 | 132 ± 26 | <0.001 |
| Diastolic blood pressure | mmHg | 79 ± 15 | 73 ± 14 | <0.001 |
| FGF-23 | RU/mL | 7627 (3300–13 514) | 7503 (3109–14 433) | 0.2 |
| Plasma sodium | mmol/L | 138 ± 3 | 139 ± 2 | 0.03 |
| Serum calcium | mmol/L | 2.31 ± 0.16 | 2.49 ± 0.13 | <0.001 |
| Ionized calcium | mmol/L | 1.21 ± 0.09 | 1.25 ± 0.05 | <0.001 |
| Serum phosphate | mmol/L | 1.71 ± 0.50 | 0.88 ± 0.26 | <0.001 |
| Copeptin | pmol/L | 142 (91–245) | 164 (98–292) | <0.001 |
The course of clinical and biochemical parameters during haemodialysis. FGF-23 and copeptin were Ln-transformed before t-test.
FGF-23, fibroblast growth factor 23; RU/mL, relative units per millilitre.

The mean change of FGF-23, serum phosphate and serum calcium (with standard deviation) at the different time points during one haemodialysis session. P-value reflects linear mixed effect model for the course of the variables. FGF-23, fibroblast growth factor 23.
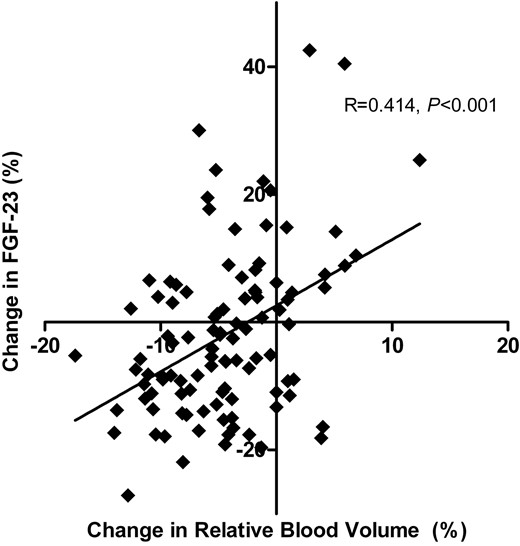
The relative change of blood volume during one haemodialysis session correlated with the change in FGF-23 levels. Pearson's correlation coefficient R and its P-value are reported. One outlying observation was excluded (change RBV −6%, FGF-23 +138%). FGF-23, fibroblast growth factor 23.
DISCUSSION
FGF-23 has recently been identified as a major non-classical cardiovascular risk factor in the haemodialysis population. The main finding of our study is that FGF-23 correlated strongly both with UFV and with echocardiographic and biochemical markers of volume overload. UFV thus emerged as a novel, strong and independent determinant of FGF-23 levels in haemodialysis patients. This adds to emerging data connecting FGF-23 with volume status. Secondly, we found that haemodialysis treatment, although it strongly reduced serum phosphate, did not achieve a uniform reduction of FGF-23 levels: a reduction in RBV led to a decrease, whereas an increment in RBV increased FGF-23 levels.
The high FGF-23 levels we observed are in line with other reports on FGF-23 in haemodialysis [4, 5] and peritoneal dialysis [19]. The interpretation of the observed independent association between FGF-23 and UFV is complex. Deranged fluid homeostasis is particularly common in the haemodialysis setting, and chronic fluid overload is strongly associated with an increased risk of cardiovascular events and mortality [20, 21]. In addition, a higher UFV is associated with an increased risk of sudden death [14]. Both UFV [14] and FGF-23 [4] are determinants of mortality in large haemodialysis populations. A high UFV reflects by definition a state of volume overload, and indeed overhydration as measured by body composition monitoring is associated with mortality as well [22]. A mechanistic explanation linking FGF-23 to volume overload may lie in the sympathetic nervous system. Volume overload and the consequent large volume shifts during dialysis may lead to sympathetic overactivity, which have been shown to directly induce FGF-23 production in bone in experimental studies [23]. Although heart rate was not independently associated with FGF-23 in our models, this does not exclude a potential role for the sympathetic nerve system. Indeed, when 11 patients were converted from three to six times weekly haemodialysis, this led to a reduction of UFV from 2.4 to 1.5 L and a concomitant reduction of sympathetic activity, as assessed by muscle sympathetic nerve activity [24]. In addition, sympathetic activity as measured by norepinephrine levels correlated strongly with mortality and concentric left ventricular hypertrophy—the consequence of prolonged volume overload—in 197 haemodialysis patients [25]. FGF-23 and sympathetic overactivity may thus be intertwined heralds of adverse outcome in haemodialysis patients. We could not demonstrate an association between RRF and FGF-23, as reported by others [11, 12, 26], possibly because of our small sample size and a relatively large proportion of anuric patients. The inverse correlation of age and FGF-23 might seem counterintuitive, but has been reported before [27], possibly suggesting less compliance to phosphate restriction in the younger patients. The strong association between FGF-23 and calcium–phosphate product has been reported earlier in an animal model [28]. It is surprising that ionized calcium does not seem to correlate with FGF-23, whereas serum calcium shows only a weak correlation. Both calcium parameters when multiplied by phosphate correlate strongly with FGF-23, and calcium is an independent variable in multivariable regression analysis, apparently bolstering the role of phosphorus as primary determinant of FGF-23 levels in haemodialysis.
FGF-23 correlated strongly with functional markers of volume overload, i.e. cardiac output, stroke volume, diastolic volume and copeptin, but not with the structural marker LVMI. This is at variance with earlier observations in pre-dialysis CKD [29, 30] and haemodialysis patients [31], although Wald et al. [32] also did not observe an association between LVMI and FGF-23 using magnetic resonance imaging in haemodialysis patients. FGF-23 did not correlate with ejection fraction. This contrasts with the observation that FGF-23 levels were elevated in patients with an ejection fraction <40% in a cohort of 885 patients with generally preserved renal function who underwent coronary angiography [33]. This may be explained by our exclusion of NYHA class IV patients or alternatively by their exclusion of patients on dialysis. Sharma et al. [34] found no difference in ejection fraction on baseline across tertiles of FGF-23 in 110 haemodialysis patients; however, higher FGF-23 levels did correlate with a more pronounced loss of ejection fraction after 1.9 years follow-up. Our findings may be reconciled with this report in that a prolonged higher stroke volume and higher end-diastolic volume in a high FGF-23 setting may eventually lead to decompensation and thus a lower stroke volume and ejection fraction. Alternatively, our relatively small cohort or differences in inclusion criteria may have influenced these associations. FGF-23 also correlated with copeptin, a hormone that is increased in haemodialysis patients and correlated with volume stimuli [35]. Taken together, we interpret these findings as showing that FGF-23 correlates more closely with volume parameters rather than cardiac function and dimensions. This is supported by the fact that UFV remained the strongest determinant of FGF-23 levels, independent of other echocardiographic covariates that pointed to a hyperdynamic volume status.
In contrast to a previous study demonstrating a 19% reduction in intact FGF-23[16], we could not detect a relevant change in C-terminal FGF-23 during a haemodialysis session. We used another method to correct for haemodilution effects [18]; however, this cannot explain the discrepancy as this correction did not affect FGF-23 levels by >10%. A possible explanation might be the use of another ELISA assay. We measured C-terminal FGF-23, because this assay is most suitable for repeated measures, is least affected by stability issues and certainly in ESRD closely reflects the amount of intact FGF-23 [4, 36, 37]. This is supported by the absence of FGF-23 in the dialysate, although the FGF-23 ELISA has not been validated for use in other biomaterials than plasma. FGF-23 clearance might not have been expected due to the size of the intact form (32 kDa) precluding its passage through the dialyser membrane; even smaller fragments of 9 kDa are not likely filtered by the low-flux dialysation procedure [38]. FGF-23 could not be detected at least in significant quantities by our assay detecting both intact FGF-23 and its C-terminal fragments.
Our findings may seem in contrast with the fact that an intensified haemodialysis schedule does lower FGF-23 levels [39]; yet better long-term phosphate control achieved by intensified haemodialysis [40] is likely to be accompanied by lower FGF-23 levels on the longer term. In that light, we could discern an univariable association of Kt/V and FGF-23, an indicator that long-term dialysis efficacy may contribute to lower FGF-23 levels. An intensified haemodialysis schedule leads to a lower UFV per dialysis session and thus less pronounced volume shifts; this too may lower FGF-23. Indeed, a decrease in RBV in one haemodialysis session already correlated with a small decrease in FGF-23 levels in our patients. Notably, recent studies on alternative dialysis modalities reported that a single 8-h online haemodiafiltration (HDF) session reduced FGF-23 levels by 48.6% [41] and that a reduction after 3–4 h of online HDF (55.7%) is also greater than after 3–5 h of high-flux haemodialysis (36.2%) [42]. FGF-23 levels remained stable after a year of high-flux haemodialysis, whereas FGF-23 increased further in the low-flux haemodialysis group [43]. In line with our observations, FGF-23 did not change significantly after a regular 4-h haemodialysis session, and FGF-23 could not be detected in both regular and HDF dialysate, despite the larger pores in HDF [41]. Possibly, this effect of HDF consists partly of the entrapment of FGF-23 molecules in the membrane in adjunct to the first discernible effects of prolonged phosphate and volume status control. It would be interesting to investigate whether strategies aimed at the reduction of the interdialytic weight gain consistently reduce FGF-23 in a prospective study.
Strengths of our study include the fact that measurements took place during a standardized haemodialysis session, wherein we could assess intra-individual changes in FGF-23 levels at multiple time points. Further, the well-documented and extensive study protocol allowed us to assess different known and new determinants of FGF-23 at the same time. Moreover, the availability of extensive echocardiographic parameters enabled us to investigate further the putative relation of FGF-23 with volume status in our patients. Limitations of our study include its observational design, precluding definite conclusions on a cause–effect relationship between volume status and FGF-23 levels, the risk of residual confounding and the availability of a serum creatinine measurement after but not before 24-hourly urine collection for the determination of RRF.
In conclusion, we found that a larger UFV was strongly and independently correlated with higher FGF-23 levels. Volume overload may thus contribute to the excessive FGF-23 levels in haemodialysis patients. This would suggest a change in the direction of effects, as according to previous hypotheses formed in pre-dialysis CKD, FGF-23 was considered to induce volume overload [3, 6]. FGF-23 levels do not change during a single haemodialysis session, whereas serum phosphate was reduced by haemodialysis. Our findings support the current paradigm that intensified haemodialysis may improve both volume status and mineral metabolism in the long term as means to lower FGF-23 and hence reduce the high risk of adverse events in haemodialysis patients.
CONFLICT OF INTEREST STATEMENT
None declared. Parts of this work were presented at the European Renal Association–European Dialysis and Transplantation Association (ERA-EDTA) conference 2014, Amsterdam, The Netherlands (MP507) and at the American Society of Nephrology Kidney Week 2014, Philadelphia, PA (TH-PO789).
ACKNOWLEDGEMENTS
This work is supported by a consortium grant from the Dutch Kidney Foundation (NIGRAM consortium, grant no. CP10.11). The NIGRAM consortium consists of the following principal investigators: Pieter M. ter Wee and M.G.V. (VU University Medical Center, Amsterdam, The Netherlands); René J. Bindels and Joost G. Hoenderop (Radboud University Medical Center Nijmegen, The Netherlands) and G.N., Jan-Luuk Hillebrands and M.H.d.B. (University Medical Center Groningen, The Netherlands). M.H.d.B. is supported by a grant from the Netherlands Organization for Scientific Research (Veni grant 016.146.014). I.J.R. is supported by TI Food and Nutrition, a public–private partnership on pre-competitive research in food and nutrition. The Dutch Kidney Foundation financially supported the original study (grant C08.2279). A.A.V. (University of Groningen, The Netherlands) is supported by research grants from Alere, Singulex and Sphingotec. The funding sources had no role in the design and conduct of the study, the collection, management, analysis and interpretation of the data, preparation, review or approval of the manuscript, or the decision to submit the report for publication.


Comments