


Abstract
The primary biomarkers used to define CKD are serum creatinine and albuminuria. These biomarkers have directed focus on the filtration and barrier functions of the kidney glomerulus even though albuminuria results from tubule dysfunction as well. Given that proximal tubules make up ∼90% of kidney cortical mass, we evaluated whether a sensitive and specific marker of proximal tubule injury, urinary kidney injury molecule-1 (KIM-1), is elevated in individuals with CKD or with risk factors for CKD.
We measured urinary KIM-1 in participants of five cohort studies from the USA and Sweden. Participants had a wide range of kidney function and were racially and ethnically diverse. Multivariable linear regression models were used to test the association of urinary KIM-1 with demographic, clinical and laboratory values.
In pooled, multivariable-adjusted analyses, log-transformed, creatinine-normalized urinary KIM-1 levels were higher in those with lower eGFR {β = −0.03 per 10 mL/min/1.73 m2 [95% confidence interval (CI) −0.05 to −0.02]} and greater albuminuria [β = 0.16 per unit of log albumin:creatinine ratio (95% CI 0.15–0.17)]. Urinary KIM-1 levels were higher in current smokers, lower in blacks than nonblacks and lower in users versus nonusers of angiotensin-converting enzyme inhibitors and angiotensin receptor blockers.
Proximal tubule injury appears to be an integral and measurable element of multiple stages of CKD.
INTRODUCTION
The presence and severity of CKD are generally focused on the glomerulus and characterized using serum creatinine, which enables estimation of the GFR, and albuminuria, which is generally accepted to reflect glomerular permeability. These biomarkers reflect the filtration and barrier functions of the kidney glomerulus even though albuminuria also results from tubule dysfunction [1]. Given that proximal tubules make up ∼90% of kidney cortical mass and that proximal tubule injury can lead to fibrosis, glomerulosclerosis and CKD [2], we evaluated whether a sensitive and specific marker of proximal tubule injury, urinary kidney injury molecule-1 (KIM-1), can identify individuals more likely to have CKD or associated risk factors.
KIM-1 is a transmembrane glycoprotein that was originally discovered using representational difference analysis in an effort to identify molecules that are significantly upregulated after ischemic acute kidney injury (AKI) [3]. The ectodomain of KIM-1 is cleaved by matrix metalloproteinases and is present in the urine in rodents and humans after tubular injury [4, 5]. Urinary KIM-1 has been studied primarily in the setting of AKI and nephrotoxicity. Low levels of urinary KIM-1 are detectable in apparently healthy individuals [6–8]. KIM-1 expression has also been demonstrated in kidney biopsies and urine samples of patients with CKD from a number of causes [9–12]. Higher urinary KIM-1 levels are associated with an increased risk of all-cause and cardiovascular mortality, insulin resistance, incident CKD and ESRD and incident congestive heart failure in population-based cohort studies [13–18]. The relationship between proximal tubular injury and CKD is not well understood. To address this, we measured urinary KIM-1 in a racially and ethnically diverse group of participants from five cohort studies conducted in the US and Sweden representing a range of comorbid conditions and baseline kidney function (excluding ESRD).
MATERIALS AND METHODS
Study cohorts (see Appendix for details)
Atherosclerosis Risk in Communities (ARIC)
ARIC is a prospective, community-based study of 15 792 adults, ages 45–64 years, recruited from four US communities between 1987 and 1989 [19]. Spot urine samples for this study were from a nested case–control study using samples obtained between 1996 and 1998 in order to examine the association between urinary biomarkers and incident ESRD; 145 ESRD cases were matched to 216 controls for age, sex, race, kidney function and baseline diabetes status [18, 20]. Cases and controls were combined for these analyses.
Chronic Renal Insufficiency Cohort (CRIC)
The CRIC is a multicenter, prospective, observational cohort study that enrolled 3939 adults with CKD (baseline eGFR 20–70 mL/min/1.73 m2), ages 21–74 years, from seven clinical centers across the USA [21]. Samples for this study were from a proteomics study of 3232 participants who were free of ESRD at the time of urine collection. A sample aliquoting error by a commercial vendor led to the exclusion of samples from 720 participants, leaving 2512 with available urine samples for inclusion in this study [22].
Pima Indian cohort (PIMA)
Between 1965 and 2007, Pima Indians from the Gila River Indian community participated in a longitudinal study of diabetes and its complications. Diabetes was diagnosed by a 2-h postload plasma glucose concentration ≥200 mg/dL at a biennial study examination, or when the diagnosis was documented in the medical record. For this study, we selected 260 participants ≥18 years of age with type 2 diabetes mellitus who participated in one of two longitudinal studies of kidney function that included measured GFR (mGFR) by the urinary clearance of iothalamate [11, 23, 24].
Prospective Investigation of the Vasculature in Uppsala Seniors (PIVUS)
The PIVUS is a community-based cohort study of men and women age 70 years living in Uppsala, Sweden, that was started in 2001. Data and samples for this study are from the second examination cycle in 2006, in which 793 participants (of 964 invited) had available urine samples for KIM-1 measurement [13].
Uppsala Longitudinal Study of Adult Men (ULSAM)
The ULSAM is a community-based, longitudinal study of men born between 1920 and 1924 in Uppsala County, Sweden. All 50-year-old men who were born and living in Uppsala County in 1970 were invited to participate in a health survey on cardiovascular risk factors. Data and samples for this study are from the fourth examination cycle in 1997, conducted when the men were ∼77 years of age. Of 1398 invited men, 838 participated and 627 had available urine samples for KIM-1 measurement [13, 14].
Sample collection and handling
Spot urine samples from visit 4 of ARIC (1996–1998) were frozen at −70°C after collection and underwent one previous freeze–thaw cycle. CRIC urine samples were from a random collection designed for ancillary proteomic studies. These samples were placed on ice immediately, centrifuged and the supernatants frozen prior to monthly shipment to the central CRIC laboratory for long-term storage at −80°C. Urine samples were collected between 2005 and 2008 and did not undergo a previous freeze–thaw cycle before being sub-aliquoted for this study. Spot urine samples from Pima participants were obtained between 1990 and 2003, frozen at −80°C after collection and underwent a maximum of two freeze–thaw cycles prior to this study. Urine samples from ARIC, CRIC and Pima participants were shipped on dry ice and received frozen at Brigham and Women's Hospital (BWH) and the University of Pennsylvania, where they were stored at −80°C until measurement. Urine samples from PIVUS (spot samples) and ULSAM participants (24-h collections) were stored at −80°C and underwent a maximum of two freeze–thaw cycles prior to this study.
Urinary KIM-1 measurement
Urinary KIM-1 measurements in ARIC, PIMA and CRIC participants were performed at BWH using a microbead-based sandwich ELISA on a Bioplex-200 platform (Bio-Rad, Hercules, CA, USA). The lower limit of quantification (LLOQ) was 9.1 pg/mL. Reproducibility was assessed by intraclass correlation of measurements from 177 duplicate samples blinded to the performance laboratory. Intraclass correlation for non-normalized KIM-1 was 0.98, reflecting excellent agreement. Urinary KIM-1 measurements in PIVUS and ULSAM were performed at Uppsala University using a commercial sandwich ELISA kit (DY1750; R&D Systems, Minneapolis, MN, USA) with an LLOQ of 31 pg/mL and interassay coefficient of variation (CV) of 6%. KIM-1 measurements were normalized to urinary creatinine concentration to account for variability in the degree of water excretion and concentration of the urine.
Urinary albumin and creatinine measurement
Urinary creatinine and albumin were measured at the KIM-1 performance laboratories. Creatinine was measured with a modified Jaffe procedure with interassay CV <5%. Albumin was measured using immunoturbidimetric or immunonephelometric analysis with interassay CV <5%. One PIVUS participant with a urinary creatinine (UCr) concentration <0.04 mg/L was excluded.
Ascertainment of kidney function and covariate data
GFR was measured in PIMA using urinary iothalamate clearance [25]. GFR was estimated using the Chronic Kidney Disease Epidemiology Collaboration equation [26] in ARIC, an internally derived equation in CRIC [27] and from plasma cystatin C in ULSAM and PIVUS [28]. Covariate information on demographics, medications and comorbid conditions were obtained from each cohort.
Statistical analysis
All analyses were performed with SAS version 9.3 (SAS Institute, Cary, NC, USA). Continuous variables were expressed as means ± standard deviations or medians with 10th and 90th percentiles and compared with parametric or nonparametric tests, as appropriate. Categorical variables were described as proportions or percentages. We tested the associations of continuous natural log-transformed KIM-1/cr [ln(KIM-1/cr)] with variables using Pearson correlation coefficients and unadjusted and multivariable-adjusted linear regression models. Multivariable models included covariates chosen on the basis of biological and clinical plausibility as potential confounders of the association between tubular injury and CKD. For pooled multivariable analyses involving multiple cohorts, we adjusted for cohort and included only variables recorded in each cohort. Assumptions of linear regression were confirmed on visual inspection of residual plots. Because urinary creatinine is a common divisor when comparing KIM-1/creatinine and albumin/creatinine and can be expected to induce spurious correlation even in the absence of a true correlation between KIM-1 and albumin [29], we compared the observed correlation coefficient with that expected on the basis of the variances of KIM-1, albumin and creatinine concentrations in CRIC, the largest cohort.
RESULTS
Demographic and clinical characteristics of participants in the five cohorts are shown in Table 1. The median (interquartile range) urinary KIM-1 concentrations, in pg/mg creatinine (KIM-1/cr), were 795 (439–1228) in ARIC, 1407 (759–2616) in CRIC, 674 (315–1373) in PIMA, 893 (598–1306) in PIVUS and 867 (495–1341) in ULSAM. The 10th and 90th percentiles of urinary KIM-1 are shown in Table 1. The median, 10th percentile and 90th percentile values of urinary KIM-1 are also shown according to eGFR and albuminuria in Figure 1. In four of five cohorts, ln(KIM-1/cr) was inversely correlated with eGFR (R = −0.29, P < 0.001 in ARIC; R = −0.34, P < 0.001 in CRIC; R = −0.14, P = 0.03 in PIMA; R = −0.18, P < 0.001 in ULSAM; in PIVUS, R = −0.04, P = 0.22). In all five cohorts, ln(KIM-1/cr) was positively correlated with ln(ACR) (R = 0.40, P < 0.001 in ARIC; R = 0.51, P < 0.001 in CRIC; R= 0.38, P < 0.001 in PIMA; R = 0.13, P < 0.001 in PIVUS; R = 0.40, P < 0.001 in ULSAM). The expected correlation on the basis of urinary creatinine as a common divisor was 0.19 in CRIC, the largest cohort [14]. Figures 2 and 3 show scatterplots of KIM-1/cr with eGFR and ACR across the five cohorts.
Demographic and clinical characteristics of the five study cohorts
| ARIC | CRIC | PIMA | PIVUS | ULSAM | |
|---|---|---|---|---|---|
| (n = 361) | (n = 2512) | (n = 260) | (n = 792) | (n = 627) | |
| Age, years | 64.8 (5.6) | 59.0 (10.8) | 42.5 (10.5) | 75.3 (0.2) | 77.5 (0.8) |
| Female | 45.2% | 45.8% | 68.5% | 49.1% | 0.0% |
| Black | 41.0% | 38.7% | 0.0% | 0.0% | 0.0% |
| SBP | 135.5 (22.3) | 127.2 (22.1) | 120.8 (14.9) | 149.0 (19.3) | 150.5 (20.7) |
| BMI, kg/m2 | 30.4 (6.0) | 32.1 (7.8) | 35.3 (8.4) | 26.8 (4.4) | 26.3 (3.5) |
| Diabetes | 57.1% | 49.7% | 100.0% | 13.7% | 13.8% |
| PVD | 7.5% | ||||
| CHF | 10.8% | 10.4% | 5.8% | 4.0% | |
| CHD | 21.6% | 3.0% | 18.2% | ||
| CVD | 26.9% | 34.6% | 6.1% | 21.7% | |
| Previous stroke | 7.8% | 10.5% | 3.3% | 5.4% | |
| Current smoking | 15.7% | 11.8% | 6.1% | 7.3% | |
| ACEI/ARB use | 33.1% | 69.3% | 3.1% | 17.3% | 16.3% |
| NSAID use | 30.6% | 51.8% | 6.5% | 4.4% | 5.8% |
| eGFR or mGFR (mL/min/1.73 m2) | 66.2 (27.2) | 43.6 (17.9) | 128.6 (37.2) | 68.0 (19.2) | 73.5 (17.1) |
| eGFR >90 | 20.8% | 1.1% | 85.4% | 10.7% | 13.6% |
| eGFR 60–89 | 34.9% | 16.8% | 11.2% | 55.0% | 64.9% |
| eGFR 45–59 | 19.4% | 25.0% | 2.7% | 25.1% | 16.3% |
| eGFR 30–44 | 16.6% | 32.1% | 0.0% | 6.6% | 3.7% |
| eGFR 15–29 | 4.7% | 22.4% | 0.8% | 0.9% | 1.1% |
| eGFR <15 | 3.6% | 2.6% | 0.0% | 1.8% | 0.5% |
| Urine ACR, mg/g | 36.1 (1.1–1087.5) | 54.1 (0.12–1786.4) | 28.1 (4.1–1044.4) | 12.3 (5.1–73.1) | 7.1 (2.7–62.3) |
| ACR <30 | 47.1% | 43.9% | 53.1% | 78.8% | 82.0% |
| ACR 30–300 | 28.3% | 25.4% | 27.7% | 18.3% | 16.4% |
| ACR ≥300 | 24.7% | 30.7% | 19.2% | 2.9% | 1.6% |
| Storage duration, years (range) | 14.3–17.2 | 4.7–8.8 | 9.7–23.6 | 1.2–4.9 | 9.5–12.8 |
| Hemoglobin, g/dL | 12.6 (10.4–15.0) | 14.0 (12.6–15.3) | |||
| Phosphorus, mg/dL | 3.8 (3.0–4.8) | 3.5 (2.8–4.1) | |||
| Serum bicarbonate, mEq/L | 23 (19–27) | 23 (20–26) | |||
| Urinary KIM-1/cr (pg/mg)a | 795 (267–2622) | 1407 (413–4609) | 674 (130–2449) | 893 (372–1770) | 867 (304–2031) |
Values for continuous variables presented as mean (SD) or median (10th and 90th percentiles) unless specified. Not all data were collected in all cohorts, accounting for missing cells.
ACEI, angiotensin-converting enzyme inhibitor; ACR, albumin:creatinine ratio; ARB, angiotensin receptor blocker; BMI, body mass index; CHF, congestive heart failure; CVD, cardiovascular disease; eGFR, estimated glomerular filtration rate; mGFR, measured glomerular filtration rate (in PIMA only); NSAID, nonsteroidal anti-inflammatory drug; PVD, peripheral vascular disease; SBP, systolic blood pressure.
aKIM-1 was measured in one laboratory for ARIC, CRIC and PIMA and in a separate laboratory for PIVUS and ULSAM.
![Median (10th–90th percentiles) levels of urinary KIM-1 in the five cohorts according to albuminuria [albumin:creatinine ratio (ACR)] and estimated glomerular filtration rate (eGFR). Urinary KIM-1 is reported as pg/mg, albuminuria as mg/gm and eGFR as mL/min/1.73 m2. Individual cells are shaded green to red based on median urinary KIM-1 levels to facilitate qualitative comparisons.](https://oup.silverchair-cdn.com/oup/backfile/Content_public/Journal/ndt/31/9/10.1093_ndt_gfw203/3/m_gfw20301.jpeg?Expires=1750368067&Signature=Lr2IZ7prvShIWkxkZzR-l4VWlASkqCLWgh1RcU2Yul6J9KsTKF-G6ku48DGMIeAo91Uc5qv8FN5lZLgsIAFVuXJ4dgWPp58N33foJKDUSPhCq~eqg8Fq~2EU8n8zZ25CAXX8lrC4GUtNTEds5GMXxcKmE~G~wxFs0kVuIzWwqF9Ig~tOGrzooKaS3MsUiiXqHf-x9jNplJm9AoYkies6KRzNcNQ0hORzIY3bNLtomkUIsmcz3fo6hSZcZozT02kAg-1gTgh60t~bv70eJjVmb~gPLAPTzfTFf-RiLM8mlHyfkQiJwqXLKXyydTiD8C~XfVcX39Zxv0vOHVz7ZCwJfA__&Key-Pair-Id=APKAIE5G5CRDK6RD3PGA)
Median (10th–90th percentiles) levels of urinary KIM-1 in the five cohorts according to albuminuria [albumin:creatinine ratio (ACR)] and estimated glomerular filtration rate (eGFR). Urinary KIM-1 is reported as pg/mg, albuminuria as mg/gm and eGFR as mL/min/1.73 m2. Individual cells are shaded green to red based on median urinary KIM-1 levels to facilitate qualitative comparisons.
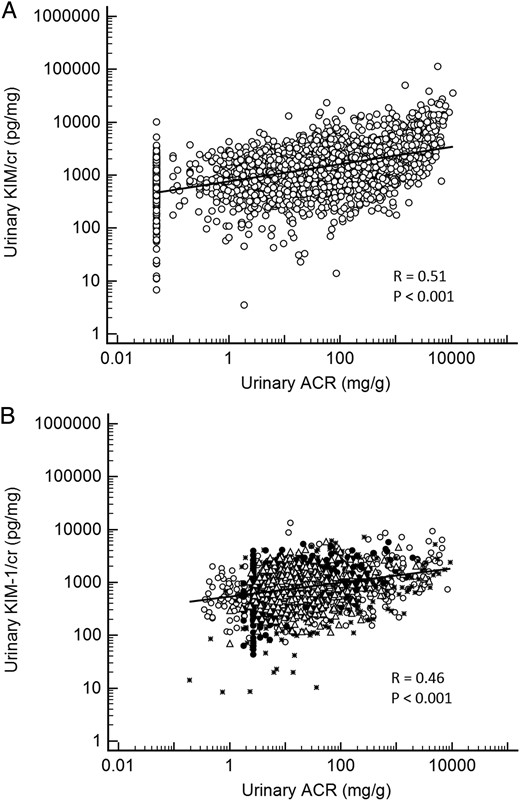
(A) Scatterplot of urinary ACR and KIM-1/creatinine in the Chronic Renal Insufficiency Cohort (CRIC) study. The lowest value reported for ACR was 0.05 mg/g. (B) Scatterplot of urinary ACR and KIM-1/creatinine in four cohort studies. The lowest ACR value reported in the ULSAM cohort was 1.77 mg/g. ° Atherosclerosis Risk in Communities (ARIC); * Pima Indian cohort (PIMA); Δ Prospective Investigation of the Vasculature in Uppsala Seniors (PIVUS); • Uppsala Longitudinal Study of Adult Men (ULSAM). ACR, albumin/creatinine ratio; cr, creatinine; KIM-1, kidney injury molecule-1.
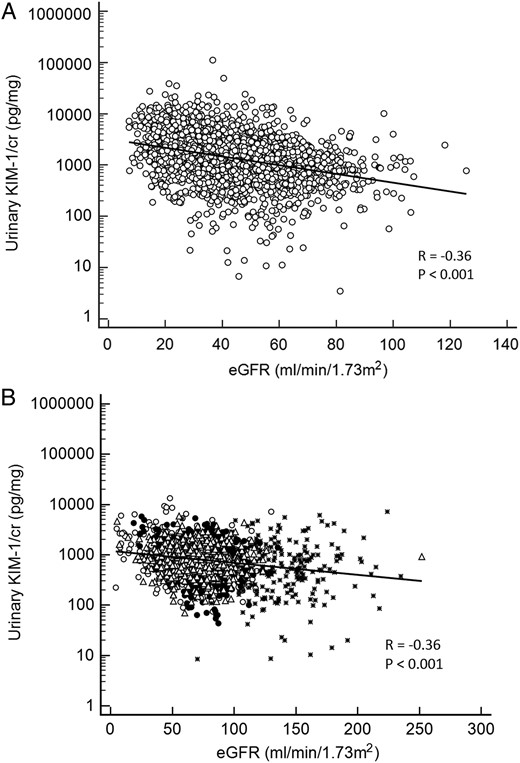
(A) Scatterplot of urinary eGFR and KIM-1/creatinine in the Chronic Renal Insufficiency Cohort (CRIC) study. (B) Scatterplot of urinary ACR and KIM-1/creatinine in four cohort studies. ° Atherosclerosis Risk in Communities (ARIC); * Pima Indian cohort (PIMA); Δ Prospective Investigation of the Vasculature in Uppsala Seniors (PIVUS); • Uppsala Longitudinal Study of Adult Men (ULSAM). cr, creatinine; eGFR, estimated glomerular filatration rate; KIM-1, kidney injury molecule-1.
Multivariable-adjusted assocations with KIM-1
Multivariable-adjusted associations with ln(KIM-1/cr) are shown in Table 2 by individual cohort and in a combined analysis. In the combined, multivariable-adjusted model, ln(KIM-1/cr) was higher in those who were older, female (versus male), with higher systolic blood pressure, with greater albuminuria and with lower eGFR. The ln(KIM-1/cr) was lower in blacks and in users of angiotensin-converting enzyme inhibitors (ACEIs) or angiotensin receptor blockers (ARBs). Note that certain variables could not be tested in combined analyses due to missing data in certain cohorts. The associations with absolute concentrations of KIM-1 (not normalized to UCr) are shown in Table 3, excluding the PIMA cohort for which nonnormalized results were not available. In the combined, multivariable-adjusted model, ln(KIM-1) was higher in those who were older, in smokers, in those with higher BMI and in those with greater albuminuria. The ln(KIM-1) was lower in blacks and in those who used ACEIs or ARBs, consistent with the creatinine-normalized KIM-1 findings.
Multivariable-adjusted associations with natural log-transformed KIM-1/cr
| Combined | ARIC | CRIC | PIMA | PIVUS | ULSAM | |
|---|---|---|---|---|---|---|
| (n = 4398) | (n = 340) | (n = 2450) | (n = 260) | (n = 742) | (n = 592) | |
| Age, per 10 years | 0.12 (0.09 to 0.15)* | 0.13 (−0.04–0.30) | 0.11 (0.07 to 0.14)* | 0.22 (0.06 to 0.39)* | N/Aa | N/Aa |
| Female (versus male) | 0.10 (0.05 to 0.15)* | 0.17 (−0.01–0.35) | 0.12 (0.05 to 0.2)* | 0.20 (−0.12–0.51) | −0.05 (−0.15–0.04) | N/Ab |
| Black (versus white) | −0.40 (−0.46 to −0.33)* | −0.28 (−0.47 to −0.09)* | −0.45 (−0.52 to *−0.37)* | N/Ac | N/Ac | N/Aa |
| SBP, per 10 | 0.02 (0.01 to 0.04)* | 0.02 (−0.03–0.06) | 0.03 (0.01 to 0.04) | 0.05 (−0.06–0.15) | 0.00 (−0.02–0.03) | −0.01 (−0.04–0.02) |
| BMI per 5 kg/m2 | 0.01 (−0.01–0.03) | 0.01 (−0.06–0.09) | −0.01 (−0.03–0.02) | 0.12 (0.04–0.21)* | 0.05 (−0.00–0.10) | 0.00 (−0.09 to 0.09) |
| Diabetes (versus no) | 0.23 (0.03–0.43)* | 0.01 (−0.06–0.09) | N/Ad | |||
| PVD (versus no) | 0.00 (−0.14–0.14) | |||||
| CHF (versus no) | 0.21 (−0.10–0.52) | 0.07 (−0.06–0.19) | 0.21 (0.02–0.41)* | 0.09 (−0.24–0.41) | ||
| CHD (versus no) | −0.10 (−0.79–0.59) | – | −0.24 (−1.13 to 0.66) | |||
| Any CVD (versus no) | 0.13 (−0.59–0.84) | 0.11 (0.01 to 0.21)* | 0.31 (−0.62–1.24) | −0.09 (−0.62–0.43) | ||
| Previous stroke (versus no) | 0.17 (−0.42–0.76) | −0.10 (−0.23–0.02) | −0.08 (−0.97–0.82) | −0.09 (−0.52–0.34) | ||
| Current smoking (versus no) | 0.06 (−0.2–0.31) | 0.28 (0.17 to 0.39)* | 0.35 (0.16–0.54)* | −0.01 (−0.24–0.22) | ||
| ACEI/ARB (versus no) | −0.13 (−0.19 to −0.08)* | −0.12 (−0.30–0.07) | −0.15 (−0.23 to −0.08)* | 0.26 (−0.61–1.14) | −0.10 (−0.23–0.02) | −0.01 (−0.18–0.16) |
| NSAID use (versus no) | 0.00 (−0.06–0.06) | −0.19 (−0.39–0.00) | −0.01 (−0.08–0.06) | −0.13 (−0.75–0.49) | −0.03 (−0.24–0.18) | 0.18 (−0.07–0.44) |
| eGFR or mGFR, per 10 mL/min/1.73 m2 | −0.03 (−0.05 to −0.02)* | −0.03 (−0.07–0.01) | −0.07 (−0.09 to −0.05)* | 0.02 (−0.02–0.06) | 0.00 (−0.02–0.03) | −0.03 (−0.07 to 0.00) |
| ln(ACR), per 1 unit | 0.16 (0.15 to 0.17)* | 0.10 (0.06 to 0.14)* | 0.14 (0.13 to 0.16)* | 0.21 (0.14 to 0.28)* | 0.08 (0.04 to 0.12)* | 0.24 (0.19 to 0.29)* |
| Storage duration per year | −0.02 (−0.04–0.0) | −0.06 (−0.17–0.05) | −0.12 (−0.19 to −0.04)* | 0.00 (−0.03–0.03) | −0.01 (−0.06–0.03) | −0.04 (−0.11–0.03) |
Reported values are β coefficients and 95% confidence intervals for all listed covariates adjusted for one another, by cohort and in a combined analysis. Asterisks (*) denote P < 0.05.
Blank cells indicate that data were not collected.
ACEI, angiotensin-converting enzyme inhibitor; ARB, angiotensin receptor blocker; BMI, body mass index; CHF, congestive heart failure; CVD, cardiovascular disease; eGFR, estimated glomerular filtration rate; ln(ACR), natural log-transformed albumin:creatinine ratio; mGFR, measured glomerular filtration rate; N/A, not available; NSAID, nonsteroidal anti-inflammatory drug; PVD, peripheral vascular disease; SBP, systolic blood pressure.
N/A, not applicable due to ano age distribution (participants were all of similar age); bno female participants; cno black participants; dall had diabetes.
Multivariable-adjusted associations with natural log-transformed KIM-1 (not normalized to urine creatinine)
| Combined | ARIC | CRIC | PIVUS | ULSAM | |
|---|---|---|---|---|---|
| (n = 4126) | (n = 340) | (n = 2450) | (n = 742) | (n = 592) | |
| Age, years | 0.16 (0.12 to 0.20)* | 0.17 (−0.05–0.39) | 0.17 (0.12 to 0.21)* | N/Aa | N/Aa |
| Female (versus male) | −0.02 (−0.09–0.04) | −0.06 (−0.3–0.18) | −0.10 (−0.19–0)* | 0.21 (0.09 to 0.34)* | N/Ab |
| Black (versus white) | −0.12 (−0.20 to −0.05)* | 0.06 (−0.18–0.31) | −0.18 (−0.28 to −0.08)* | N/Ac | N/Ac |
| SBP per 10 | −0.01 (−0.03–0.00) | 0.00 (−0.06–0.05) | 0.02 (0.0 to 0.04) | −0.07 (−0.1 to −0.04)* | −0.02 (−0.05–0.01) |
| BMI per 5 | 0.05 (0.03 to 0.08)* | 0.11 (0.02 to 0.21)* | 0.06 (0.03 to 0.09)* | 0.14 (0.07 to 0.21)* | 0.03 (−0.06–0.11) |
| Diabetes (versus no) | 0.30 (0.05 to 0.56)* | −0.15 (−0.24 to −0.05)* | |||
| PVD (versus no) | 0.00 (0.0 to 0.0) | −0.09 (−0.27–0.09) | |||
| CHF (versus no) | 0.08 (−0.04–0.20) | 0.12 (−0.27–0.52) | 0.02 (−0.14–0.18) | 0.23 (−0.04–0.49) | −0.12 (−0.44–0.20) |
| CHD (versus no) | 0.23 (−0.66–1.12) | −0.23 (−1.43–0.96) | −0.01 (−0.51–0.49) | ||
| Any CVD (versus no) | 0.08 (−0.01–0.17) | −0.22 (−1.14–0.71) | 0.13 (0.01 to 0.26)* | 0.22 (−1.03–1.47) | 0.03 (−0.50–0.55) |
| Previous stroke ( versus no) | 0.04 (−0.09–0.17) | 0.48 (−0.29 to 1.25) | 0.03 (−0.13–0.2) | −0.04 (−1.23–1.16) | −0.17 (−0.60–0.26) |
| Current smoking (versus no) | 0.34 (0.24 to 0.44)* | 0.15 (−0.18–0.49) | 0.40 (0.26 to 0.53)* | 0.55 (0.3 to 0.81)* | −0.03 (−0.25–0.20) |
| ACEI/ARB (versus no) | −0.16 (−0.23 to −0.09)* | −0.02 (−0.27–0.22) | −0.20 (−0.29 to −0.1)* | −0.11 (−0.28–0.05) | 0.01 (−0.16–0.18) |
| NSAID use (versus no) | −0.05 (−0.12–0.03) | −0.28 (−0.53 to −0.03)* | −0.04 (−0.13–0.05) | −0.29 (−0.57 to −0.01)* | 0.17 (−0.08–0.43) |
| eGFR or mGFR, per 10 mL/min/1.73 m2 | −0.01 (−0.02–0.01) | −0.05 (−0.11–0)* | −0.01 (−0.04–0.02) | −0.02 (−0.05–0.01) | −0.02 (−0.06–0.02) |
| ln(ACR), per 1 | 0.13 (0.12 to 0.15)* | 0.04 (−0.01–0.1) | 0.14 (0.13 to 0.16)* | 0.05 (0.0 to 0.11) | 0.21 (0.16 to 0.26)* |
| Storage duration per year | −0.02 (−0.06–0.02) | −0.16 (−0.30 to −0.01)* | −0.10 (−0.20 to −0.01)* | 0.00 (−0.07–0.05) | −0.00 (−0.07–0.06) |
Shown are β coefficients and 95% confidence intervals for all listed covariates adjusted for one another, by cohort and in a combined analysis. Asterisks (*) denote P < 0.05. Results for non-normalized KIM-1 were not available in the PIMA cohort.
Blank cells indicate that data were not collected.
ACEI, angiotensin converting enzyme inhibitor;ARB, angiotensin receptor blocker; BMI, body mass index; CHF, congestive heart failure; CVD, cardiovascular disease; eGFR, estimated glomerular filtration rate; ln(ACR), natural log-transformed albumin:creatinine ratio; mGFR, measured glomerular filtration rate; N/A, not available; NSAID, nonsteroidal anti-inflammatory drug; PVD, peripheral vascular disease; SBP, systolic blood pressure.
N/A, not applicable due to ano age distribution (participants were all of similar age); bno female participants; cno black participants.
Associations with blood values of hemoglobin, phosphorus and bicarbonate
To investigate associations of urinary KIM-1 with other blood laboratory values known to be altered in CKD and/or potentially related to tubular function [30], we included hemoglobin, phosphorus and bicarbonate as the dependent variables in separate multivariable models adjusting for covariates shown in Table 2 for individual cohorts with available laboratory data. The ln(KIM-1/cr) was not associated with phosphorus or bicarbonate in CRIC (n = 644 for phosphorus; n = 2206 for bicarbonate) or PIMA (n = 122) and was weakly inversely associated with hemoglobin in CRIC [n = 2194; β coefficient −0.05 (95% CI −0.08 to −0.03), P < 0.001] but not PIVUS [n = 743; β coefficient 0.00 (95% CI −0.05 to 0.05), P = 0.96].
DISCUSSION
The main findings from this study were that urinary KIM-1—a sensitive biomarker of tubular injury—was higher in current smokers and individuals with greater albuminuria, inversely correlated with eGFR in CKD, lower in blacks than whites and lower in users of ACEIs or ARBs than nonusers. Although CKD is generally defined using measures of glomerular function (i.e. GFR) and permeability (i.e. albuminuria), proximal tubules make up 90% of kidney cortical mass and tubulointerstitial lesions are generally more sensitive than glomerular lesions in predicting renal disease progression [31]. We confirmed our hypothesis that tubular injury, as assessed by measurement of urinary levels of KIM-1, is a common feature of CKD, may be responsive to pharmacological therapy and is influenced by factors including race and possibly smoking.
The trigger for KIM-1 expression and its appearance in the urine in CKD are likely related to local hypoxia and nephrotoxic effects of mediators of kidney injury. In animals, KIM-1 is expressed most strongly in proximal tubules after ischemic or nephrotoxic injury [4]. Conditional KIM-1 expression in a murine model leads to progressive fibrosis characteristic of CKD [32], providing a link between acute and recurrent injury with progressive CKD [33]. In mice expressing a mutant, truncated KIM-1 polypeptide that renders the molecule deficient in phagocytosis, kidney fibrosis was ameliorated in a model of CKD induced by ureteral obstruction, consistent with a profibrotic role for prolonged expression of KIM-1 that is related to its phagocytic function. This is in contrast with the anti-inflammatory role of KIM-1 after acute injury [34, 35]. In a zebrafish model, overexpression of KIM-1 in kidney tubules also resulted in tubular injury, reduced GFR and increased mortality through activation of the mammalian target of rapamycin (mTOR) pathway; inhibition with rapamycin, an mTOR inhibitor, was protective [36].
Tubular KIM-1 expression is virtually undetectable in healthy kidney tissues but is strongly induced in acute kidney disease and CKD [12, 37–40]. In a study of biopsy specimens from 102 cases of various renal diseases, KIM-1 was significantly induced and localized to the apical side of dilated tubules in fibrotic areas [9]. A number of studies have identified urinary KIM-1 as a diagnostic and prognostic marker for a variety of kidney diseases, including diabetic nephropathy [3–5, 18, 37, 41, 42]. There is a strong genetic determination of KIM-1 levels by polymorphism of the gene encoding KIM-1. When evaluated by a Mendelian randomization approach, there was a causal relationship found between increased KIM-1 levels with low eGFR, independent of glycemic control or albuminuria in type 1 diabetes [43].
The association of lower eGFR with elevated KIM-1 levels was observed in the combined analysis, but was statistically significant only in CRIC. CRIC was not only the largest cohort in this study, but also specifically enrolled participants with CKD and contributed the greatest number of individuals with more advanced CKD to this analysis. We cannot be certain that an association between eGFR and KIM-1 is present in non-CKD populations or in populations with glomerular hyperfiltration. The inverse association between KIM-1 and eGFR may not be monotonic across all stages of kidney disease as defined by eGFR (see Figure 1). We found progressively lower levels of KIM-1 until eGFR was <15, consistent with the possibility that diminished kidney tubular mass in advanced CKD may contribute to less KIM-1 production. Albuminuria was strongly associated with elevated KIM-1 levels in all five cohorts. The associations were independent of both eGFR and mGFR, demographics and comorbid conditions, and were not spurious due to the common divisor of urinary creatinine. The presence of albuminuria can be a marker of both alterations in glomerular permeability [44], and impaired proximal tubular uptake of filtered albumin which may be directly toxic to tubular cells [1, 45–48].
Even if the primary insult is glomerular, injury to the proximal tubule can result from abnormally filtered substances, such as albumin, oxidized lipoproteins and fatty acids. KIM-1 production and release into the urine will increase, as shown in uninephrectomized rats with overload proteinuria, a model of tubulointerstitial damage caused by repeated intraperitoneal injections of bovine serum albumin [49]. The damage to the proximal tubule can then lead to a positive feedback process resulting in interstitial fibrosis, vascular rarefaction, glomerular ischemia and worsening of glomerulosclerosis [2].
Current smokers had higher urinary KIM-1 levels than nonsmokers. Current and passive smoking, but not former smoking, were associated with the presence of albuminuria in the National Health and Nutrition Examination Survey, a cross-sectional study of adults in the USA [50]. Potential mechanisms of kidney injury from smoking include renal vasoconstriction [51] with resultant tubular hypoxia and microvascular injury or elevated intraglomerular capillary pressure with hyperfiltration [51, 52]. Additionally, lung injury from smoking may induce albuminuria and renal microvascular leak [53].
We found lower levels of urinary KIM-1 in users of ACEIs or ARBs, a finding that was independent of other confounding variables, including eGFR and albuminuria. In a previous study, we also observed that urinary KIM-1 is reduced with ARB treatment, particularly when combined with a low-sodium diet or treatment with hydrochlorothiazide, and that this reduction is associated with regression of albuminuria [54]. ACEIs and ARBs are nephroprotective in diabetic and nondiabetic kidney diseases [55–58]. Mechanisms of nephroprotection by ACEIs and ARBs include reduction of systemic and intraglomerular pressure, reduction of proteinuria and anti-inflammatory and antifibrotic actions in the kidney [59–62]. Whether KIM-1 reduction is due to ACEI or ARB use cannot be addressed in this cross-sectional study. The use of KIM-1 as a biomarker of drug efficacy in CKD deserves further investigation in interventional trials as a candidate surrogate outcome [63].
Substantially lower levels of urinary KIM-1 were found in blacks compared with whites. The magnitude of the finding (creatinine-normalized levels ∼40% lower levels in blacks than whites; absolute levels ∼12% lower) was substantial and in the opposite direction of albuminuria (which was higher in blacks than whites). This inverse relationship was independent of eGFR, albuminuria, age, sex and BMI. Lower creatinine-normalized urinary KIM-1 levels in blacks than whites were also reported by McWilliam et al. [7] in two pediatric cohorts and by Sarnak et al. [17] in an elderly community-based cohort. Because of the greater burden and rapidity of progression of kidney disease in blacks [64, 65], we might expect that blacks would have higher, not lower, levels of a biomarker of tubular injury. The underlying explanation or significance of the racial differences is not yet clear. One possibility is that differences in KIM-1 are due to differences in the glomerular/tubular distribution or severity of the underlying kidney pathology in blacks versus whites with CKD. For example, there may be a preponderance of glomerulosclerosis and more loss of functional proximal tubule cells (needed to produce KIM-1) in blacks [66]. There may also be genetic factors from polymorphisms in the gene encoding KIM-1 [43, 67, 68]. This interesting result is worthy of further study.
A major strength of this study is the inclusion of participants from five separate cohort studies, representing geographic, racial and ethnic diversity. Participants had a broad range of kidney function and comorbid conditions. However, by including five independent cohort studies, each of which had different inclusion/exclusion criteria, methods for GFR measurement or estimation and processes for biological sample and data collection, we cannot be certain that divergent results in individual cohorts for urinary KIM-1 associations do not represent bias due to differences in study design, sample integrity or differences in ascertainment of comorbid conditions. It is reassuring, however, that KIM-1 is a relatively stable analyte in the urine [69]. We also report both creatinine-normalized and non-normalized associations, given the effects of urinary dilution and creatinine excretion rate on nonnormalized biomarker and normalized values, respectively [70]. Differences in the magnitude or direction of certain associations presented in Tables 2 and 3 (for example, with the effect of sex) may be attributable to differences in creatinine excretion rate, which also declines with advancing stages of CKD [71]. Given the multiple number of statistical tests, false-positive associations may be observed when using the conventional P-value cutoff of 0.05. Furthermore, as a cross-sectional study, we cannot know whether our observed associations are causal, so prospective studies will be informative.
In conclusion, proximal tubular injury is negatively associated with eGFR and positively correlated with albuminuria in individuals with and at risk of CKD. These data are consistent with the close interrelationships between glomerular and tubular dysfunction. While causality cannot be concluded from this cross-sectional study, the data across five cohorts are consistent with an important role of proximal tubule injury in CKD and suggest this part of the nephron as a potential therapeutic target. Future studies are warranted to clarify the role of KIM-1 as a prognostic factor, surrogate endpoint for interventional studies and therapeutic target.
CONFLICT OF INTEREST STATEMENT
J.V.B. is a co-inventor on KIM-1 patents that are assigned to Partners HealthCare and licensed by Partners HealthCare to Johnson & Johnson, Sekisui Chemical Company, Biogen Idec, Astute Medical and a number of research reagent companies. No other authors reported relevant conflicts of interest.
ACKNOWLEDGEMENTS
The authors thank the staff and participants of the studies for their important contributions. Results from this study were presented at the American Society of Nephrology Annual Meeting in November 2014. This work was supported by the Chronic Kidney Disease Biomarker Consortium (funded by NIDDK U01DK85649, U01DK085673, U01DK085660, U01DK085688, U01DK085651 and U01DK085689), DK072381, R37DK39773, the National Center for Advancing Translational Sciences of the National Institutes of Health (UL1TR000003), the Intramural Research Program of the National Institute of Diabetes and Digestive and Kidney Diseases, the Swedish Research Council, Swedish Heart-Lung Foundation and the Marianne and Marcus Wallenberg Foundation, Dalarna University. The Atherosclerosis Risk in Communities Study is carried out as a collaborative study supported by National Heart, Lung, and Blood Institute contract (HHSN268201100005C, HHSN268201100006C, HHSN268201100007C, HHSN268201100008C, HHSN268201100009C, HHSN268201100010C, HHSN268201100011C, and HHSN268201100012C). Funding for the CRIC Study was obtained under a cooperative agreement from the National Institute of Diabetes and Digestive and Kidney Diseases (U01DK060990, U01DK060984, U01DK061022, U01DK061021, U01DK061028, U01DK060980, U01DK060963, and U01DK060902). In addition, this work was supported in part by the Perelman School of Medicine at the University of Pennsylvania Clinical and Translational Science Award NIH/NCATS UL1TR000003, Johns Hopkins University UL1 TR-000424, University of Maryland GCRC M01 RR-16500, Clinical and Translational Science Collaborative of Cleveland, UL1TR000439 from the National Center for Advancing Translational Sciences (NCATS) component of the National Institutes of Health and NIH roadmap for Medical Research, Michigan Institute for Clinical and Health Research (MICHR) UL1TR000433, University of Illinois at Chicago CTSA UL1RR029879, Tulane University Translational Research in Hypertension and Renal Biology P30GM103337, Kaiser Permanente NIH/NCRR UCSF-CTSI UL1 RR-024131.
REFERENCES
APPENDIX
Inclusion/exclusion criteria of the parent cohort studies
| Study group | Inclusion | Exclusion | Subset included in this study |
|---|---|---|---|
| Pima Indian Cohort (PIMA): | Group 1:
|
|
|
| Atherosclerosis Risk in Communities (ARIC) |
|
| |
| Chronic Renal Insufficiency Cohort (CRIC) |
|
|
|
| Prospective Investigation of the Vasculature in the Uppsala Seniors (PIVUS) |
|
| |
| Uppsala Longitudinal Study of Adult Men (ULSAM) |
|
|


Comments