


Abstract
The lipodystrophy-like phenotype has been suggested in early chronic kidney disease (CKD). It includes adipose tissue atrophy, systemic insulin resistance (IR), dyslipidemia and ectopic lipid accumulation. To elucidate its pathogenesis, we investigated the role of two uremic toxins that affect insulin sensitivity: an endogenous nitric oxide synthase inhibitor, and asymmetric dimethylarginine (ADMA) and indoxyl sulfate (IS).
Six-week-old Sprague-Dawley rats were rendered CKD by subtotal nephrectomy (Nx) and compared with sham-operated rats. Cultured 3T3-L1 fibroblasts were differentiated into mature adipocytes with or without ADMA. Transgenic (Tg) mice overexpressing each isoform of ADMA degrading enzyme, dimethylarginine dimethylaminohydrolase 1 (DDAH1) and DDAH2 were subject to Nx and their phenotypes were investigated.
In Nx rats, IR was evident and insulin stimulation failed to activate insulin signaling in adipose tissues. Adipose tissue weight, adipocyte size and adipocyte differentiation marker expressions decreased as a consequence of IR in Nx. Tissue lipid content in the liver and muscle increased in Nx rats. Tissue levels of ADMA, IS and oxidative stress increased in the adipose tissue of Nx rats. Both DDAH1 and DDAH2 expressions decreased, and a putative IS receptor, aryl hydrocarbon receptor, expression increased in the adipose tissue of Nx rats. ADMA inhibited adipocyte differentiation, triglyceride accumulation and insulin signaling, which were reversed by pretreatment with cGMP. In each type of Tg mice overexpressing DDAH1 or DDAH2, all lipodystrophy-like phenotypes induced by Nx were reversed.
In mild CKD, dysregulation of the ADMA/DDAH pathway in adipose tissue triggers lipodystrophy-like phenotype changes, including ectopic fat depositions.
INTRODUCTION
Chronic kidney disease (CKD) is a significant health problem, and evidence has accumulated showing that it is a common disease associated with morbidity and mortality [1]. Among the CKD complications are metabolic abnormalities, including insulin resistance (IR) and dyslipidemia, which are risk factors for cardiovascular diseases through the development of endothelial dysfunction or atherosclerosis. IR has been reported to be present in the early stage of CKD, even when glomerular filtration rate is within normal range [2]. Dyslipidemia also develops during the early stage of CKD and becomes more severe as CKD progresses [1]. The most pronounced conditions are hypertriglyceridemia, decreased high-density lipoprotein levels and increased triglyceride (TG)-rich lipoproteins and free fatty acid (FFA) [3]. These disturbances of lipid metabolism have been presumed to result from the decreased metabolic clearance of TG and the abnormal expressions of lipoprotein lipase and/or hepatic lipase.
The combination of IR and hypertriglyceridemia implies the presence of functional abnormalities of insulin target tissues including adipose tissues. Emerging evidence suggests that CKD might be a state of acquired lipodystrophy leading to ectopic lipid deposition [4]. Lipodystrophy represents a heterogeneous group of disorders defined by a localized and/or generalized loss of body fat. Lipodystrophy is generally associated with severe metabolic alterations including IR, dyslipidemia and glucose intolerance [5]. Recent studies showed that adipose tissue flexibility might be altered in CKD, resulting in a loss of white adipose tissue, dyslipidemia and the accumulation of lipids in ectopic sites [6, 7]. Although the dysregulation of lipoprotein metabolism primarily contributed to the pathogenesis of dyslipidemia in CKD [8], this phenotype potentially has some effects on lipid metabolism. However, a detailed mechanism for lipodystrophy-like alterations in CKD has not been elucidated. A potential role of abnormal renal hemodynamic and accumulation of uremic toxins was stressed for the pathogenesis of lipodystrophy-like phenotype in CKD [9, 10].
So far, we have focused on the pathogenic roles of asymmetric dimethylarginine (ADMA), an endogenous inhibitor of nitric oxide synthase (NOS). ADMA is among the uremic toxins and is degraded by the enzyme dimethylarginine dimethylaminohydrolase (DDAH). DDAH is composed of two isoforms, DDAH1 and DDAH2, which have divergent functions [11] mainly by the reduction in ADMA and the increase in nitric oxide (NO) levels. In renal insufficiency, DDAH2 expression decreases in the kidney [12] and in the vascular endothelium [13], leading to an increase in systemic ADMA. Increases in ADMA levels and inhibition of NO generation may be involved in the pathogenesis of IR, as previously reported [14–16]. It has also been shown that mice overexpressing DDAH present with decreased plasma levels of ADMA and enhanced systemic insulin sensitivity [17]. Of note, recent studies revealed that adipocytes also produce ADMA and express both DDAH1 and DDAH2 [18, 19]. However, the effects of ADMA on CKD-associated lipodystrophy-like phenotype have not yet been elucidated in detail.
In this study, we demonstrated lipodystrophy-like phenotype changes in subtotally nephrectomized rats with mild renal insufficiency. We provided the molecular mechanism for lipodystrophy-like phenotype in mild CKD, where accumulation of ADMA and indoxyl sulfate (IS) induced this phenotype.
MATERIALS AND METHODS
Animals
Six-week-old male Sprague-Dawley rats (Charles River Japan, Kanagawa, Japan) weighing 130–140 g were the specimen of choice in this study. They were kept in individual metabolic cages and fed a standard rat chow (15 g/day, 0.38% sodium, 0.97% potassium and 25.1% protein) (Nippon Clea, Tokyo, Japan). Rats were randomly assigned to one of two groups: Group 1, sham-operated rats (sham, N = 8); Group 2, subtotally nephrectomized rats (Nx, N = 8). In subtotal nephrectomy, the left kidney was exposed through a flank incision and the upper and lower poles were removed. After a recovery period of 7 days, right kidney was removed through a flank incision. The incisions were closed with metal clips. Sham-operated rats underwent the same procedures without nephrectomy [20]. Systolic blood pressure was measured in conscious rats using the tail-cuff method. Around 30 min before the measurement, rats were trained to become accustomed to the rat restraining device (KN-210, Natsume Co., Tokyo) and measurements were repeated five times. The average of these values was documented. Twelve weeks after Nx, rats in each group were subjected to oral glucose and insulin tolerance tests (OGTT and ITT, respectively), as previously described [21], and sacrificed. The serum creatinine concentration was measured using the L-Type Wako CRE-M kit (Wako Pure Chemical Industries, Osaka), which is based on the creatininase-HMMPS method. Urinary protein levels were measured using the pyrogallol red–molybdate colorimetric method. Serum TG levels were measured using an enzymatic method with the L-Type TG M kit (Wako), and serum FFA levels were measured using a colorimetric/fluorometric enzymatic method, by means of a commercial assay kit (Wako). Plasma and tissue concentrations of ADMA were measured by high-performance liquid chromatography [22]. The concentrations of the lipid peroxidation product malondialdehyde (MDA) in tissue suspension were determined with a commercial TBARS assay kit (Cayman Chemical). The tissue TG contents were measured with a commercially available kit (Wako Chemicals, Tokyo, Japan). All experiments were approved by the Institutional Animal Care and Use Committee and performed in accordance with the animal experimentation guidelines of Keio University School of Medicine.
DDAH1 and DDAH2 transgenic mice
All mice were raised on a C57BL/6 genetic background. DDAH1 transgenic (DDAH1 Tg) mice were purchased from Charles River (Charles River Laboratories Germany, Sulzfeld, Germany). Offspring were screened for transgene expression by polymerase chain reaction (PCR), as previously described [23]. DDAH2 Tg mice were bred and screened for transgene expression by PCR, as previously described [24].
Histological analysis and immunohistochemistry
Portions of epididymal and perirenal adipose tissue, liver and muscle tissues were removed and fixed with 10% formaldehyde and embedded in paraffin. For the detection of lipid accumulation, Oil-Red O staining was performed as described previously [25]. For the detection of the accumulation of IS in adipose tissues, immunohistochemistry was performed using antibodies that detected IS [26]. The number of IS-positive cells was counted in a blinded fashion under the microscope with a 400-fold magnification. Five rats from each group were analyzed and >50 serial fields were examined for each rat. The adipocyte size was also measured in five rats from each group, randomly selecting 50 serial fields for each rat by using the software Win Roof (Mitani, Chiba, Japan).
Western blot analysis
Immunoblotting analysis was performed as previously described [20]. Blots were incubated with specific antibodies against 3-phosphoinositide-dependent protein kinase-1 (PDK1), phospho-PDK1 (Ser241), Akt and phospho-Akt (Thr308) (Upstate Biotechnology, Lake Placid, NY, USA). Band intensities were quantified and normalized by the use of appropriate proteins with the Scion Image software (Scion Corp., Fredrick, MD, USA).
Cell culture
3T3-L1 fibroblasts were grown in Dulbecco's modified Eagle's medium supplemented with 10% fetal bovine serum and 1% penicillin/streptomycin. Differentiation was induced in postconfluent cells by adding a differentiation mixture as described previously [25]. To examine the effect of ADMA on the differentiation process, cells were grown in the presence or absence of ADMA (Sigma Chemical, St Louis, MO, USA) or cyclic guanosine monophosphate (cGMP, Sigma) that were prepared fresh daily when exchanging the medium. The culture supernatant was collected, and nitrate/nitrite concentrations were examined using a nitrate/nitrite colorimetric assay kit (Cayman Chemical Company, Ann Arbor, MI, USA).
RNA extraction and real-time PCR
Total RNA was extracted from the rat epididymal fat tissue using TRIzol Reagent (Invitrogen, Carlsbad, CA, USA) according to the instructions provided by the manufacturer. Total RNA was subjected to reverse transcription in a 20 µL reaction containing random primers and SuperscriptII enzyme (Invitrogen). Quantitative real-time PCR was performed with an ABI Prism 7700 Sequence Detection System using SYBR® Green PCR Master Mix Reagent Kit (Applied Biosystems, Foster City, CA, USA). Primers used are shown in Table 1. Levels of mRNA were normalized to those of 18s ribosomal RNA.
The primers used in this study
| Gene | Forward | Reverse |
|---|---|---|
| PPARγ | CGCTGATGCACTGCCTATGA | GGGCCAGAATGGCATCTCT |
| AP-2 | GGATGGAAAGTCGACCACCATA | TGACGCCTTTCATGACACATTC |
| CEBPα | ACGTGGAGACGCAGCAGAA | AGGCGGTCATTGTCACTGG |
| CEBPβ | CCGGGCCCTGAGTAATCACT | AACATCAACAGCAACAACCCC |
| GLUT4 | TGGCATGGGTTTCCAGTATG | GGTTTCACCTCCTGCTCTAA |
| GLUT1 | GCCTGAGACCAGTTGAAAGCA | TCAGCCTCCGAGGTCCTTCT |
| 18srRNA | ACGGACCAGAGCGAAAGCAT | TGTCAATCCTGTCCGTGTCC |
| DDAH1 | CATGTCTTGCTGCACCGAAC | GACCTTTGCGCTTTCTGG |
| DDAH2 | GGTTGATGGAGTGCGTAAAGC | TCCACAATTCGGAGTCCCAA |
| AhR | CCTTCTTCATCCGTCAGTGGTC | CCCACATCCGCATGATTAAGAC |
Statistical analysis
The resulting data are expressed as mean ± standard error of the mean (SEM). Data were evaluated by the appropriate one- or two-way analysis of variance, followed by Bonferroni's post hoc test. P < 0.05 was the value considered statistically significant.
RESULTS
IR in mild renal insufficiency
Since this model of renal failure is mild, body weight and blood pressure were not different between sham-operated and Nx rats (sham versus Nx; body weight, 529 ± 18.2 versus 512 ± 20.3 g, blood pressure, 109 ± 10.3 versus 112 ± 14.3 mmHg). Although fasting blood glucose and TG levels were not altered, fasting FFA and insulin levels increased in Nx rats (Table 2). OGTT revealed impaired glucose tolerance in Nx rats (Figure 1A). ITT showed that the fall in blood glucose levels within the initial 15 min was blunted more in the Nx group than in sham-operated rats (Figure 1B). We examined the activation of insulin signaling in several tissues after the stimulation with insulin. Phosphorylated levels of both Akt and PDK-1, an upstream kinase for Akt in muscle and liver tissues, were not different between sham-operated and Nx rats, whereas they were attenuated in adipose tissues in Nx rats (Figure 1C and D). Insulin is one of the essential factors for adipocyte differentiation and adipogenesis [27, 28]. Impaired insulin signaling in adipose tissues implies the impaired maturation of adipose tissue. The weight of both epididymal and perirenal fat significantly decreased in Nx rats (Figure 1E). The adipose tissue atrophy with dyslipidemia and IR coincides with the state of lipodystrophy. To confirm this phenotype, we assessed the ectopic lipid accumulation that often accompanies lipodystrophy. Both Oil-Red O staining and the quantification of tissue TG content revealed that in Nx rats, lipid accumulation increased in both liver and muscle (Figure 1F and G).
Basic characteristics of sham-operated and Nx rats
| Sham | Nx | |
|---|---|---|
| Body weight (g) | 529 ± 18.2 | 512 ± 20.3 |
| Blood pressure (mmHg) | 109 ± 10.3 | 112 ± 14.3 |
| Total protein (g/dL) | 5.9 ± 0.25 | 5.8 ± 0.07 |
| Albumin (g/dL) | 3.8 ± 0.22 | 3.7 ± 0.07 |
| Creatinine (mg/dL) | 0.32 ± 0.014 | 0.50 ± 0.023** |
| Fasting blood glucose (mg/dL) | 151 ± 16.1 | 135 ± 14.3 |
| TG (mg/dL) | 44.5 ± 11.3 | 44.8 ± 12.1 |
| FFA (mEq/L) | 0.238 ± 0.011 | 0.302 ± 0.018* |
| Total cholesterol (mg/dL) | 61.1 ± 7.36 | 70.4 ± 5.39* |
| LDL cholesterol (mg/dL) | 9.0 ± 0.85 | 9.6 ± 0.10 |
| Plasma renin activity (ng/mL/h) | 13.1 ± 1.39 | 6.3 ± 0.11* |
| Aldosterone (pg/mL) | 213 ± 23.0 | 166 ± 18.1 |
| Fasting insulin (ng/mL) | 1.30 ± 0.073 | 2.02 ± 1.37* |
| Urinary protein (mg/day) | 8.8 ± 0.43 | 16.9 ± 1.60* |
| Adiponectin (ng/mL) | 1214 ± 208 | 1161 ± 152 |
Data are presented as mean ± SEM.
*P < 0.05 versus sham.
**P < 0.01 versus sham, n = 6 in each group.
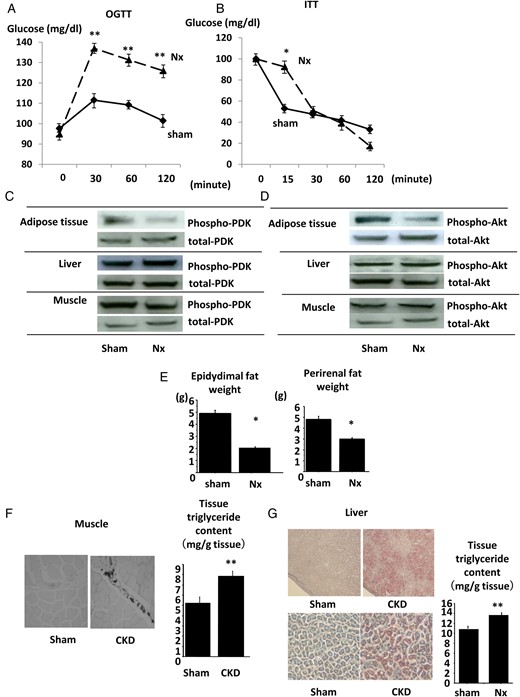
IR in Nx rats. The results of OGTT (A) and ITT (B) in Nx rats and sham-operated rats. The phosphorylation levels of PDK (C) and Akt (D) in adipose, liver and muscle tissues of Nx rats and sham-operated rats after the intraperitoneal insulin injection were analyzed by immunoblotting. The weight of epididymal (left) and perirenal (right) fat was examined in Nx rats and sham-operated rats. The lipid accumulation of muscle tissues (F) and liver tissues (G) of Nx rats and sham-operated rats was examined by Oil-Red O staining (left panel) and by the measurement of tissue TG content (right panel). *P < 0.05 versus sham-operated rats, **P < 0.01 versus sham-operated rats, n = 6. Data are presented as mean ± SEM.
The impaired maturation of adipose tissues in mild renal insufficiency
We further evaluated the characteristics of adipose tissue in renal insufficiency. The histological findings revealed that adipocytes were smaller in size in Nx rats in comparison with those in sham-operated rats (Figure 2A). The quantity of smaller sized adipocytes (diameter <60 µm) increased in Nx rats (Figure 2B). Adipocyte differentiation markers were measured in adipose tissue. The expression levels of CAAT enhancer-binding protein α (C/EBPα), C/EBPβ, PPARγ and aP2, master regulators of adipocyte differentiation, were downregulated in the adipose tissue in Nx rats (Figure 2C–F). The expression of glucose transporter 4 (GLUT4), crucial molecules for insulin-induced cellular glucose incorporation that are expressed in mature adipocytes and regulated by PPARγ [29], decreased in the adipose tissue of Nx rats (Figure 2G). The expression of GLUT1 was also downregulated in CKD rats (Figure 2H). These results indicate that adipocyte maturation was abrogated in the state of mild renal insufficiency.
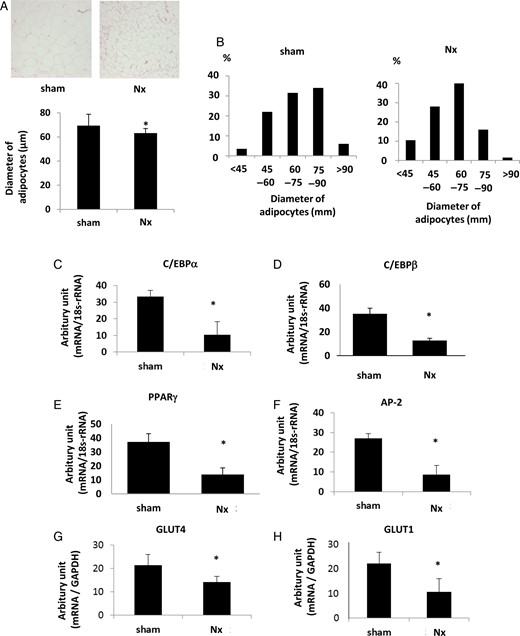
The phenotype changes in adipose tissues in Nx rats. (A) The results of hematoxylin and eosin staining of the adipose tissue in Nx rats and sham-operated rats are shown in the upper panel. The bar graph in the lower panel represents the averages of diameters of adipocytes in Nx rats and sham-operated rats. (B) The population of diameters of adipocytes in the adipose tissues of Nx rats and sham-operated rats. The mRNA expression levels of the adipocyte differentiation markers, CEBPα (C), CEBPβ (D), PPARγ (E) and AP-2 (F), were measured by real-time PCR. The mRNA expressions of glucose transporter, GLUT4 (G) and GLUT1 (H), were also examined. *P < 0.05 versus sham-operated rats, n = 6. Data are presented as mean ± SEM.
Tissue ADMA levels were increased in adipose tissues in mild renal insufficiency
It was reported that an increase in the plasma level of ADMA was associated with IR [16] and its levels in serum increased in renal insufficiency [15]. It was also revealed that the enzymes for the production and degradation of ADMA were expressed in adipose tissues [18]. In our rat model, plasma ADMA levels were not altered between sham-operated and Nx rats (Figure 3A). The tissue concentrations of ADMA in muscle and liver were not different between the groups, while those in the adipose tissues increased in Nx rats (Figure 3B). The mRNA expression levels of both DDAH1 and DDAH2 decreased in Nx rats, which was consistent with the rise in the tissue concentrations of ADMA (Figure 3C). Since both DDAH expressions and activities were regulated by oxidative stress levels, tissue reactive oxygen species levels (ROS) were examined. In a TBARS assay, MDA levels in adipose tissues increased in Nx rats (Figure 3D), although those in muscle and liver were not different between the groups (Supplementary data, Figure S1A). These data indicate that the elevation in tissue oxidative stress levels provoked the reduction of both DDAH1 and DDAH2 expression in adipose tissue in mild renal insufficiency. In renal insufficiency, accumulation of uremic toxins in tissues increased oxidative stress, contributing to the tissue damages including vascular endothelium and renal tissues [30, 31]. IS is among these molecules and activates its putative receptor, aryl hydrocarbon receptors (AhRs). Immunostaining revealed that the tissue concentration of IS increased in Nx rats (Figure 3E). The expression of AhR was also upregulated in adipose tissues of Nx rats (Figure 3F), although expression in muscle and liver was not different between the groups (Supplementary data, Figure S1B). These changes in combination could increase oxidative stress levels in adipose tissues.
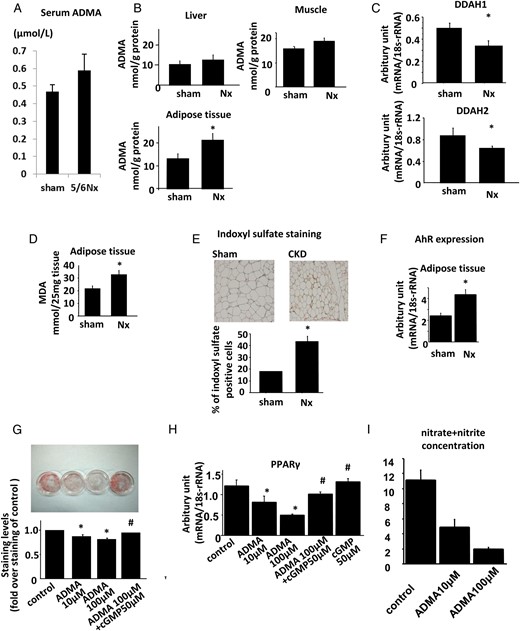
Aberrant regulation of DDAH/ADMA pathway in Nx rats. (A) Plasma levels of ADMA in Nx and sham-operated rats. (B) Tissue concentrations of ADMA in the liver, muscle and adipose tissues of Nx and sham-operated rats. (C) The expressions of DDAH1 (upper panel) and DDAH2 (lower panel) in the adipose tissues. (D) Tissue MDA levels as assessed by TBARS methods representing tissue oxidative stress in liver, muscle and adipose tissues of Nx and sham-operated rats. (E) Tissue levels of indoxyl sulfate in the adipose tissues of Nx and sham-operated rats as assessed by immunostaining using antibody against indoxyl sulfate. (F) The mRNA expression levels of AhRs in the liver, muscle and adipose tissues of Nx and sham-operated rats. (G) 3T3-L1 fibroblasts were differentiated into adipocytes in the presence or absence of ADMA or cGMP, as described in Materials and methods. After the cells were differentiated into mature adipocytes on Day 8, the TG content (G), mRNA expression of adipocyte differentiation markers, including PPARγ (H) and nitrate/nitrite concentration in the medium (I) were measured. (A–F) *P < 0.05 versus sham-operated rats, n = 6. (G–I) *P < 0.05 versus control cells, #P < 0.05 versus cells treated with 100 µM of ADMA, n = 6. Data are presented as mean ± SEM.
An in vitro model was used to investigate the effects of ADMA on adipocyte differentiation. We treated 3T3-L1 fibroblasts with or without ADMA during the adipocyte differentiation process. The TG content in adipocytes treated with ADMA was reduced and this reduction was reversed by the cotreatment with cGMP, a second messenger of NO (Figure 3G). The expression levels of adipocyte differentiation markers PPARγ, aP2, C/EBPα and C/EBPβ decreased by the treatment with ADMA, which was also reversed by treatment with cGMP (Figure 3H and Supplementary data, Figure S1C). ADMA decreased the nitrate/nitrite concentration in the culture medium in a dose-dependent fashion, indicating that NO production was inhibited under this experimental condition (Figure 3I). These data implied that ADMA inhibited the differentiation process by its inhibitory effects on NOS. In combination, all these data indicate that the increase in ADMA levels in adipose tissue of Nx rats contributed to the defects in adipocyte differentiation.
DDAH overexpression reversed the phenotype changes in mild renal insufficiency
To confirm a role of the ADMA/DDAH pathway in the pathogenesis of the defect in adipose tissue maturation in Nx rats, we rendered either DDAH1 or DDAH2 Tg mice renal failure by Nx and compared their phenotypes with those of each wild-type (WT) littermate with Nx. Both blood urea nitrogen (BUN) and serum creatinine levels increased in WT mice by Nx, which were not altered in DDAH1 Tg mice. Fasting levels of insulin and FFA increased in WT mice with Nx (WT + Nx), which were ameliorated in DDAH1 Tg mice with Nx (DDAH1 Tg + Nx) (Table 3). Similar results were obtained in DDAH2 Tg mice with Nx (DDAH2 Tg + Nx) (Table 4). In ITT, the fall in blood glucose levels was blunted in WT + Nx, which was the reverse in DDAH1 Tg + Nx (Figure 4A) or DDAH2 Tg + Nx (Supplementary data, Figure S2A). ADMA concentrations in the adipose tissue increased in WT + Nx, which was reversed in DDAH1 Tg + Nx (Figure 4B) or DDAH2 Tg + Nx (Supplementary data, Figure S2B). The weight of adipose tissue decreased in WT + Nx, which was reversed in DDAH1 Tg + Nx (Figure 4C) or DDAH2 Tg + Nx (Supplementary data, Figure S2C). The diameters of adipocytes decreased in WT + Nx, which was the reverse in DDAH1 Tg + Nx (Figure 4D) or DDAH2 Tg + Nx (Supplementary data, S2D). Finally, lipid accumulation in the liver increased in WT + Nx, which was ameliorated in DDAH1 Tg + Nx (Figure 4E) or DDAH2 Tg + Nx (Supplementary data, S2E).
The baseline characteristics of DDAH1 Tg mice
| Parameters | WT + sham | WT + Nx | DDAH1 Tg + Nx |
|---|---|---|---|
| Body weight (g) | 29.9 ± 2.0 | 29.7 ± 2.2 | 29.1 ± 1.8 |
| Total protein (g/dL) | 4.0 ± 0.2 | 4.0 ± 0.3 | 4.0 ± 0.1 |
| AST (IU/L) | 51.0 ± 3.7 | 53.7 ± 3.5 | 49.1 ± 4.1 |
| ALT (IU/L) | 21.0 ± 2.0 | 25.7 ± 2.8 | 24.5 ± 3.1 |
| ALP (IU/L) | 125.0 ± 4.9 | 132 ± 5.0 | 129 ± 6.8 |
| Creatinine (mg/dL) | 0.15 ± 0.04 | 0.32 ± 0.08* | 0.29 ± 0.05* |
| BUN (mg/dL) | 19.4 ± 0.32 | 26.1 ± 0.92* | 24.1 ± 0.65* |
| TG (mg/dL) | 17.4 ± 2.8 | 23.1 ± 2.6 | 19.4 ± 5.3 |
| FFA (mEq/L) | 0.69 ± 0.06 | 0.82 ± 0.11* | 0.57 ± 0.09** |
| Fasting insulin (ng/mL) | 1.42 ± 0.26 | 1.84 ± 0.19* | 1.49 ± 0.09 |
| HDL cholesterol (mg/dL) | 40.0 ± 2.9 | 40.5 ± 3.1 | 42 ± 3.1 |
| LDL cholesterol (mg/dL) | 5.6 ± 0.9 | 8.8 ± 1.3 | 8.0 ± 1.4 |
Data are presented as mean ± SEM. AST, aspartate aminotransferase; ALT, aspartate aminotransferase; ALP, alkaline phosphatase.
*P < 0.05 versus WT + sham.
**P < 0.05 versus WT + Nx, n = 5.
The baseline characteristics of DDAH2 Tg mice
| Parameters | WT + sham | WT + Nx | DDAH2 Tg + Nx |
|---|---|---|---|
| Body weight (g) | 30.3 ± 1.9 | 29.9 ± 2.1 | 29.3 ± 1.6 |
| Total protein (g/dL) | 4.0 ± 0.1 | 4.1 ± 0.3 | 3.9 ± 0.2 |
| AST (IU/L) | 51.4 ± 2.7 | 52.7 ± 3.6 | 48.9 ± 2.4 |
| ALT (IU/L) | 21.0 ± 0.9 | 25.3 ± 1.5 | 23.2 ± 4.1 |
| ALP (IU/L) | 127.0 ± 3.7 | 134.0 ± 5.1 | 115 ± 5.3 |
| Creatinine (mg/dL) | 0.15 ± 0.03 | 0.30 ± 0.05* | 0.32 ± 0.07* |
| BUN (mg/dL) | 19.6 ± 0.23 | 26.1 ± 0.78* | 25.9 ± 0.87* |
| TG (mg/dL) | 17.6 ± 2.0 | 23.0 ± 2.2 | 21.7 ± 2.8 |
| Fasting insulin (ng/mL) | 1.40 ± 0.27 | 1.83 ± 0.21* | 1.52 ± 0.19 |
| FFA (mEq/L) | 0.69 ± 0.07 | 0.84 ± 0.12* | 0.71 ± 0.11** |
| HDL-C (mg/dL) | 38.0 ± 3.1 | 39.5 ± 2.8 | 39 ± 2.7 |
| LDL-C (mg/dL) | 5.5 ± 1.3 | 8.9 ± 0.9 | 8.5 ± 2.1 |
Data are presented as mean ± SEM.
AST, aspartate aminotransferase; ALT, aspartate aminotransferase; ALP, alkaline phosphatase.
*P < 0.05 versus WT + sham.
**P < 0.05 versus WT + Nx, n = 5.
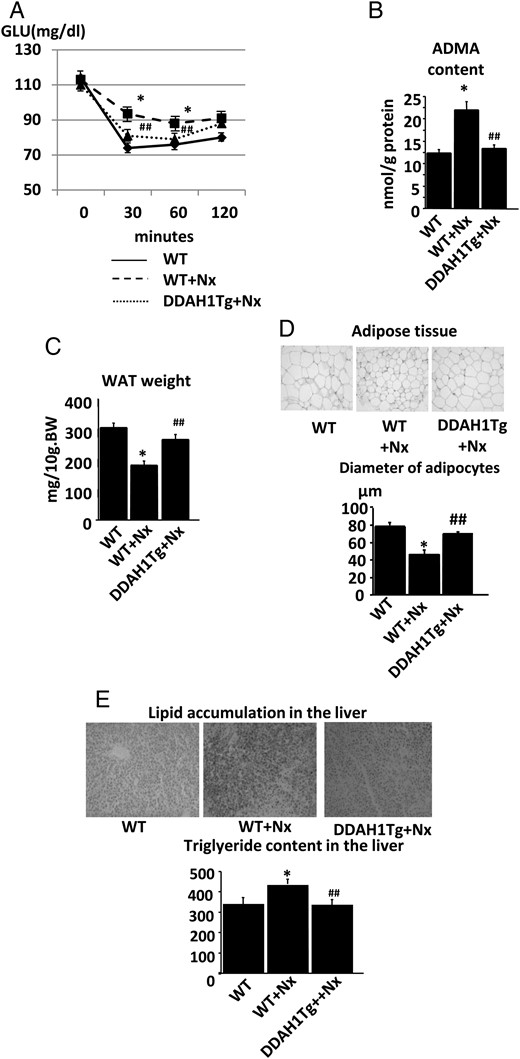
DDAH1 Tg mice reversed the lipodystrophic-like phenotype in renal insufficiency. (A) The results of the insulin tolerance test in DDAH1 Tg mice. The IR in WT littermates after Nx was ameliorated in DDAH1 Tg mice. (B) The ADMA content in the adipose tissue of DDAH1 Tg mice. The accumulation of ADMA in WT littermates after Nx was ameliorated in DDAH1 Tg mice. (C) The weight of white adipose tissue (WAT) in DDAH1 Tg mice. The adipose tissue atrophy in WT littermates after Nx was ameliorated in DDAH1 Tg mice. (D) The size of adipocytes in DDAH1 Tg mice. The decrease in adipocyte diameters in WT littermates after Nx was reversed in DDAH1 Tg mice. (E) The lipid accumulation in the liver in DDAH1 Tg mice. The ectopic lipid deposition in WT littermates after Nx was ameliorated in DDAH1 Tg mice. *P < 0.05 versus WT littermate without Nx, ##P < 0.01 versus WT littermate with Nx, n = 6. Data are presented as mean ± SEM.
DISCUSSION
Lipodystrophy is an acquired or congenital condition characterized by abnormal or degenerative changes of adipose tissue, leading to partial or complete loss of white adipose tissue [4]. Due to the functional impairment of adipose tissue, lipodystrophy is often associated with IR, dyslipidemia and ectopic lipid accumulation. Emerging evidence suggests that CKD might be a state of acquired lipodystrophy, leading to ectopic lipid deposition [6, 7]. Potential mechanisms for lipodystrophy have been attributed to the dysfunction of mature adipocytes [32] and/or abnormal lipoprotein metabolism [5, 33, 34]. In the present study, we demonstrated a defect in the maturation of adipose tissue due to either the dysregulation of endogenous NO signaling or an oxidative stress increase at the early stages of renal failure. Our study implies the possibility that these phenotype changes might occur in the absence of the increase in plasma uremic toxin levels and that metabolic dysregulation initiates before the evidence of systemic uremic condition.
Our model was one with mild renal insufficiency, where serum creatinine levels increased by only 1.6-fold. We performed 5/6th nephrectomy that usually [35], but not always [36], induces severe renal failure. It is possible that complete 5/6th nephrectomy was not consistently performed in all of our rats or that all rats were subjected to milder nephrectomy. We recently reported a similar experimental setting in an independent study [37]. Therefore, Nx rats exhibited a marginal increase in serum creatinine levels and urinary protein excretion. They did not exhibit significant body weight loss, blood pressure elevation or increase in plasma ADMA levels. Despite this, the important observation is that even in this mild renal insufficiency, metabolic changes induced by renal failure are still apparent. This observation was similar to the previous reports where ectopic lipid accumulation was evident in uninephrectomized rats [6, 7]. Probably, as uremia progressed, IR in the muscle is evident as recently shown in the subtotally nephrectomized mice with severe renal failure [38].
Our model of mild renal insufficiency presented with glucose intolerance and IR, although the defect in insulin signaling was documented mainly in the adipose tissues. It seemed to be hard to explain systemic glucose intolerance only by the defect in glucose disposal in adipose tissues since it has been suggested that skeletal muscle accounts for 70–90% of glucose disposal following a carbohydrate load [39, 40]. However, the fraction of insulin-stimulated glucose uptake in adipose tissue increases with duration of insulin elevation [41]. Fat clearly plays an important role in overall glucose homeostasis, as indicated by the IR associated with obesity, various syndromes of lipodystrophy [42] and the IR observed in mice with a fat-specific knockout of GLUT4 [43]. In this study, renal insufficiency induced adipose tissue IR and the decrease in GLUT1 and GLUT4 expressions. This could be a potential explanation for the glucose intolerance.
In addition to the contribution to systemic glucose intolerance, the defect in insulin signaling in adipose tissue leads to abnormal fat maturation as indicated by the decrease in the expression levels of adipocyte differentiation markers. These data were similar to the results of fat-specific insulin receptor knockout mice, where body fat mass is markedly reduced [34]. We also observed the increased populations of small-sized adipocytes. Recent study has revealed that small-sized adipocytes represent immature cells with impaired ability to store TG [44, 45]. Several human studies lend support for the notion that small-sized adipocytes characterize impaired adipogenesis by virtue of cellular IR in that they showed decreased expressions of differentiation and fat storage genes [45]. A recent study also implies that smaller sized adipocytes fractionated from rat adipose tissues exhibit increased expression of inflammatory genes [46]. Therefore, occult inflammatory response in the adipose tissue in CKD resulted in increased populations of small-sized adipocytes.
We demonstrated that inhibitory effects of ADMA on adipocyte differentiation was reversed by cGMP. NO has been shown to activate soluble guanylate cyclase and promote adipocyte differentiation in a rat tissue culture system [47, 48]. Therefore, ADMA inhibits adipogenesis through its effects on NOS activity and on NO bioavailability. Moreover, insulin-induced Akt activation is required for normal adipogenesis [39, 49], and NO has been shown to activate the PI3-kinase/Akt pathway in a cGMP-dependent fashion in several other cells [50, 51]. Taken together, ADMA blocks adipogenesis by its inhibitory effects on NO bioavailability and insulin-induced PI3-kinase/Akt activation. Since PI3-kinase also activates PDK-1, another serine/threonine kinase, which then phosphorylates Akt after insulin stimulation [52], the decrease in the phosphorylation of both PDK-1 and Akt (Figure 1C and D, respectively) reinforces the notion that the accumulation of ADMA in adipocytes blocks insulin signaling at the levels of PI3-kinase in CKD rats.
In our study, ADMA levels of adipose tissue increased in CKD rats, reaching 13.1 nmol/g protein. This value corresponds to ∼10–100 µmol/L in the adipose tissues and 10–100 times higher than plasma ADMA levels, indicating the importance of intracellular ADMA levels. We previously reported that in the CKD model, the expression of DDAH2 in the kidney [12] or endothelium [13] was downregulated, leading to the impairment of endothelium-dependent vasodilatation. Our data demonstrated that the effects of dysregulation of the tissue ADMA/DDAH system are functionally relevant in terms of the metabolic disorders in CKD. The results obtained in both DDAH1 and DDAH2 Tg mice in the present study indicate the causal link between this dysregulation and metabolic abnormalities in CKD rats. We suspect the increased oxidative stress levels as a cause for the dysregulation of the ADMA/DDAH pathway. A recent study reports that, in a CKD model, tissue ADMA concentration in the kidney increased by the downregulation of DDAH1 through the excessive oxidative stress [53]. Several other studies also demonstrated the regulation of DDAH1 and DDAH2 by cellular oxidative stress levels [53]. Adipose tissue has been shown to be sensitive to oxidative stress and these damages cause the impairment of glucose or lipid metabolism in pathological settings [54, 55]. In uremic state, tissue oxidative stress levels increase in the cardiovascular systems or kidneys [56]. Collectively, we concluded that the increase in oxidative stress levels of adipose tissue was the mechanism for the initiation of metabolic disturbances in CKD.
The next question to be addressed is about the mechanism for the increase in oxidative stress in adipose tissue. The accumulation of uremic toxins is supposedly attributed to an increase in tissue ROS in a CKD condition. One of the uremic toxins, IS, has been shown to be introduced into the cell through organic anion transports [57], activating AhR [58] and provoking oxidative stress [59, 60], as well as increasing AhR expression and activating the AhR-mediated pathway. The activation of AhR is involved in the negative regulation of adipose differentiation in 3T3-L1 cells [61] and IS depleted NO bioavailability in other cell types [62]. In our study, the increase in IS accumulation, upregulation of AhR and the increase in oxidative stress were evident in the adipose tissue of Nx rats. These pathological changes were presumably primary events leading to the phenotypic changes of adipose tissues.
One of the clinical relevancies of the defect in adipose tissue maturation is supposed to be the comorbidity of ectopic lipid accumulation. The growing numbers of clinical evidences have recently unveiled the relationship between CKD and fatty liver or nonalcoholic steatohepatitis (NASH) [63]. Since the proposed mechanisms were the inflammation status in NASH inducing kidney damages and CKD, these studies documented the impaired kidney function in NASH or fatty liver patients [64]. On the other hand, a recent study described the reverse causation where CKD patients tend to suffer from fatty liver or liver damages [65]. Our study provides a potential mechanism for this reverse association revealed in CKD patients.
In conclusion, we demonstrated that dysregulation of the ADMA/DDAH pathway in the early stage of renal insufficiency induces the lipodystrophy-like phenotype, which constitutes novel CKD-associated metabolic abnormalities and organ damages, including liver lipid accumulation. We provided a novel therapeutic target against CKD-mediated systemic complications.
SUPPLEMENTARY DATA
Supplementary data are available online at http://ndt.oxfordjournals.org.
CONFLICT OF INTEREST STATEMENT
All the authors declare no competing interests. We declare that the results presented in this paper have not been published previously in whole or part, except in abstract format.


Comments