


Abstract
An epidemic of chronic kidney disease (CKD) of non-traditional aetiology has been recently recognized by health authorities as a public health priority in Central America. Previous studies have identified strenuous manual work, agricultural activities and residence at low altitude as potential risk factors; however, the aetiology remains unknown. Because individuals are frequently diagnosed with CKD in early adulthood, we measured biomarkers of kidney injury among adolescents in different regions of Nicaragua to assess whether kidney damage might be initiated during childhood.
Participants include 200 adolescents aged 12–18 years with no prior work history from four different schools in Nicaragua. The location of the school served as a proxy for environmental exposures and geographic locations were selected to represent a range of factors that have been associated with CKD in adults (e.g. altitude, primary industry and CKD mortality rates). Questionnaires, urine dipsticks and kidney injury biomarkers [interleukin-18, N-acetyl-d-glucosaminidase (NAG), neutrophil gelatinase-associated lipocalin (NGAL) and albumin–creatinine ratio] were assessed. Biomarker concentrations were compared by school using linear regression models.
Protein (3.5%) and glucose (1%) in urine measured by dipstick were rare and did not differ by school. Urine biomarkers of tubular kidney damage, particularly NGAL and NAG, showed higher concentrations in those schools and regions within Nicaragua that were defined a priori as having increased CKD risk. Painful urination was a frequent self-reported symptom.
Although interpretation of these urine biomarkers is limited because of the lack of population reference values, results suggest the possibility of early kidney damage prior to occupational exposures in these adolescents.
INTRODUCTION
An epidemic of chronic kidney disease (CKD) of non-traditional aetiology (CKDnt), also referred to as Mesoamerican Nephropathy (MeN), is occurring in Central America [1–4]. CKD constitutes the second leading cause of death among adult males in El Salvador, and the prevalence of the disease is 20% or greater in some communities in El Salvador and Nicaragua [5, 6]. In addition to the toll on the health of the population, the epidemic has had a substantial negative impact on the social and economic well-being of the affected communities. The Pan-American Health Organization recently recognized this new entity as a regional public health priority [7].
Mortality data and community prevalence studies indicate that young men (typically diagnosed during their 20s and 30s) who engage in strenuous outdoor work (e.g. agriculture and mining) and live in the lowlands of the Pacific coast are among the most affected; the disease has been reported most frequently among sugar cane workers [5, 6, 8–13]. MeN has been described as a tubulointerstitial, non-proteinuric nephropathy with neither diabetes nor hypertension as a primary cause [1, 3, 14, 15].
Although clusters of CKD have been described, such as Balkan Endemic Nephropathy, where aristolochic acid has been identified as the main cause [3], the cause of MeN remains unknown and most researchers believe that the aetiology is multifactorial [14, 16]. A variety of hypothesized causes have been proposed, such as heat and heavy physical workload combined with chronic volume depletion; heavy metals, particularly arsenic; agrichemicals; systemic infectious diseases (e.g. leptospirosis); chronic intake of potential nephrotoxic medications, such as non-steroidal anti-inflammatory drugs (NSAIDs) or aminoglycoside antibiotics and fructose intake [3, 14, 15, 17–19]. Studies to date have focussed on the general adult population or on workers in occupational settings. However, because many affected individuals are diagnosed with CKD in early adulthood, not infrequently in their early 20s, we hypothesized that initial kidney damage may begin in childhood prior to entering the workforce. The aim of this exploratory study was to assess the presence of subclinical kidney damage in childhood among Nicaraguan adolescents living in regions with different CKD mortality rates. Because a rise in serum creatinine is a relatively late finding in the development of CKD, we used novel biomarkers of early kidney damage as the primary measure of outcome.
The biomarkers studied in this pilot assessment were carefully selected based on their pathogenic role in acute kidney injury, helping identify specific sites of injury in the nephron. Urine biomarkers measured in this study included albumin–creatinine ratio (ACR), a traditional marker of increased glomerular permeability and disease [20]; neutrophil gelatinase-associated lipocalin (NGAL), a protein released into plasma and urine following distal tubule injury [21]; N-acetyl-d-glucosaminidase (NAG), a marker of proximal tubular epithelial cell damage [22] and interleukin-18 (IL-18), a cytokine marker of tubule inflammation and necrosis, which is excreted in the urine following proximal tubule injury [23].
MATERIALS AND METHODS
Study design
We conducted a cross-sectional study among adolescents aged 12–18 years in four different schools in Nicaragua (Figure 1). Schools served as a proxy for environmental exposures and were selected to represent a range of factors that have been associated with CKDnt among adults. For example, several studies have documented an inverse association between altitude of residence and CKD [5, 6, 11] and increased risks in different occupations, such as sugar cane, mining and other jobs involving strenuous manual labour [5, 6]. Based on these factors and CKD mortality data from the Nicaraguan Ministry of Health [24], schools were assigned an a priori ranking based on increasing CKD risk in that locality. School 1, which served as the reference category, was located in the department of Jinotega (2011 CKD mortality rate of nine deaths per 100 000 inhabitants) at an altitude of 800 m above sea level and surrounded by coffee plantations. School 2 was located in the department of Masaya (12 CKD deaths/100 000) at 220 m above sea level, in an area near the Pacific coast dedicated to small farms and artisan-related occupations. Schools 3 and 4 were both based in the same city in the department of Chinandega (103 CKD deaths/100 000), an area near the Pacific coast located almost at sea level, and characterized by extensive production of sugar cane. School 4 participants were restricted to students whose parents (one or both) had worked in the sugar cane industry. At Schools 1–3, we excluded children if either parent had ever worked in the sugar cane industry.
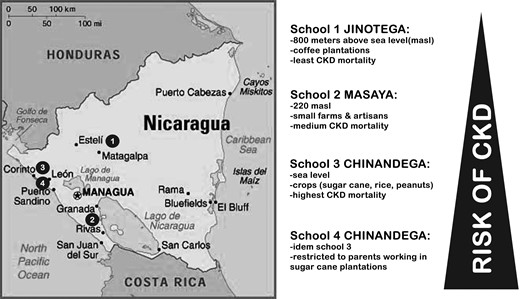
Map of the study population.
The study protocol was approved by the Institutional Review Boards at the Boston University Medical Center and the Nicaraguan Ministry of Health. Parents of each study participant provided written informed consent for their own participation and permission for their child's participation, and participants themselves provided written assent.
Study population
The recruitment process was coordinated with the Ministry of Education's officials and the teachers at each school. Our goal was to recruit at least 50 participants at each school, with equal distributions by sex and age (12–15, 16–18). To be eligible, students must have never worked in a manual labour job (defined as at least 1 month of manual labour, whether paid or not). Students who had participated in sports or vigorous exercise on the day of sample collection, and female students who reported menstruating at the time of collection, were also excluded. Eligibility was determined based on parents' and students' responses to brief questionnaires.
Sample collection
Clean catch morning urine samples were collected without preservative during the last 2 weeks of October 2011. Samples were collected in the morning before classes started to increase the likelihood that students would not have already participated in vigorous physical activity. Samples were immediately placed on dry ice and transported on the day of collection to the National Laboratory Center for Diagnostic and References in Managua. Samples were stored at −80°C for 11–31 days and sent to the Division of Nephrology and Hypertension at the Cincinnati Children's Hospital Medical Center (Cincinnati, OH) for analysis.
Sample analysis
Urine dipstick (Combur 10UX®, Roche Diagnostics) analyses were conducted in the field using a urine strip reader (Urisys 1100, Roche Diagnostics). Urine albumin and creatinine were measured by immunoturbidimetry and a colorimetric modification of the Jaffe reaction, respectively, on a Siemens Dimension Xpand plus HM chemistry analyser (Siemens Healthcare Diagnostics, Deerfield, IL). NAG activity was measured using a colorimetric assay (Roche Diagnostics, USA). NGAL (Bioporto, Gentofte, Denmark) and IL-18 (MBL, Intl., Woburn, MA) were measured by enzyme-linked immunosorbent assay. Limits of detection (LOD) concentrations were as follows: NAG (0.003 mU/mL), NGAL (1.6 pg/mL), albumin (1.3 ng/mL) and IL-18 (2.99 pg/mL). The time between urine collection and analysis of biomarkers ranged from 30 to 45 days.
Data analysis
Data were analysed using SPSS statistical software (version 18). Biomarkers were normalized for urine creatinine concentration. When the reported value was less than the LOD, the LOD/√2 was substituted [25]. The distribution of each biomarker was characterized using graphical displays and summary statistics. All four urine biomarkers exhibited a lognormal distribution and were natural log-transformed prior to analysis to satisfy normality assumptions.
Linear regression models were used to assess potential predictors of the dependent variable, biomarkers of kidney damage. The primary predictor of interest (or independent variable in the models) was school (four categories), which served as a proxy for the region of residence and for differential environmental exposures and/or parents' occupations. Because the biomarker concentrations had been log-transformed, the exponentiated β estimates (eβ) can be interpreted as multiplicative differences or the ratio of the mean value for each index variable category compared with the mean of the reference variable category (mean ratios). We also assessed sex and age as secondary predictors of biomarker levels. Fathers' education and length of residence were included in the models to adjust for confounding based on their effect on the estimate of association (>10% change) between school and the kidney damage biomarkers. Finally, we also conducted linear regression analyses of the association between kidney injury biomarkers and selected parameters measured by urine dipstick.
RESULTS
Population characteristics
We enrolled 245 students from whom we randomly selected 50 students per school equally distributed by sex and age category (total N = 200). A flow chart of the study population at different stages is shown in Figure 2.
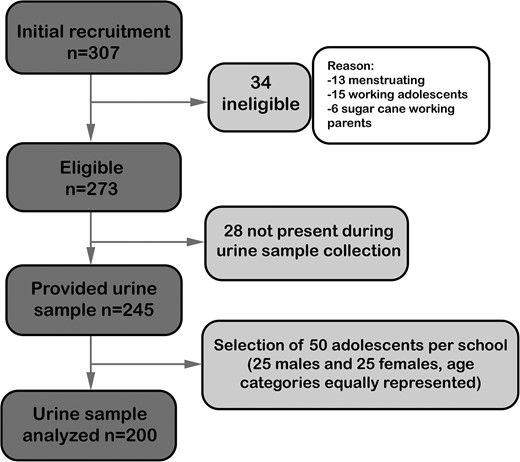
Adolescent study population flow chart.
Table 1 summarizes the demographics of the study population and relevant information on the adolescents' and their parents' health. Parents of students in School 4 had less formal education than in the other schools. At School 4, where almost all parents were sugar cane workers, 11% of students' fathers had died compared with 4–6% at the other schools; similarly, 40% of fathers at School 4 reported CKD, compared with 0–6% at the other schools. CKD and deaths were unusual among mothers, regardless of school. Self-reported urinary symptoms or kidney problems were common among adolescents but did not differ by school.
Characteristics of the study population (adolescents and parents)
| Schools | Total (N = 200a), n (%) | ||||
|---|---|---|---|---|---|
| 1. Jinotega (n = 50a), n (%) | 2. Masaya (n = 50a), n (%) | 3. Chinandega (n = 50a), n (%) | 4. Chinandega (n = 50a), n (%) | ||
| Adolescents | |||||
| Sex | |||||
| Male | 25 (50%) | 25 (50%) | 25 (50%) | 25 (50%) | 100 (50%) |
| Female | 25 (50%) | 25 (50%) | 25 (50%) | 25 (50%) | 100 (50%) |
| Age group | |||||
| 12–15 years | 26 (52%) | 25 (50%) | 27 (54%) | 25 (50%) | 103 (51.5%) |
| 16–18 years | 24 (48%) | 25 (50%) | 23 (46%) | 25 (50%) | 97 (48.5%) |
| Symptoms | |||||
| Pain while urinating | |||||
| Never | 38 (60%) | 21 (40%) | 30 (48%) | 44 (66%) | 133 (54%) |
| 1–2/year | 19 (30%) | 19 (37%) | 17 (27%) | 13 (19%) | 68 (28%) |
| 1–2/month | 5 (8%) | 8 (15%) | 11 (18%) | 5 (7.5%) | 29 (12%) |
| 1 week | 1 (2%) | 4 (8%) | 4 (7%) | 5 (7.5%) | 14 (6%) |
| Kidney problems | |||||
| Reported by either adolescent or parent | 7 (14%) | 7 (14%) | 9 (18%) | 6 (12%) | 29 (14.5%) |
| Parents | |||||
| Years lived in the same region | |||||
| <5 | 0 (0%) | 1 (2%) | 0 (0%) | 0 (0%) | 1 (0.5%) |
| 5–9 | 0 (0%) | 0 (0%) | 2 (4%) | 0 (0%) | 2 (1%) |
| 10–19 | 9 (18%) | 12 (25%) | 14 (29%) | 14 (29%) | 49 (25%) |
| 20+ | 41 (82%) | 35 (73%) | 33 (67%) | 35 (71%) | 144 (73.5%) |
| Father's education | |||||
| No school | 1 (2%) | 2 (5%) | 4 (8.7%) | 5 (11%) | 12 (7%) |
| Primary | 11 (23%) | 18 (45%) | 10 (21.7%) | 20 (44%) | 59 (33%) |
| Secondary | 27 (56%) | 13 (3.5%) | 21 (45.7%) | 19 (41%) | 80 (44%) |
| University/professional | 9 (19%) | 7 (17.5%) | 11 (23.9%) | 2 (4%) | 29 (16%) |
| Mother's education | |||||
| No school | 0 (0%) | 1 (2%) | 0 (0%) | 3 (7%) | 4 (2%) |
| Primary | 14 (29%) | 16 (39%) | 17 (35%) | 26 (59%) | 73 (40%) |
| Secondary | 21 (44%) | 15 (37%) | 23 (47%) | 15 (34%) | 74 (41%) |
| University/professional | 13 (27%) | 9 (22%) | 9 (18%) | 0 (0%) | 31 (17%) |
| Sugar cane parent job | |||||
| Father or mother worked in sugar cane | 0 (0%) | 0 (0%) | 0 (0%) | 47 (94%) | 47 (23.5%) |
| Father | |||||
| CKD | 3 (6%) | 0 (0%) | 3 (6%) | 17 (40%) | 23 (14%) |
| Kidney stones | 6 (13%) | 1 (2%) | 1 (2%) | 3 (7%) | 11 (6%) |
| Hypertension | 6 (13%) | 6 (18%) | 5 (10%) | 7 (17%) | 24 (14%) |
| Diabetes | 6 (13%) | 3 (10%) | 4 (8%) | 3 (7%) | 16 (10%) |
| Deceased | 2 (4%) | 3 (6%) | 2 (4%) | 5 (11%) | 12 (6%) |
| Mother | |||||
| CKD | 3 (6%) | 2 (6%) | 1 (2%) | 3 (7%) | 9 (5%) |
| Kidney stones | 5 (10%) | 4 (12%) | 1 (2%) | 3 (7%) | 13 (8%) |
| Hypertension | 11 (24%) | 10 (26%) | 7 (15%) | 9 (22%) | 37 (21%) |
| Diabetes | 2 (4%) | 1 (3%) | 4 (8%) | 4 (10%) | 11 (6%) |
| Deceased | 0 (0%) | 0 (0%) | 2 (4%) | 2 (4%) | 4 (2%) |
aNote that events for certain variables do not sum up to total sample size due to missing values.
Dipstick
Dipstick parameters were similar across schools except for urine specific gravity (SG) and pH (Table 2). The percentage of students with lower SG increased in a monotonic dose–response fashion and was substantially higher at School 4 (P = 0.019). Conversely, students from School 1 were much more likely to have acidic urine than students at the other three schools (P = 0.034). Differences by sex were also observed. A higher proportion of girls than boys had a concentrated urine with SG of 1.020 or higher (38 versus 21%, respectively; P < 0.001). Nitrites were detected only in four adolescents (2%), and 21 adolescents (10.5%) had a positive leucocyte esterase, of whom 20 were females evenly distributed among schools. Twenty-two (11%) adolescents tested positive for haemoglobinuria, with 19 being females evenly distributed among schools. Protein (seven cases, 3.5%) or glucose (two cases, 1%) were rarely present.
Urine dipstick measures and ACR by school and sex
| Schools (department) | Sex | Total (N = 200), n (%) | |||||
|---|---|---|---|---|---|---|---|
| 1. Jinotega (n = 50), n (%) | 2. Masaya (n = 50), n (%) | 3. Chinandega (n = 50), n (%) | 4. Chinandega (n = 50), n (%) | Females (n = 100), n (%) | Males (n = 100), n (%) | ||
| Urine SG | |||||||
| 1005–1010 | 15 (30%) | 19 (38%) | 21 (42%) | 29 (58%) | 33 (33%) | 51 (51%) | 84 (42%) |
| 1015–1020 | 29 (58%) | 24 (48%) | 27 (54%) | 21 (42%) | 54 (54%) | 47 (47%) | 101 ( 50.5%) |
| 1025–1030 | 6 (12%) | 7 (14%) | 2 (4%) | 0 (0%) | 13 (13%) | 2 (2%) | 15 (7.5%) |
| pH | |||||||
| 5 | 34 (68%) | 25 (50%) | 22 (44%) | 12 (24%) | 56 (56%) | 37 (37%) | 93 (46.5%) |
| 6 | 10 (20%) | 10 (20%) | 14 (28%) | 20 (40%) | 21 (21%) | 33 (33%) | 54 (27%) |
| 6.5 | 1 (2%) | 3 (6%) | 3 (6%) | 5 (10%) | 4 (4%) | 8 (8%) | 12 (6%) |
| 7 | 4 (8%) | 8 (16%) | 7 (14%) | 9 (18%) | 11 (11%) | 17 (17%) | 28 (14%) |
| 8 | 1 (2%) | 4 (8%) | 4 (8%) | 4 (8%) | 8 (8%) | 5 (5%) | 13 (6.5%) |
| Leucocyte esterase | |||||||
| Negative | 44 (88%) | 44 (88%) | 45 (90%) | 46 (92%) | 80 (80%) | 99 (99%) | 179 (89.5%) |
| Positive | 6 (12%) | 6 (12%) | 5 (10%) | 4 (8%) | 20 (20%) | 1 (1%) | 21 (10.5%) |
| Nitrite | |||||||
| Negative | 50 (100%) | 49 (98%) | 49 (98%) | 48 (96%) | 99 (99%) | 97 (97%) | 196 (98%) |
| Positive | 0 (0%) | 1 (2%) | 1 (2%) | 2 (4%) | 1 (1%) | 3 (3%) | 4 (2%) |
| Blood | |||||||
| Negative | 43 (86%) | 43 (86%) | 46 (92%) | 46 (92%) | 81 (81%) | 97 (97%) | 178 (89%) |
| Positive | 7 (14%) | 7 (14%) | 4 (8%) | 4 (8%) | 19 (19%) | 3 (3%) | 22 (11%) |
| Glucose | |||||||
| Negative | 50 (100%) | 48 (96%) | 50 (100%) | 50 (100%) | 99 (99%) | 99 (99%) | 198 (99%) |
| Positive | 0 (0%) | 2 (4%) | 0 (0%) | 0 (0%) | 1 (1%) | 1 (1%) | 2 (1%) |
| Protein | |||||||
| Negative | 50 (100%) | 46 (92%) | 48 (96%) | 49 (98%) | 98 (98%) | 95 (95%) | 193 (96.5%) |
| Positive | 0 (0%) | 4 (8%) | 2 (4%) | 1 (2%) | 2 (2%) | 5 (5%) | 7 (3.5%) |
| ACR μg/mg (urine biomarker) | |||||||
| 0–29 | 43 (86%) | 46 (92%) | 48 (96%) | 47 (94%) | 92 (92%) | 92 (92%) | 184 (92%) |
| 30–300 | 7 (14%) | 4 (8%) | 2 (4%) | 2 (4%) | 8 (8%) | 7 (7%) | 15 (7.5%) |
| +300 | 0 (0%) | 0 (0%) | 0 (0%) | 1 (2%) | 0 (0%) | 1 (1%) | 1 (0.5%) |
Urinary biomarkers
Sixteen students (8%) had an ACR in the range of albuminuria (≥30 μg/mg of creatinine), with only one higher than 300 μg/mg (a boy from School 4). Presence of albuminuria did not differ by school (Table 2).
Table 3 shows the multivariable adjusted linear regression models evaluating the association between participant characteristics and urine biomarker concentrations. Boys at School 4 had elevated levels of all three biomarkers (NGAL, NAG and IL-18) compared with boys at School 1. Girls at School 4 only had increased NAG, while the concentration of IL-18 was lower than at School 1 [adjusted relative mean (RM): 0.48, 95% confidence interval (95% CI): 0.29–0.80]. At School 3, both boys and girls had higher concentrations of NAG than at School 1 (RM: 2.40, 95% CI: 1.18–4.86 for boys; RM: 2.01, 95% CI: 1.36–2.96 for girls). Results were similar when the biomarker concentrations were not normalized for urine creatinine concentration (data not shown).
Urine biomarker's median and RM concentrations, by sex, age and school
| N | IL-18 | NGAL | NAG | ACR | |||||
|---|---|---|---|---|---|---|---|---|---|
| Median (IQR) pg/mg creatinine | Adjusted RM (95% CI) | Median (IQR) ng/mg creatinine | Adjusted RM (95% CI) | Median (IQR) mU/mg creatinine | Adjusted RM (95% CI) | Median (IQR) μg/mg creatinine | Adjusted RM (95% CI) | ||
| Overall | 200 | 56.7 (28.9–122.8) | N/A | 13.3 (6.3–28.1) | N/A | 1.5 (1.0–2.2) | N/A | 6.2 (4.6–10.5) | N/A |
| Sex | |||||||||
| F | 100 | 117.7 (66.5–178.8) | Reference | 25.7 (15.6–49.6) | Reference | 1.6 (1.2–2.2) | Reference | 7.5 (5.4–11.5) | Reference |
| M | 100 | 32.3 (21.3–53.1) | 0.28 (0.22–0.36)a | 7.0 (4.2–10.9) | 0.26 (0.20–0.32)a | 1.4 (1.0–2.1) | 0.76 (0.55–1.05)a | 5.2 (4.1–7.7) | 0.86 (0.64–1.15)a |
| Age | |||||||||
| 1-Year increments | 200 | N/A | 0.97 (0.90–1.04)a | N/A | 1.09 (1.02–1.16)a | N/A | 0.92 (0.84–1.01)a | N/A | 0.96 (0.88–1.04)a |
| School | |||||||||
| 1. Jinotega | 50 | 54.1 (34.5–165.4) | Reference | 12.0 (6.8–26.1) | Reference | 1.3 (0.5–2.2) | Reference | 5.3 (4.0–17.4) | Reference |
| 2. Masaya | 50 | 41.9 (20.4–119.3) | 0.66 (0.46–0.95)b | 13.1 (6.2–21.9) | 0.95 (0.68–1.33)b | 1.3 (0.9–1.6) | 1.29 (0.83–2.00)b | 7.1 (5.1–8.8) | 0.96 (0.63–1.47)b |
| 3. Chinandega | 50 | 48.2 (25.4–115.3) | 0.76 (0.54–1.08)b | 11.4 (5.2–38.7) | 0.96 (0.70–1.32)b | 1.6 (1.3–2.1) | 2.05 (1.35–3.11)b | 6.1 (4.6–10.3) | 0.89 (0.59–1.33)b |
| 4. Chinandega | 50 | 78.8 (38.3–121.1) | 0.93 (0.65–1.34)b | 15.1 (8.2–34.2) | 1.42 (1.02–1.99)b | 2.2 (1.4–3.1) | 2.97 (1.91–4.62)b | 6.0 (4.7–10.8) | 0.91 (0.59–1.40)b |
| Sex: female | |||||||||
| School | |||||||||
| 1. Jinotega | 25 | 161.2 (103.1–222.2) | Reference | 26.1 (17.3–47.0) | Reference | 1.2 (0.5–2.0) | Reference | 8.6 (5.4–26.1) | Reference |
| 2. Masaya | 25 | 118.6 (47.7–237.2) | 0.67 (0.41–1.10)c | 18.0 (11.7–27.5) | 0.76 (0.46–1.26)c | 1.4 (0.9–1.7) | 1.25 (0.84–1.86)c | 7.2 (5.0–9.0) | 0.67 (0.40–1.12)c |
| 3. Chinandega | 25 | 112.6 (57.9–142.5) | 0.64 (0.39–1.04)c | 37.6 (18.7–67.0) | 1.28 (0.78–2.12)c | 1.8 (1.4–2.5) | 2.01 (1.36–2.96)c | 7.2 (5.6–11.1) | 0.73 (0.44–1.21)c |
| 4. Chinandega | 25 | 93.4 (52.2–147.3) | 0.48 (0.29–0.80)c | 26.1 (16.3–77.3) | 1.42 (0.84–2.41)c | 2.2 (1.7–3.9) | 2.52 (1.67–3.79)c | 7.4 (5.5–10.9) | 0.87 (0.51–1.47)c |
| Sex: male | |||||||||
| School | |||||||||
| 1. Jinotega | 25 | 36.3 (24.3–42.8) | Reference | 6.9 (5.0–9.7) | Reference | 1.5 (0.4–2.7) | Reference | 4.7 (3.5–5.3) | Reference |
| 2. Masaya | 25 | 22.2 (9.1–38.24) | 0.60 (0.36–1.00)c | 7.4 (3.7–13.9) | 1.35 (0.86–2.11)c | 1.2 (0.7–1.5) | 1.54 (0.70–3.41)c | 7.1 (5.3–8.9) | 1.49 (0.74–3.01)c |
| 3. Chinandega | 25 | 25.5 (21.6–42.2) | 0.87 (0.55–1.37)c | 5.5 (2.9–6.8) | 0.77 (0.52–1.15)c | 1.5 (1.2–1.9) | 2.40 (1.18–4.86)c | 4.9 (4.1–7.5) | 1.08 (0.58–2.02)c |
| 4. Chinandega | 25 | 68.2 (27.4–97.3) | 1.52 (0.93–2.50)c | 8.3 (6.4–13.1) | 1.56 (1.01–2.40)c | 1.9 (1.3–2.9) | 3.67 (1.70–7.93)c | 5.5 (3.9–9.7) | 1.10 (0.55–2.17)c |
CI, confidence interval; IQR, interquartile range; N/A, not applicable; RM, relative mean.
aVariables included in the model: sex, age, length of residence in the same address and father's education.
bVariables included in the model: sex, age, length of residence in the same address, father's education and school.
cVariables included in the model: age, length of residence in the same address, father's education and school.
Boys had significantly lower mean normalized concentrations of all tubular biomarkers (IL-18, NAG and NGAL) than girls. Boys had similar ACR mean concentrations compared with girls (RM = 0.86, 95% CI: 0.64–1.15).
We further analysed whether leucocyte esterase positivity and haematuria in females were associated with biomarkers of kidney injury. The mean of NGAL values was 2.13 times as high (95% CI: 1.46–3.12) in leucocyte esterase positive females, but there were no differences for any of the other biomarkers. Mean IL-18 levels were higher in females with haematuria (RM = 1.64, 95% CI: 1.10–2.44), again with no difference for other biomarkers. Lastly, urine biomarkers of kidney injury were not associated with any kidney or urinary problems reported by either parents or children.
DISCUSSION
This study of adolescents from three different regions of Nicaragua is the first to investigate the presence of early kidney injury at a young age as a potential contributor to CKDnt. Our main hypothesis was that students who attended school in areas of higher adult CKD mortality would have higher concentrations of biomarkers of kidney injury than students in areas of lower mortality, as a reflection of environmental exposures outside of the workplace and/or genetic influences. Results from the study were consistent with this hypothesis. Children in Schools 3 and 4, both located in a region of high adult CKD mortality, generally had elevated biomarker levels compared with the other two schools, but it was also the case that children in School 4, whose parents had worked in sugar cane, tended towards higher concentrations of NGAL and NAG than children in School 3, even though both schools are located in the same municipality. The increased urine concentrations of markers of tubular injury, but not albuminuria, is consistent with histopathological [26, 27] and longitudinal [28] studies that indicate the disease is tubulointerstitial in origin.
Instead of serum creatinine, the traditional marker used to assess reduced kidney function, we used relatively novel biomarkers of kidney damage that are sensitive markers of acute kidney injury and may also be able to predict progression to adverse clinical outcomes [29] and long-term kidney function decline in some studies [30]. In a prior study of adult workers in Nicaragua conducted by our group, those engaged in certain tasks showed a more pronounced decrease in their kidney function associated with an elevation of some of these urine biomarkers [31]. Interpretation of the results, however, remains a challenge because of the lack of reference values for these biomarkers. There are several studies of urinary NGAL and NAG in healthy children and/or adolescents [22, 32–39]. However, direct comparisons between our data and these published studies are limited by differences in age distribution, ethnic composition, clinical characteristics of the populations studied, as well as whether the values reported are normalized for creatinine excretion. Results of available NGAL and NAG studies have shown wide variability, likely due at least in part to the type of assays for biomarker levels [40], and the fact that concentrations are very low for some biomarkers (such as NGAL and IL-18, measured in ng/mL and pg/mL, respectively). For example, comparing our findings with values reported in other studies, the median urine NGAL/Cr ratio for girls across all four schools (25.7 ng/mg) would be well above the 97.5th percentile, while the median ratio for boys would be above the 75th percentile for both age groups when compared with results of a study of 172 healthy children and adolescents in Poland [34] but would not be abnormal compared with other populations [32, 33, 39]. Similarly, in a study [22] of 49 healthy children aged 10–18 years in the Czech Republic, the mean urinary NAG/Cr was 1.76 U/g. A median of 1.4 U/g, and a range of 0.1–7.8 U/g, was reported in a 5-year study [36] of 534 children in New England (USA). The highest NAG/Cr values in our study were from School 4 with a median value of 2.2 U/g (range: 1.4–3.1 U/g).
Notably, several additional clinical characteristics are consistent with the observed differences in tubular injury markers in children from low-risk versus high-risk schools. We observed a step-wise increase in the fraction of children with dilute urine (SG ≤ 1.01), raising the possibility of impaired urinary concentrating ability in children from high-risk schools. This impairment may be associated with subclinical tubular injury and would certainly predispose individuals to overt kidney injury in the setting of heat stress. Similarly, a marked difference in the fraction of students with maximally acidified urine (68% in School 1 versus 24% in School 4, with intermediate values in Schools 2 and 3) may indicate tubular impairment limiting the kidney's ability to excrete acid in high-risk schools. These suggestive findings raise hypotheses that merit further investigation using more sensitive methods.
Also notable was the high percentage of children that reported frequent (at least monthly) pain while urinating (18%). Dipstick results, though, did not show evidence of lower urinary tract infections (UTI). ‘Chistata’, a common dysuria-like syndrome, probably associated with dehydration and high temperatures, has been reported in the region. Of importance is that chistata, commonly clinically diagnosed as a UTI, is often treated with NSAIDs and antibiotics that could be potentially nephrotoxic [18]. We did not collect data on medication use in the study population.
We also observed remarkable dissimilarities between girls and boys in a range of urinary measures. First, girls were much more likely than boys to have evidence of haematuria and leucocyturia, probably due to sample contamination due to anatomic differences between boys and girls, and menstrual blood (despite menstruation being an exclusion criterion). Second, girls had higher SG than boys. We hypothesize that girls may suffer from relative dehydration compared with boys, which may simply be from fluid restriction due to the greater propensity for girls to avoid using the toilet in a public setting for hygienic or cultural reasons. Third, girls had higher mean levels for all biomarkers (whether or not we adjusted for urine creatinine), with particularly large differences for NGAL and IL-18. These results are in line with results from the study of adult workers in the same region [31], which found that at both pre- and late-harvest, women had NGAL and IL-18 concentrations that were two to three times as high as men, regardless of normalization for urine creatinine, and with those of Pennemans et al. [39] for female adolescents. The findings in our study are counter-intuitive given the disproportionate male incidence of CKDnt among adults. We currently do not have an explanation for this fact, although we note that the multifactorial hypothesis would indicate the presence of a second factor that would likely occur in adulthood and which women may not experience at nearly the same rate as men, particularly if strenuous manual labour or other occupational exposures are responsible.
There are some limitations to our study. First, as already mentioned, the lack of normal values for the concentration of these urinary biomarkers in children and adolescents, as well as their expected variation with age and sex, makes it difficult to establish comparisons with other populations. Second, although these urine biomarkers have been shown to be valid for diagnosis of kidney injury in several perioperative, critical care and ambulatory settings (for example, NGAL clinical use is now approved by the European regulatory agency), more research is needed to ascertain their role in identifying patients at greatest risk for developing CKD [29, 41–43]. Third, urine biomarkers may experience degradation during storage [44]; however, samples were promptly frozen and assayed after a single freeze thaw within a few weeks of acquisition. Additionally, any degradation was unlikely to have differed by school. Fourth, we did not obtain first morning urine samples, which are preferred, as exercise or changes in posture may affect urine biomarkers concentration outputs. Fifth, we did not collect serum and therefore do not have estimates of glomerular filtration rate. However, as children were overall healthy, it is unlikely that any had kidney function that was significantly reduced from expected. Sixth, parents with kidney disease (mostly in School 4) may be more likely to allow their children to participate in the urine screening. While this selection bias may overestimate the prevalence of kidney injury (although it would not explain the also higher levels of biomarkers in School 3), it would still indicate there is a common factor leading to kidney injury in parents and children, either environmental or genetic. Finally, we lack specific individual information on possible exposures that may account for the differences observed.
Overall, our results are consistent with possible early kidney damage in adolescents in Nicaragua and, thus, increased susceptibility for further kidney insults in early adulthood, with higher frequency in those schools and regions within Nicaragua that were defined a priori as at increased CKD risk. If corroborated, this finding could have important implications for identifying factors that might be contributing to the early onset of CKDnt in Central America. Future studies should build on these preliminary findings by incorporating longitudinal follow-up and assessment of specific exposures hypothesized to cause CKDnt.
FUNDING
Funding for this study was provided by the Compliance Advisor/Ombudsman (CAO), the independent accountability mechanism for social and environmental issues of IFC/MIGA of the World Bank Group, and the Comité Nacional de Productores de Azúcar (CNPA). The CAO managed all funds and maintained the contract to conduct the research, with the agreement of both parties involved in a mediation process between a community-based organization of ex-workers of the sugar cane fields suffering from CKD (ASOCHIVIDA) and the Nicaragua Sugar Estates Limited (NSEL). O.R.-R. was also funded by the Enrique Najera predoctoral grant awarded by the Spanish Society of Epidemiology and the Instituto de Salud Carlos III (Spain). R.L.L. was also funded by a National Institutes of Health training grant (T32 ES014562) and a STAR Fellowship Assistance agreement no. FP-91764901-0 awarded by the U.S. Environmental Protection Agency (EPA). C.R.P. is supported by grants from the National Institutes of Health (NIH) K24DK090203 and is a named co-inventor on an IL-18 patient issued to University of Colorado (no financial value).
CONFLICT OF INTEREST STATEMENT
The EPA does not endorse any products or commercial services mentioned in this publication. The views expressed in this publication are solely those of the authors and do not represent those of the institutions that funded the study or where the authors are affiliated.
(See related articles by Campese. The Mesoamerican nephropathy: a regional epidemic of chronic kidney disease? ; Okparavero et al. Prevalence and complications of chronic kidney disease in a representative elderly population in Iceland. ; Zdrojewski et al. Prevalence of chronic kidney disease in a representative sample of the Polish population: results of the NATPOL 2011 survey. ; De Nicola and Zoccali. Chronic kidney disease prevalence in the general population: heterogeneity and concerns. .)
ACKNOWLEDGEMENTS
We would like to express our gratitude to all the students and their families who participated in the study, as well as thank the teachers, heads of schools and Ministry of Education officials that helped coordinating and supervising the recruitment of students. We would like to acknowledge as well the laboratory technicians at CNDR and all the team in Nicaragua who helped in the data collection and management.
REFERENCES


Comments